
- Contact Us:
-

-

-

-


Daily Market Updates
05 Oct 2022
EURUSD
EUR/USD prolonged the acute rebound from recent 20-year lows (September 28) and this time climbed to the very doorsteps of the parity zone on turnaround Tuesday, printing at the same time new 2-week highs.
Further improvement in the risk-linked galaxy in combination with another forgettable session in the dollar allowed the pair to regain further ground and open the door at the same time to a potential visit to the psychological barrier at the parity level.
The pair’s upside bias came in contrast with another negative session in the German 10-year bund yields, which retreated for the fifth consecutive session to levels last seen in mid-September below the 1.80% yardstick.
No changes to the narrative from Fed-speakers nor news from ECB’s Lagarde, as both the Fed and the ECB seem to have embarked on a 75 bps rate hike at the October and November meetings, respectively.
In the euro docket, Producer Prices in the euro bloc rose 5% MoM in August\and 43.3% from a year earlier. In the US, Factory Orders came in flat MoM in August and JOLTs Job Openings shrank to 10.053M in the same month.
Further upside in EUR/USD should now leave behind the so far October top at 0.9993 (October 4) to allow for the continuation of the recovery to the parity level ahead of the temporary 55-day SMA at 1.0034 and the weekly peak at 1.0050 (September 20). The breakout of the latter exposes the 7-month resistance line near 1.0060. The downside pressure around the pair is expected to subside once this area is cleared, allowing for a potential visit to the September high at 1.0197 (September 12) prior to the 100-day SMA at 1.0231 and the August top at 1.0368 (August 10). On the other hand, the 2022 low at 0.9535 (September 28) should hold the initial test before the round level at 0.9500 and ahead of the weekly low at 0.9411 (June 17 2002). The daily RSI edged higher and approached 55.
Resistance levels: 0.9993 1.0050 1.0187 (4H chart)
Support levels: 0.9924 0.9752 0.9734 (4H chart)
-638005038410695060.png)
USDJPY
The violent drop in the greenback sponsored the second consecutive daily pullback in USD/JPY on Tuesday, this time revisiting the sub-144.00 region, or multi-session lows.
Indeed, the pair lost more ground and briefly pierced the 144.00 support on the back of the continuation of the steep sell-off in the dollar, while another daily decline saw US yields retreat to multi-day lows across the curve.
No data releases scheduled in Japan left the attention to the publication of the final results of the Jibun Bank Services PMI for the month of September on Wednesday.
There is a minor up barrier at the weekly top at 145.32 (October 3) ahead of the 2022 peak at 145.90 (September 7). Further north, USD/JPY is expected to test the August 1998 high at 147.67 (August 11 1998) followed by the August 1990 top at 151.65. On the contrary, the immediate contention emerges at the post-intervention low at 140.34 (September 22) ahead of the interim 55-day SMA at 138.92 and the 100-day SMA at 136.47. The breach of this region could put the weekly low at 135.80 (August 23) back on the traders’ radar prior to the weekly low at 131.73 (August 11) and the August low at 130.39 (August 2). The daily RSI faced some weakness and dropped below 60.
Resistance levels: 145.32 145.90 146.97 (4H chart)
Support levels: 143.95 143.50 141.76 (4H chart)
-638005039105992010.png)
GBPUSD
GBP/USD clinched the sixth consecutive daily advance on the back of further dollar weakness and fresh oxygen for the sterling, as market participants continued to assess the government backtrack on its tax-cut plans.
Indeed, following the all-time lows vs. the dollar on September 26 (1.0356), the sterling already gained nearly 12 cents after trading at shouting distance from the 1.1500 mark earlier in the European morning on Tuesday.
The UK docket remained empty on Tuesday, whereas New Car Sales and the more relevant S&P Global final Services PMI are due on Wednesday.
The continuation of the upside momentum should motivate GBP/USD to surpass the October top at 1.1490 (October 4). Up from here, there are no resistance levels of note until the 55-day SMA at 1.1703 followed by the September high at 1.1738 (September 13). The trespass of the latter could pave the way for a test of the weekly top at 1.1900 (August 26) prior to the 100-day SMA at 1.1954 and just ahead of the psychological 1.2000 yardstick. On the flip side, there is a minor support at 1.0538 (September 28), which precedes the all-time low at 1.0356 (September 26). The daily RSI extended the rebound past the 53 level.
Resistance levels: 1.1489 1.1589 1.1738 (4H chart)
Support levels: 1.1229 1.1024 1.0761 (4H chart)
-638005038759312776.png)
AUDUSD
AUD/USD could not sustain the earlier advance to the 0.6550 region and succumbed to the selling pressure, returning to the 0.6450 region, where it eventually met some decent support.
In fact, the Aussie dollar remained under pressure after investors perceived as dovish the earlier interest rate hike by the RBA, which raised the OCR by 25 bps in early trade (vs. market expectations of a 50 bps move).
In its statement, the RBA reiterated its commitment to bring inflation to the 2%-3% range, adding that the cash rate has risen significantly in a short period of time. Furthermore, the Board plans to keep raising the OCR in the next months.
Adding to the sour mood around the Aussie dollar, copper prices and iron ore traded in an inconclusive fashion despite the sharp decline in the dollar.
Other than the RBA meeting, advanced Building Permits expanded 28.1% MoM, Home Loans contracted at a monthly 2.7% and Investment Lending for Homes shrank 4.8%, all for the month of August.
Immediately to the downside in AUD/USD is the 2022 low at 0.6363 (September 28), while the breach of this level is expected to leave the pair vulnerable to a deeper pullback to the weekly low at 0.6253 (April 21 2020) prior to the April 2020 low at 0.5980 (April 3). On the contrary, the breakout of the weekly high at 0.6547 (October 3) could open the door to another weekly top at 0.6747 (September 20) before the temporary 55-day SMA at 0.6823 and the 100-day SMA at 0.6891. Soon above this level emerges the September peak at 0.6916 (September 13) ahead of the psychological 0.7000 mark and the weekly high at 0.7008 (August 26). The daily RSI grinded lower to the sub-35 zone.
Resistance levels: 0.6547 0.6613 0.6670 (4H chart)
Support levels: 0.6450 0.6390 0.6363 0.6337 (4H chart)
-638005039435733979.png)
GOLD
Gold prices rose to new 3-week highs near the $1,730 mark per ounce troy on the back of the persevering sell-off in the greenback and declining US yields across the curve.
Indeed, the greenback plummeted to fresh 2-week lows in the vicinity of the 110.00 region on Tuesday, while US yields managed to trim part of the daily losses. The long end of the curve, however, ended the session with marginal gains.
Investors’ preference for the risk complex has been exacerbated following the loss of momentum in some US fundamentals, which carry the potential to prompt the Federal Reserve to slow the pace of the current aggressive rate path, all morphing into extra support for the yellow metal.
Next on the upside for gold comes the September high at $1,735 (September 12) prior to the $1,765 level (August 25). The latter appears reinforced by the proximity of the 100-day SMA, while the surpass of this region should expose a move to the critical $1,800 zone, which precedes the August top at $1,807 (August 10). On the flip side, the 2022 low at $1,614 (September 28) still emerges as the next magnet for bears ahead of the round level at $1,600 and seconded the April 2020 low at $1,572 (April 1).
Resistance levels: $1,729 $1,735 $1,745 (4H chart)
Support levels: $1,699 $1,659 $1,641 (4H chart)
-638005039766734936.png)
CRUDE WTI
The recovery in crude oil prices remained well and sound for another session and this time sponsored the move to 3-week highs in prices of the WTI to levels just short of the $87.00 mark on Tuesday.
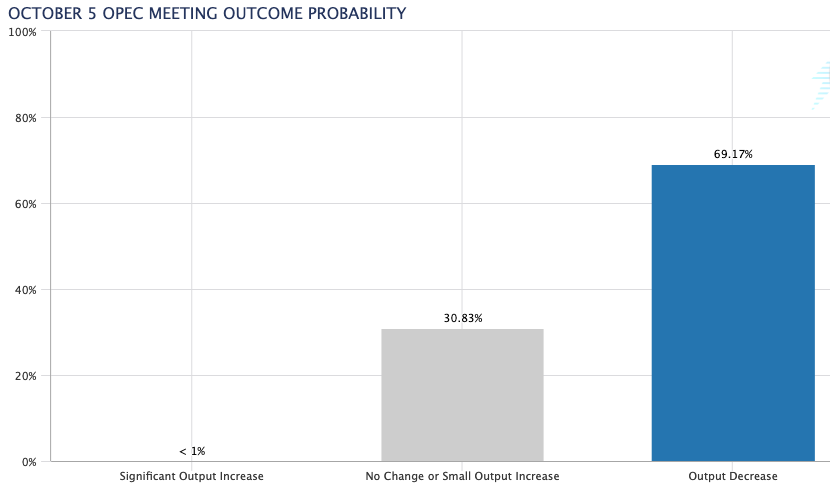
The solid rebound in prices of the West Texas Intermediate came on the back of rumours that the OPEC+ could cut its oil output by 2 mbpd at its meeting on October 5, which should add to the omnipresent tight supply conditions of the market.
The above, in combination with the beginning of European sanctions on Russian crude oil and the end of the US SPR release, should add fresh upside pressure to the commodity in the short-term horizon.
Speaking about the OPEC+ gathering, CME Group OPEC Watch Tool sees the possibility of a reduction of the oil production at almost 70%.
Later in the NA session, the API will report on the US crude oil supplies in the week to September 30.
If the rebound in WTI gathers extra steam, then a visit to the weekly high at $90.17 (September 14) could start emerging on the horizon ahead of the September top at $90.37 (September 5). North from here, the next hurdle aligns at the weekly peak at $97.65 (August 30), an area coincident with the key 200-day SMA and ahead of the psychological $100.00 mark. The immediate down barrier, in the meantime, turns up at the September low at $76.28 (September 26) ahead of the 2022 low at $74.30 (January 3). The breach of the latter could pave the way for a deeper drop to the weekly low at $66.15 (December 20 2021) prior to the December 2021 low at $62.46 (December 2).
Resistance levels: $86.95 $90.17 $90.37 (4H chart)
Support levels: $82.18 $79.12 $76.54 (4H chart)
-638005040419009827.png)
DOW JONES
Investors’ optimism remained well and sound and extended the auspicious start of the month/quarter on turnaround Tuesday.
Indeed, another strong session in US equities saw the three major US stock indices climb to fresh multi-session peaks on the back of the persistent selling pressure in the dollar and further decline in US yields.
All in all, the Dow Jones gained 2.40% to 30,199, the S&P500 rose 2.66% to 3,776 and the tech-reference Nasdaq Composite advanced 2.68% to 11,109.
In light if the recent strong upside, the Dow Jones is now expected to face the next up barrier at the weekly high at 31,026 (September 19) ahead of the September top at 32,504 (September 12) and the 200-day SMA at 33,147. The surpass of the latter could open the door to the 33,364 level (August 26). On the other hand, the 2022 low at 28,715 (September 30) emerges as the initial support before the October 2020 low at 26,143 (October 30). The daily RSI leapt to the 46 area.
Top Performers: Salesforce Inc, Boeing, Caterpillar
Worst Performers: Coca-Cola, Merck&Co, Amgen
Resistance levels: 30,308 31,020 31,706 (4H chart)
Support levels: 28,715 26,143 26,013 (4H chart)
-638005040758049821.png)
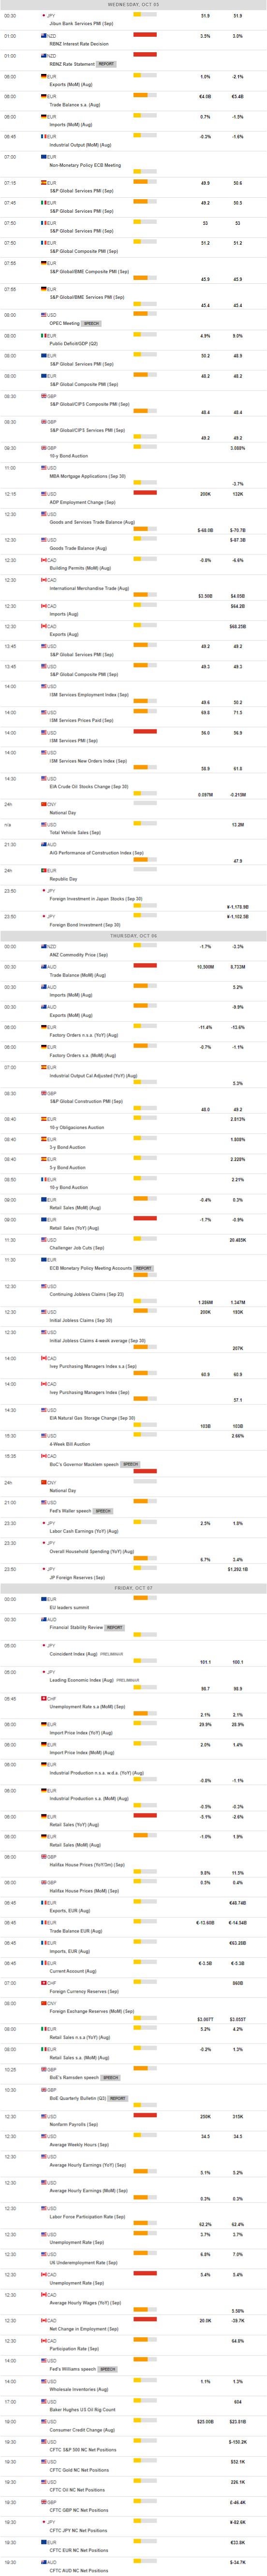
MACROECONOMIC EVENTS
All Information & Updates provided by:

All information relating to the financial markets available on this page has been prepared and issued by FXStreet (Forexstreet SL, Spain, Reg: B62498233) on the basis of publicly available information and all information believed to be reliable and does not conflict with Kuwaiti local laws, and all necessary care has been taken to before the company to ensure that the facts mentioned are correct from the source.
NCM Investment nor any of its directors or employees shall in any way be held responsible for the contents of this news, and the information contained on this page is intended only to provide clients with publicly available information and should not be construed as investment advice, report or analysis and/or constitute an offer or invitation to buy or sell financial instruments of any kind.
RISK WARNING: Forex and CFDs are highly risky leveraged products, as losses can exceed deposits. Please ensure you understand all the risks and take independent advice if necessary. NCM will segregate the clients based on the criteria of the regulator and its bylaws. NCM does not provide any advisory service; the material published does not constitute advice or a recommendation for a transaction in any financial instrument. NCM accepts no responsibility for any use of the content presented and any consequences of that use. Anyone acting on the information provided does so at their own risk.