
- Contact Us:
-

-

-

-


Daily Market Updates
06 Oct 2022
EURUSD
EUR/USD saw its recent strong rebound abruptly halted in response to the resumption of the buying interest around the greenback. Against that, the pair has once again faltered ahead of the parity zone, triggering a subsequent sharp decline to the 0.9830 zone on Wednesday.
On the greenback side, the USD Index (DXY) managed to regain solid upside traction and reclaimed the area well beyond 111.00 the figure after an initial pullback to the vicinity of the 110.00 region.
In addition, daily gains in the buck were accompanied by the recovery in US yields across the curve in an atmosphere where market participants continue to see the Federal Reserve - and the ECB – hiking by ¾ point at the upcoming gathering.
In the domestic calendar, Germany’s trade surplus narrowed to €1.2B in August, while final Services PMI eased to 45.0 and 48.8 when it came to the broader Euroland.
In the US calendar, MBA Mortgage Applications contracted 14.2% in the week to September 30, the ADP Employment Change rose more than expected by 208K in September and the trade deficit shrank to $67.4B in August. Looking at the services sector, the final Services PMI improved to 49.3 in September and the ISM Non-Manufacturing surpassed estimates at 56.7, also during last month.
In case of a deeper pullback, EUR/USD is not expected to meet any significant support level until the 2022 low at 0.9535 (September 28), which precedes the round level at 0.9500 and comes before the weekly low at 0.9411 (June 17 2002). Bulls, in the meantime, need to surpass the so far October peak at 0.9999 (October 4) to open the door to a probable test of the interim 55-day SMA at 1.0029 ahead of the weekly high at 1.0050 (September 20). Further north comes the 7-month resistance line near 1.0060, above which the pair’s selling pressure is predicted to mitigate. North from here turns up the September top at 1.0197 (September 12) ahead of the 100-day SMA at 1.0225 and the August peak at 1.0368 (August 10). The daily RSI halted the upside and broke below 49.
Resistance levels: 0.9921 0.9999 1.0050 (4H chart)
Support levels: 0.9869 0.9752 0.9734 (4H chart)
-638005912000761188.png)
USDJPY
The intense recovery in the dollar coupled with the resumption of the uptrend in US yields across the curve lent fresh legs to USD/JPY and propelled it back to the upper 144.00s on Wednesday.
Indeed, spot reversed two consecutive daily pullbacks and managed at the same time to set aside an earlier drop to the mid-143.00s, as the change of heart in the buck and the upbeat note in yields were already shaping up.
In the Japanese docket, the final Jibun Bank Services PMI improved to 52.2 for the month of September (from 49.5).
The continuation of the upside bias in USD/JPY should revisit the weekly peak at 145.32 (October 3) prior to the 2022 high at 145.90 (September 7). The trespass of the latter could prompt the August 1998 top at 147.67 (August 11 1998) to emerge on the horizon ahead of the August 1990 peak at 151.65. On the downside, the post-intervention low at 140.34 (September 22) is expected to resurface as the next support of note before the temporary 55- and 100-day SMAs at 139.04 and 136.63, respectively. Down from here comes the weekly low at 135.80 (August 23) seconded by the weekly low at 131.73 (August 11) and the August low at 130.39 (August 2). The daily RSI gained upside traction and traded close to 62.
Resistance levels: 145.32 145.90 146.97 (4H chart)
Support levels: 143.52 141.83 140.34 (4H chart)
-638005912620487021.png)
GBPUSD
GBP/USD dropped markedly and gave away part of the recent strong advance following six consecutive sessions with gains, all after printing an all-time low near 1.0350 on September 26.
The strong resumption of the sentiment towards the greenback sponsored a deep knee-jerk in the risk complex and forced the quid to return to the 1.1230/20 band after poking with 1.1500 the figure vs. the dollar during early trade.
In the UK, final figures saw the always-relevant Services PMI stick to the expansion territory at 50 for the month of September, exceeding expectations although a bit lower than August’s 50.9.
If bulls regain the upper hand, GBP/USD should meet the initial hurdle at the October peak at 1.1495 (October 5) ahead of the 55-day SMA at 1.1692. The move above the latter could put the September high at 1.1738 (September 13) back on the radar prior to the weekly top at 1.1900 (August 26). Extra gains should then target the 100-day SMA at 1.1944 and the psychological 1.2000 mark. On the contrary, the 1.0538 level (September 28) turns up as the immediate minor support before the all-time low at 1.0356 (September 26). The daily RSI deflated to the proximity of the 46 mark.
Resistance levels: 1.1433 1.1495 1.1589 (4H chart)
Support levels: 1.1226 1.1024 1.0761 (4H chart)
-638005912274514935.png)
AUDUSD
Further strength in the greenback motivated AUD/USD to shed ground for the second consecutive session on Wednesday, this time retesting the 0.6420/15 band.
Indeed, USD-bulls returned to the forefront and sparked a sharp correction in the risk-linked galaxy, putting the Aussie dollar under extra pressure as well as the rest of the commodity universe and USD-labeled assets.
Still around commodities, marginal gains in copper prices and the iron ore failed to lend some support to AUD.
Data wise Down Under, final figures saw the S&P Global Services PMI improve to 50.6 in September, while Retail Sales expanded at a monthly 0.6% in the same period.
Next on the downside for AUD/USD emerges the 2022 low at 0.6363 (September 28) ahead of the weekly low at 0.6253 (April 21 2020) and the April 2020 low at 0.5980 (April 3). In the opposite direction, there is initial resistance at the weekly top at 0.6547 (October 3) followed by another weekly peak at 0.6747 (September 20). If the upside momentum gathers extra impulse, then the temporary 55-day SMA at 0.6818 should turn up followed by the 100-day SMA at 0.6886. North from here appears the September high at 0.6916 (September 13), which precedes the psychological 0.7000 yardstick and the weekly top at 0.7008 (August 26). The daily RSI lost some composure and slipped back below 38.
Resistance levels: 0.6547 0.6613 0.6670 (4H chart)
Support levels: 0.6416 0.6390 0.6363 0.6337 (4H chart)
-638005915391600729.png)
GOLD
After six consecutive daily advances, gold prices came under pressure and retreated from the area of recent tops near $1,730 per ounce troy and revisited the $1,700 neighbourhood on Wednesday.
The knee-jerk in bullion and the rest of the precious metals came in tandem with the acute bounce in the greenback, which encouraged the USD Index (DXY) to reverse course and regain the 111.00 hurdle and above.
Also weighing on the yellow metal also appeared the resumption of the upside bias in US yields across the curve, which was particularly exacerbated following auspicious results from US fundamentals.
Considering the recent price action, further gains continue to target the September top at $1,735 (September 12) ahead of the $1,765 level (August 25), which still looks underpinned by the vicinity of the 100-day SMA. If the metal clears this area, then it could challenge the critical $1,800 zone, closely followed by the August peak at $1,807 (August 10). Conversely, the 2022 low at $1,614 (September 28) is expected to hold the downside for the time being before the round level at $1,600 and ahead of the April 2020 low at $1,572 (April 1).
Resistance levels: $1,729 $1,735 $1,745 (4H chart)
Support levels: $1,698 $1,659 $1,641 (4H chart)
-638005915696294576.png)
CRUDE WTI
Prices of the barrel of the American benchmark for the sweet light crude oil rose for the third session in a row on Wednesday and reached new 3-week highs in levels just short of the key $90.00 mark.
Traders’ upbeat mood was reinforced after the OPEC+ announced a 2 mbpd oil output cut at its meeting in Vienna earlier on Wednesday, embarking at the same time on a collision course with the Biden administration, which was looking for a smaller reduction and hinted at the likelihood of further release of oil reserves in the wake of the cartel’s decision.
Following the OPEC+ announcement, Saudi Arabia justified the reduction in oil production in the ongoing tightening conditions from major central banks and the prospects of a global slowdown and the direct impact on crude oil demand.
Adding to the upside in prices, the EIA reported a 1.356M barrels drop in US crude oil inventories in the week to September 30, while supplies at Cushing went up by 0.273M barrels and gasoline stockpiles shrank by 4.728M barrels.
Next on the upside for WTI now emerges the weekly top at $90.17 (September 14) closely followed by the September peak at $90.37 (September 5). The surpass of the latter could prompt the WTI to confront the weekly high at $97.65 (August 30) just before the key 200-day SMA ($97.73) and the psychological $100.00 level. The immediate contention, in the meantime, appears at the September low at $76.28 (September 26) prior to the 2022 low at $74.30 (January 3). If bears push harder, then the weekly low at $66.15 (December 20 2021) could start emerging on the horizon before the December 2021 low at $62.46 (December 2).
Resistance levels: $88.41 $90.17 $90.37 (4H chart)
Support levels: $85.28 $82.18 $79.12 (4H chart)
-638005916344457301.png)
DOW JONES
US equities retraced part of the auspicious start of the week and traded modestly on the defensive on Wednesday when gauged by the three major stock indices.
In fact, better-than-expected prints from the ISM Non-Manufacturing and the solid prints from the ADP report poured cold water over investors’ expectations that the Fed could reverse a gear in its aggressive normalization plan.
Adding to the sour sentiment among investors, the greenback came back roaring and lifted the USD Index (DXY) past the 111.00 barrier and US yields charted decent gains across the curve.
Against that, the Dow Jones retreated 0.18% to 30,268, the S&P500 deflated 0.31% to 3,779 and the tech-heavy Nasdaq Composite dropped 0.66% to 11,101.
The October high at 30,345 (October 5) now emerges as the next target for bulls prior to the weekly top at 31,026 (September 19) and the September peak at 32,504 (September 12). Further gains could then see the Dow Jones challenge the 200-day SMA at 33,122 ahead of the 33,364 level (August 26). Inversely, there are no support levels of note until the 2022 low at 28,715 (September 30), which comes ahead of the October 2020 low at 26,143 (October 30). The daily RSI corrected lower and breached 47.
Top Performers: Nike, Visa A, Chevron
Worst Performers: Goldman Sachs, Walt Disney, JPMorgan
Resistance levels: 30,345 31,020 31,693 (4H chart)
Support levels: 29,886 28,715 26,143 (4H chart)
-638005916761555512.png)
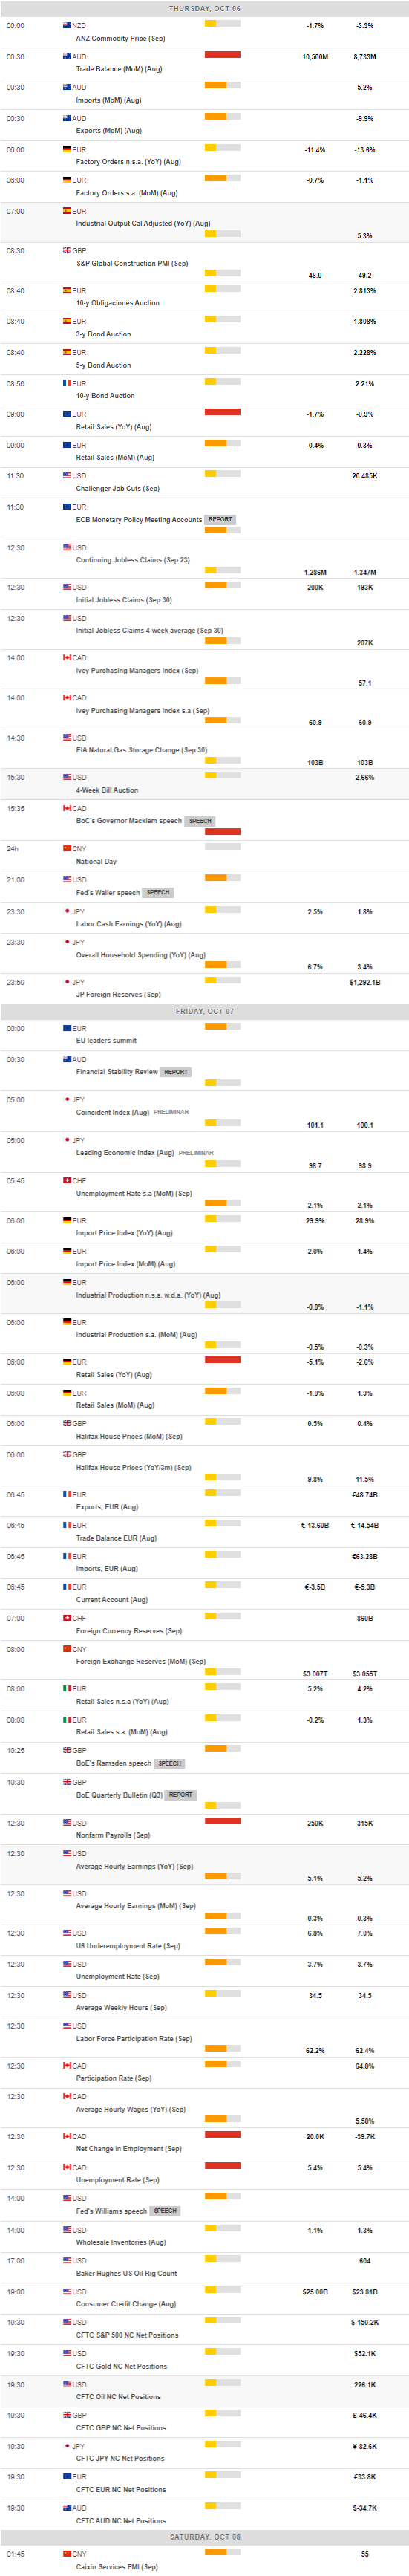
MACROECONOMIC EVENTS
All Information & Updates provided by:

All information relating to the financial markets available on this page has been prepared and issued by FXStreet (Forexstreet SL, Spain, Reg: B62498233) on the basis of publicly available information and all information believed to be reliable and does not conflict with Kuwaiti local laws, and all necessary care has been taken to before the company to ensure that the facts mentioned are correct from the source.
NCM Investment nor any of its directors or employees shall in any way be held responsible for the contents of this news, and the information contained on this page is intended only to provide clients with publicly available information and should not be construed as investment advice, report or analysis and/or constitute an offer or invitation to buy or sell financial instruments of any kind.
RISK WARNING: Forex and CFDs are highly risky leveraged products, as losses can exceed deposits. Please ensure you understand all the risks and take independent advice if necessary. NCM will segregate the clients based on the criteria of the regulator and its bylaws. NCM does not provide any advisory service; the material published does not constitute advice or a recommendation for a transaction in any financial instrument. NCM accepts no responsibility for any use of the content presented and any consequences of that use. Anyone acting on the information provided does so at their own risk.