
- Contact Us:
-

-

-

-


Daily Market Updates
07 Oct 2022
EURUSD
EUR/USD retreated for the second session in a row and this time revisited the sub-0.9800 region, or 3-day lows.
The continuation of the upside momentum in the greenback motivated the USD Index (DXY) to surpass the 112.00 mark and advance to multi-session tops on Thursday, which was in turn underpinned by another positive session in US yields across the curve.
Market participants remained bearish on the risk complex and supported further the dollar ahead of the key Nonfarm Payrolls event due on Friday. This release grew in importance as of late amidst the current data-dependent stance from the Fed, as it could directly impact on the size and extension of the next interest rate hikes.
No reaction from the FX space to the release of the ECB Accounts, where members largely favoured a 75 bps rate hike, while some of them leant towards a half point raise. Members agreed that inflation was far too high and it is seen above the banks’ target for an extended period. The Accounts also mentioned that the depreciation of the euro could intensify the inflation pressures.
In the Euroland, Germany’s Factory Orders contracted 2.4% MoM in August while the Construction PMI eased to 41.8 in September (from 42.6). In addition, Retail Sales in the broader euro bloc contracted 2.0% in the year to August.
Across the pond, Initial Claims rose by 219K in the week to October 1 and Challenger Job Cuts increased to 29.989K in September.
The continuation of the selling pressure could pave the way for EUR/USD to retest the 2022 low at 0.9535 (September 28) ahead of the round level at 0.9500 and the weekly low at 0.9411 (June 17 2002). In the opposite direction, the October high at 0.9999 (October 4) should offer initial resistance ahead of the temporary 55-day SMA at 1.0021 and the weekly top at 1.0050 (September 20). The latter coincides with the 7-month resistance line and could spark further gains once it is cleared to, initially, the September peak at 1.0197 (September 12) before the 100-day SMA at 1.0217 and the August high at 1.0368 (August 10). The daily RSI deflated further and breached the 45 yardstick.
Resistance levels: 0.9916 0.9999 1.0050 (4H chart)
Support levels: 0.9788 0.9752 0.9734 (4H chart)
-638006787209973042.png)
USDJPY
USD/JPY added to Wednesday’s advance and surpassed once again the 145.00 hurdle on Thursday, always underpinned by the continuation of the bid bias in the dollar in combination with another positive session in US yields.
On the latter, US yields across the curve extended the recovery to multi-day highs, as persistent hawkish messages from Fed’s rate-setters continued to bolster the tighter-for-longer stance from the Federal Reserve.
The greenback, in the meantime, climbed further and fresh demand sponsored the breakout of the 112.00 barrier in the USD Index (DXY).
Data wise in Japan, Foreign Bond Investment shrank to ¥886.3B in the week to October 1, in what was the sole release scheduled on Thursday.
The weekly high at 145.32 (October 3) remains as the immediate hurdle in case USD/JPY extends the upside in the short term. Above this level comes the 2022 top at 145.90 (September 7) prior to the August 1998 peak at 147.67 (August 11 1998) and the August 1990 high at 151.65. On the flip side, there is initial contention at the post-intervention low at 140.34 (September 22) seconded by the interim 55- and 100-day SMAs at 139.18 and 136.81, respectively. Further south emerges the weekly low at 135.80 (August 23) ahead of another weekly low at 131.73 (August 11) and the August low at 130.39 (August 2). The daily RSI picked up pace and revisited the area above 63.
Resistance levels: 145.07 145.32 145.90 (4H chart)
Support levels: 143.52 141.83 140.34 (4H chart)
-638006787949963913.png)
GBPUSD
Price action in the sterling fell in line with the rest of its risky peers and dragged GBP/USD to fresh 3-session lows in the 1.1115/10 band on Thursday.
The persevering recovery in the US dollar along with the risk-off tone and higher US yields, all forced cable to give away part of the strong weekly ascent to the boundaries of 1.1500 the figure on October 5.
In the UK, the S&P Global Construction PMI returned to expansion territory at 52.3 in September (from 49.2).
Extra weakness in GBP/USD is expected to meet the next support of note at the minor 1.0538 level (September 28) ahead of the all-time low at 1.0356 (September 26). On the contrary, the October high at 1.1495 (October 5) emerges as the next target for bulls prior to the 55-day SMA at 1.1677, which precedes the September top at 1.1738 (September 13). If the upside gathers extra impulse, then a probable visit to the weekly top at 1.1900 (August 26) could start emerging on the horizon ahead of the 100-day SMA at 1.1931 and the psychological 1.2000 level. The daily RSI ticked lower and flirted with 43.
Resistance levels: 1.1420 1.1495 1.1589 (4H chart)
Support levels: 1.1112 1.1024 1.0761 (4H chart)
-638006787575090859.png)
AUDUSD
The continuation of the buying pressure in the greenback motivated AUD/USD to clinch the third consecutive session with losses in a context clearly unfavorable for the riskier assets and high-beta currencies.
Indeed, spot retreated to fresh weekly lows in the 0.6390/85 band following the relentless pick-up in the dollar, while mixed performance in the commodity universe also weighed on the Aussie dollar. On the latter, copper prices markedly reversed two daily gains in a row, while the lack of upside traction remained unaltered in the iron ore.
In Oz, the trade surplus narrowed a little to A$8.324B in August, with exports expanding 3% and Imports 4%.
AUD/USD remains under heavy pressure and seems on its way to retest the 2022 low at 0.6363 (September 28) sooner rather than later. The loss of the later could open the door to the weekly low at 0.6253 (April 21 2020) prior to the April 2020 low at 0.5980 (April 3). Inversely, the weekly peak at 0.6547 (October 3) remains the initial up barrier in case of occasional bullish attempts ahead of another weekly high at 0.6747 (September 20). The continuation of the rebound could see the interim 55- and 100-day SMAs at 0.6807 and 0.6880, respectively, revisited prior to the September top at 0.6916 (September 13) and the psychological 0.7000 yardstick. The daily RSI receded further and broke below 35.
Resistance levels: 0.6540 0.6613 0.6670 (4H chart)
Support levels: 0.6389 0.6363 0.6337 (4H chart)
-638006788482732507.png)
GOLD
Gold prices added to Wednesday’s losses and charted the second straight session with losses, although the $1,700 region seems to have held the downside pretty well so far.
Once again, the persistent upbeat tone in the greenback lent further legs to the USD Index (DXY) and lifted it to 3-day peaks past the 112.00 mark, while another daily uptick in US yields also put the yellow metal under extra downside pressure.
Bullion, in the meantime, is expected to remain under the microscope ahead of the key publication of US Nonfarm Payrolls on Friday, where a positive surprise is seen reinforcing the current Fed’s aggressive rate path, and thus adding pressure to the non-yielding metal.
The September peak at $1,735 (September 12) should come first in case gold resumes the upside in the near term. The surpass of the latter should put the $1,765 level (August 25) back on the traders’ radar, an area underpinned by the 100-day SMA. Beyond the latter appears the critical $1,800 zone seconded by the August high at $1,807 (August 10). On the downside, the 2022 low at $1,614 (September 28) offers initial contention prior to the round level at $1,600 and before the April 2020 low at $1,572 (April 1).
Resistance levels: $1,729 $1,735 $1,745 (4H chart)
Support levels: $1,700 $1,659 $1,641 (4H chart)
-638006788844673346.png)
CRUDE WTI
Prices of the barrel of the WTI clinched the fourth consecutive session with gains on Thursday, coming in short of the $89.00 mark.
Another uptick in crude oil prices came as traders continued to digest the recent decision by the OPEC+ to cut the cartel’s production quotas to 2 mbpd at its meeting on October 5, although the real reduction of the crude oil production would be between 1 mbpd and 1.1 mbpd, according to Saudi Arabia.
Following the cartel’s announcement, President Biden hinted at the possibility of the release of further strategic reserves to keep prices subdued, as he called the OPEC+ decision as “shortsighted”.
Immediately to the upside for WTI comes the October top at $88.76 (October 6) closely followed by the weekly peak at $90.17 (September 14) and the September high at $90.37 (September 5). The breakout of this level could pave the way for a move to the weekly top at $97.65 (August 30) ahead of the key 200-day SMA at $97.79 and prior to the psychological $100.00 level. Conversely, the September low at $76.28 (September 26) is expected to hold the initial test before the 2022 low at $74.30 (January 3). A deeper drop could see the weekly low at $66.15 (December 20 2021) revisited before the December 2021 low at $62.46 (December 2).
Resistance levels: $88.76 $90.17 $90.37 (4H chart)
Support levels: $86.47 $85.48 $82.18 (4H chart)
-638006790592568972.png)
DOW JONES
Equities tracked by the three major US stock indices dropped for the second consecutive day on Thursday following renewed concerns among investors that the Fed could intensify its tightening bias ahead of the key Nonfarm Payrolls due on Friday.
Indeed, better-than-expected results from some US fundamentals earlier in the week reminded traders that the Fed remains well on its way to hike rates by 75 bps in November followed by further large rate hikes in the subsequent meetings if the economy does not give signs of cooling off.
All in all, the Dow Jones shed 0.93% to 29,993, the S&P500 lost 0.73% to 3,755 and the tech-reference Nasdaq Composite retreated 0.34% to 11,112.
The continuation of the decline could prompt the Dow Jones to revisit the 2022 low at 28,715 (September 30) prior to the October 2020 low at 26,143 (October 30). On the other hand, the surpass of the October top at 30,454 (October 5) could motivate the weekly peak at 31,026 (September 19) to re-emerge on the horizon ahead of the September high at 32,504 (September 12). North from here comes the 200-day SMA at 33,097 before the 33,364 level (August 26). The daily RSI lost further ground and breached 45.
Top Performers: Chevron, Home Depot, Caterpillar
Worst Performers: 3M, IBM, Walgreen Boots
Resistance levels: 30,454 31,020 31,673 (4H chart)
Support levels: 29,886 28,715 26,143 (4H chart)
-638006792247539388.png)
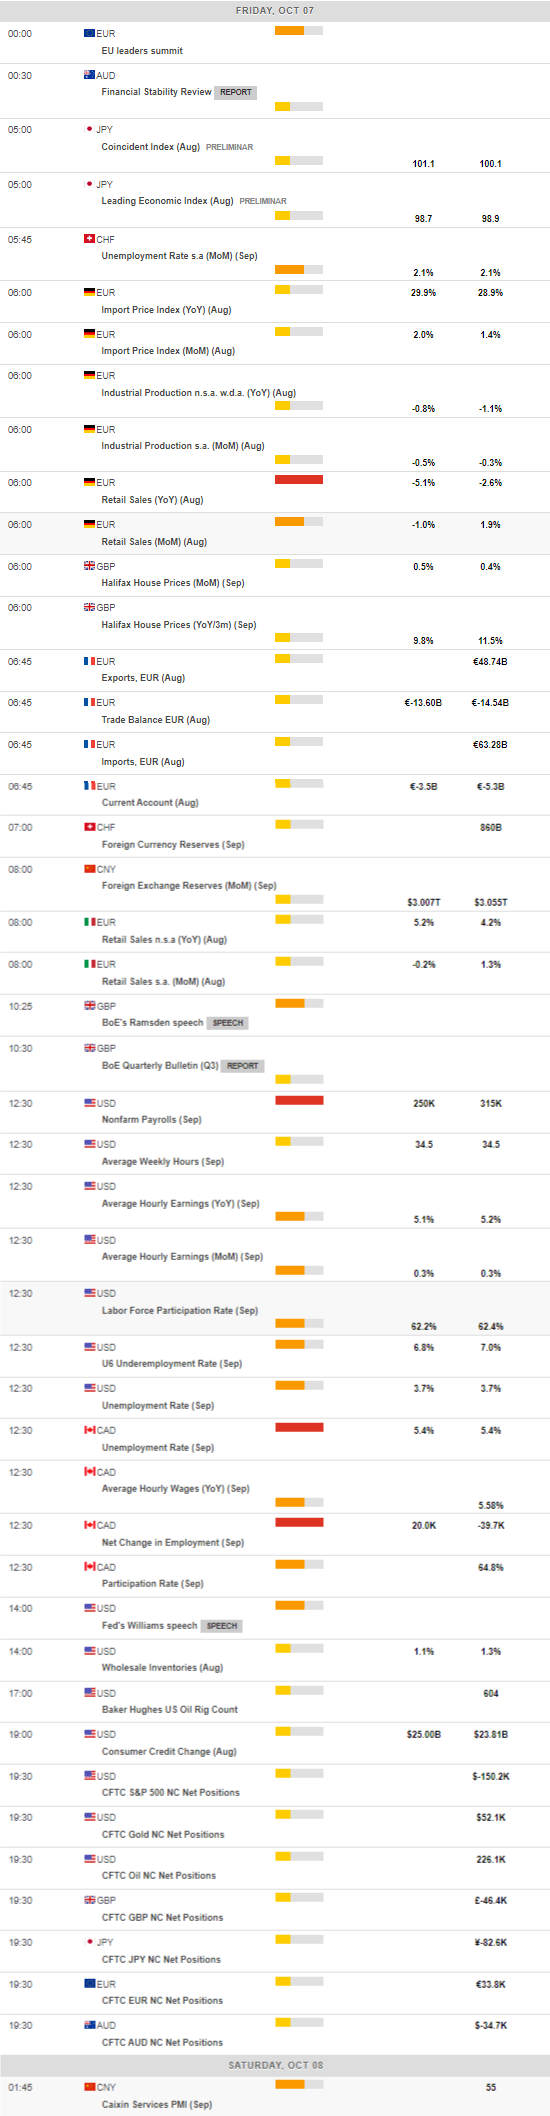
MACROECONOMIC EVENTS
All Information & Updates provided by:

All information relating to the financial markets available on this page has been prepared and issued by FXStreet (Forexstreet SL, Spain, Reg: B62498233) on the basis of publicly available information and all information believed to be reliable and does not conflict with Kuwaiti local laws, and all necessary care has been taken to before the company to ensure that the facts mentioned are correct from the source.
NCM Investment nor any of its directors or employees shall in any way be held responsible for the contents of this news, and the information contained on this page is intended only to provide clients with publicly available information and should not be construed as investment advice, report or analysis and/or constitute an offer or invitation to buy or sell financial instruments of any kind.
RISK WARNING: Forex and CFDs are highly risky leveraged products, as losses can exceed deposits. Please ensure you understand all the risks and take independent advice if necessary. NCM will segregate the clients based on the criteria of the regulator and its bylaws. NCM does not provide any advisory service; the material published does not constitute advice or a recommendation for a transaction in any financial instrument. NCM accepts no responsibility for any use of the content presented and any consequences of that use. Anyone acting on the information provided does so at their own risk.