
- Contact Us:
-

-

-

-


Daily Market Updates
10 Oct 2022
EURUSD
The bearish performance in EUR/USD extended for the third consecutive session on Friday against the usual backdrop of the extra improvement in the sentiment surrounding the greenback. Against that, the pair extended the corrective decline to the 0.9730/25 band after coming just short of the parity level on Monday and Tuesday.
Indeed, the USD Index (DXY) accelerated its gains after another healthy prints from US Nonfarm Payrolls, this time showing the economy added 263K jobs (vs. 250K expected) and the Unemployment Rate edging lower to 3.5% from 3.7% in September.
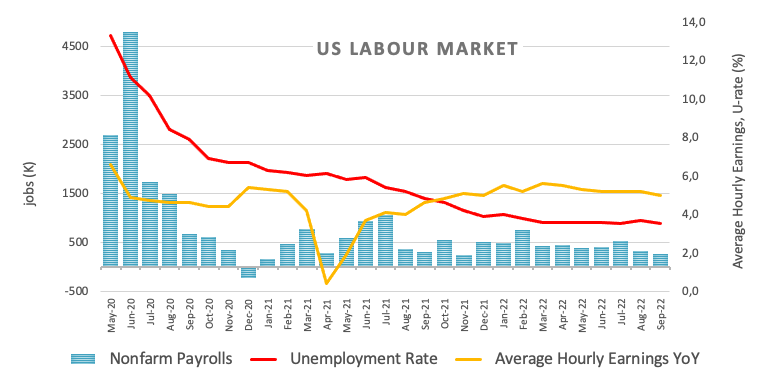
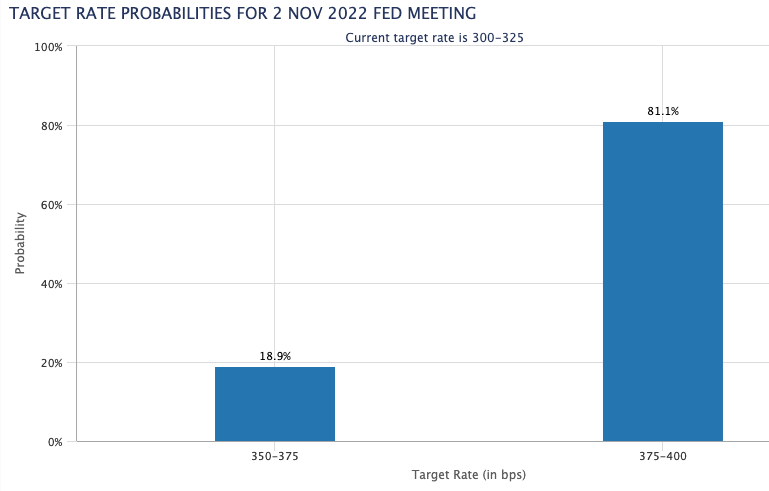
The solid prints from the US labour market did nothing but reinforce the case for the continuation of the tight stance by the Federal Reserve, as well as a ¾ point rate hike at the November 2 gathering.
On the latter, CME Group’s FedWatch tool now sees the probability of such a raise above 81%, from just past3.0% a month ago.
Additional data in the US docket saw Average Hourly Earnings expand 0.3% MoM and 5.0% YoY and the Participation Rate ease marginally to 62.3% (from 62.4%). In addition, Wholesale Inventories expanded 1.3% MoM in August and Consumer Credit Change rose to $32.24B also in August.
In the euro area, Germany’s Retail Sales Earlier shrank 4.6% in the year to August and Industrial Production contracted at a monthly 0.8%.
A deeper pullback in EUR/USD is not expected to see any support of note until the 2022 low at 0.9535 (September 28) prior to the round level at 0.9500 and the weekly low at 0.9411 (June 17 2002). On the flip side, there is an initial hurdle at the October top at 0.9999 (October 4) which precedes the interim 55-day SMA at 1.0012 and the weekly peak at 1.0050 (September 20). Further up comes the 7-month resistance and the pair could see its downside pressure mitigated once this region is cleared. North from here turns up the September high at 1.0197 (September 12) ahead of the 100-day SMA at 1.0209 and the August top at 1.0368 (August 10). The daily RSI deflated to the sub-42 area.
Resistance levels: 0.9816 0.9911 0.9999 (4H chart)
Support levels: 0.9726 0.9635 0.9535 (4H chart)
-638009200548557699.png)
USDJPY
Further upside in the greenback and the persevering rebound in US yields across the curve sponsored the third straight session with gains in USD/JPY.
Indeed, the pair closed above the 145.00 level for the second session in a row following the equally strong bounce in the USD Index (DXY) – which extended the move well north of 112.00 – and multi-session highs in US yields, particularly after US Nonfarm Payrolls surpassed expectations in September (+263K).
In the Japanese calendar, Household Spending expanded 5.1% in the year to August, while preliminary figures saw the Coincident Index advance a tad to 101.7 and 100.9 when it came to the Leading Economic Index, both prints also for the month of August.
USD/JPY now faces the immediate hurdle at the weekly top at 145.44 (October 7) seconded by the 2022 peak at 145.90 (September 7) and the August 1998 high at 147.67 (August 11 1998). Further north emerges the August 1990 top at 151.65. On the contrary, the weekly low at 143.52 (October 5) comes first followed by the post-intervention low at 140.34 (September 22). A deeper retracement could pave the way for a test of the temporary 55- and 100-day SMAs at 139.35 and 136.98, respectively. The breach of that region exposes the weekly low at 135.80 (August 23) before another weekly low at 131.73 (August 11) and the August low at 130.39 (August 2). The daily RSI advanced further and approached 65.
Resistance levels: 145.44 145.90 146.97 (4H chart)
Support levels: 144.63 144.38 143.52 (4H chart)
-638009201750116386.png)
GBPUSD
GBP/USD clinched the third daily decline in a row and extended the corrective decline from weekly peaks in the very doorsteps of the 1.1500 hurdle, revisiting once again the 1.1050 region at the end of the week.
As always, the pick-up in the demand for the greenback weighed on the risk complex and forced the sterling to give away part of the abrupt climb recorded in the first half the week.
From the BoE, MPC member Ramsden noted, among other things, that the adjustment in market prices has been consistent with the global tighter monetary conditions.
Data wise in the UK, house prices tracked by the Halifax House Price Index contracted 0.1% MoM and 9.9% in the year to September.
In case GBP/USD extend the leg lower in the next sessions, it should meet a minor support at the 1.0538 level (September 28) prior to the all-time low at 1.0356 (September 26). In the opposite direction, there is an initial hurdle at the October top at 1.1495 (October 5) ahead of the 55-day SMA at 1.1660 and the September peak at 1.1738 (September 13). The surpass of this level could pave the way for a move to the weekly high at 1.1900 (August 26) before the 100-day SMA at 1.1917 and the psychological 1.2000 mark. The daily RSI dropped below the 42 yardstick.
Resistance levels: 1.1225 1.1383 1.1397 (4H chart)
Support levels: 1.1055 1.1024 1.0761 (4H chart)
-638009201379420922.png)
AUDUSD
AUD/USD printed the fourth daily drop in a row and recorded at the same time new lows in an area las seen back in April 2020 around 0.6350 on Friday.
The perceived strength in the greenback coupled with the expected continuation of the Fed’s aggressive normalization of its monetary policy put the Aussie dollar under heightened pressure and favoured a deeper decline this past week.
Adding to the sour mood around AUD this week emerged the dovish hike by the RBA on October 4 and the marked losses in the commodity space at the end of the week.
Next on tap in the Australian calendar will be the Consumer Confidence Index measured by Westpac and due on October 11.
The 2022 low at 0.6354 appears as the immediate contention for AUD/USD ahead of the weekly low at 0.6253 (April 21 2020). Down from here comes the psychological yardstick at 0.6000 prior to the April 2020 low at 0.5980 (April 3). Contrarily, bouts of strength should meet the next hurdle at the weekly highs at 0.6547 (October 3) and 0.6747 (September 20). North from here turns up the interim 55- and 100-day SMAs at 0.6797 and 0.6873, respectively, before the September peak at 0.6916 (September 13) and the psychological 0.7000 mark. The daily RSI deflated to the proximity of the 32 region.
Resistance levels: 0.6432 0.6540 0.6705 (4H chart)
Support levels: 0.6354 0.6337 0.6282 (4H chart)
-638009202057694325.png)
GOLD
Another negative session saw gold prices drop for the third session in a row on Friday, closing below the key $1,700 mark per ounce troy for the first time since Monday.
The stronger greenback encouraged the USD Index (DXY) to rapidly leave behind the 112.00 barrier and record multi-session peaks in combination with the unabated climb in US yields across the curve.
Bullion is expected to remain under the microscope for the time being amidst the continuation of the Fed’s normalization plans, which were underpinned further following another robust figures from the US job creation during last month.
Extra weakness in gold now targets the 2022 low at $1,614 (September 28) ahead of the round level at $1,600 and prior to the April 2020 low at $1,572 (April 1). In case bulls regain the upper hand, the September high at $1,735 (September 12) could be revisited ahead of the 100-day SMA at $1,759 and followed by the $1,765 level (August 25). If the precious metal pushes higher, then the critical $1,800 zone could emerge on the horizon before the August top at $1,807 (August 10).
Resistance levels: $1,714 $1,725 $1,735 (4H chart)
Support levels: $1,690 $1,659 $1,641 (4H chart)
-638009202365919041.png)
CRUDE WTI
The rally in crude oil prices remained unabated and advanced beyond the $93.00 mark per barrel on Friday, clinching at the same time the fifth consecutive daily advance and the second weekly gain in a row.
The optimism among traders morphed into extra legs for the WTI and pushed prices higher following the OPEC+ decision to cut the oil output by 2 mbpd at its meeting in Vienna on October 5.
Indeed, recession fears appear to have taken a breather this week, although they remain well in the front seat, particularly following solid prints from the US labour market report in September, which propped up the current aggressive tightening bias from the Federal Reserve (and central banks overseas).
In the calendar, driller Baker Hughes reported that US oil rig count went down by 2 to 602 total US oil rigs in the week to October 7.
Prices of the WTI quickly surpassed the key $90.00 mark on Friday and clinched a new October top at $93.25. Beyond the latter turns up the weekly peak at $97.65 (August 30) followed by the key 200-day SMA at $97.88, which precedes the psychological $100.00 level. Inversely, WTI is expected to meet decent contention at the September low at $76.28 (September 26) prior to the 2022 low at $74.30 (January 3). The breakdown of this level could allow for a deeper decline to the weekly low at $66.15 (December 20 2021) ahead of the December 2021 low at $62.46 (December 2).
Resistance levels: $93.25 $97.65 $101.87 (4H chart)
Support levels: $87.03 $86.46 $85.48 (4H chart)
-638009202972241689.png)
DOW JONES
US equities retraced further the weekly advance to multi-session highs on Wednesday and tumbled for the third straight session when tracked by the three major stock indices on Friday.
In fact, the Dow Jones dropped 2.11% to 29,296, the S&P500 retreated 2.80% to 3,639 and the tech-heavy Nasdaq Composite deflated 3.80% to 10,652.
The robust job creation coupled with the lower jobless rate during September propped up the view of a more aggressive Fed in the next months and kind of “confirmed” a 75 bps rate hike at the November 2 event.
Indeed, September’s NFP poured cold water over insofar incipient speculation that the Fed could slow down the pace of its hiking intentions, opening the door to the continuation of the selling bias among market participants.
It is worth noting that the Dow Jones shed more than 4% in the last three sessions.
Friday’s deep pullback in the Dow paves the way for another test of the 2022 low at 28,715 (September 30) seconded by the October 2020 low at 26,143 (October 30). Occasional bullish attempts should meet the initial hurdle at the October peak at 30,454 (October 5) ahead of the weekly high at 31,026 (September 19) and the September top at 32,504 (September 12). The surpass of the latter could put a test of the 200-day SMA at 33,066 back on the investors’ radar ahead of the 33,364 level (August 26). The daily RSI tumbled to the sub-39 region.
Top Performers: Merck&Co, McDonald’s, Caterpillar
Worst Performers: Intel, Walgreen Boots, Microsoft
Resistance levels: 30,454 31,020 31,673 (4H chart)
Support levels: 29,142 28,715 26,143 (4H chart)
-638009203275527356.png)
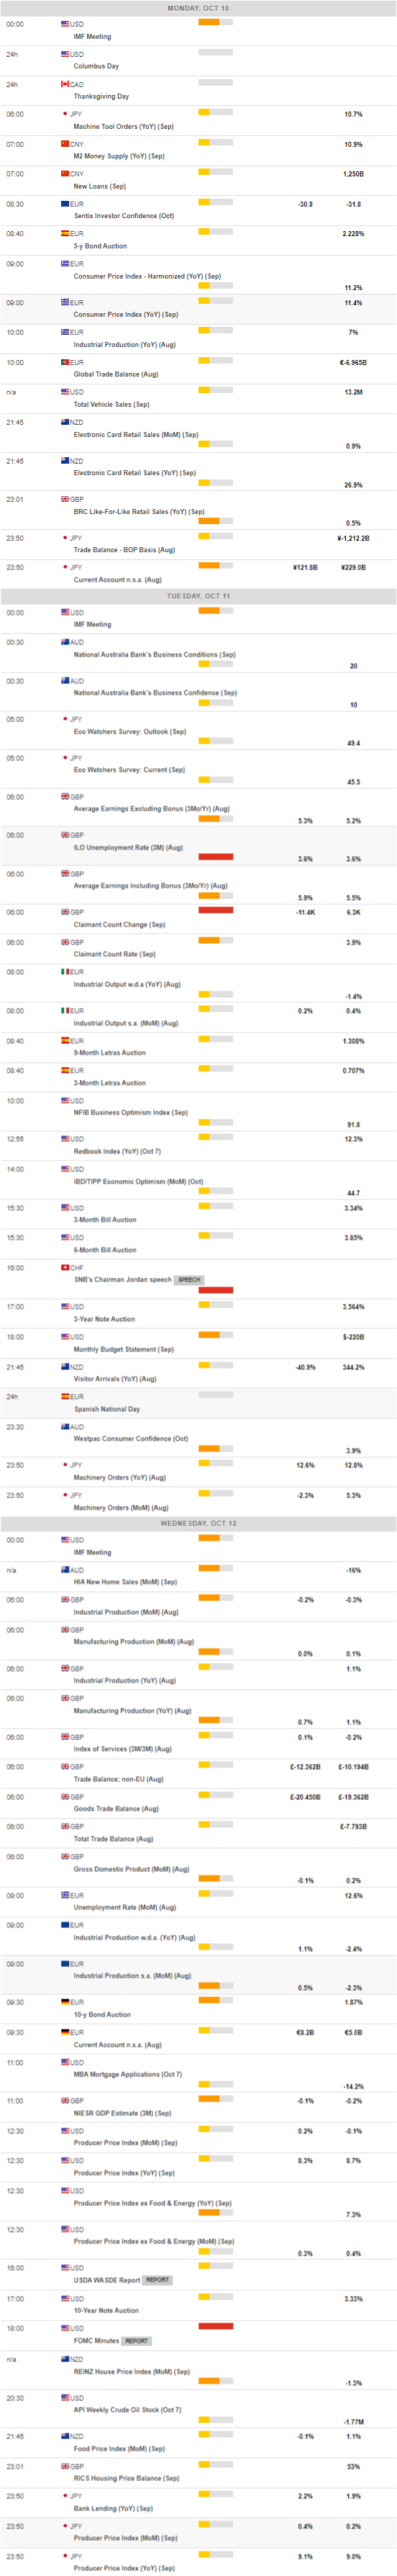
MACROECONOMIC EVENTS
All Information & Updates provided by:

All information relating to the financial markets available on this page has been prepared and issued by FXStreet (Forexstreet SL, Spain, Reg: B62498233) on the basis of publicly available information and all information believed to be reliable and does not conflict with Kuwaiti local laws, and all necessary care has been taken to before the company to ensure that the facts mentioned are correct from the source.
NCM Investment nor any of its directors or employees shall in any way be held responsible for the contents of this news, and the information contained on this page is intended only to provide clients with publicly available information and should not be construed as investment advice, report or analysis and/or constitute an offer or invitation to buy or sell financial instruments of any kind.
RISK WARNING: Forex and CFDs are highly risky leveraged products, as losses can exceed deposits. Please ensure you understand all the risks and take independent advice if necessary. NCM will segregate the clients based on the criteria of the regulator and its bylaws. NCM does not provide any advisory service; the material published does not constitute advice or a recommendation for a transaction in any financial instrument. NCM accepts no responsibility for any use of the content presented and any consequences of that use. Anyone acting on the information provided does so at their own risk.