
- Contact Us:
-

-

-

-


Daily Market Updates
11 Oct 2022
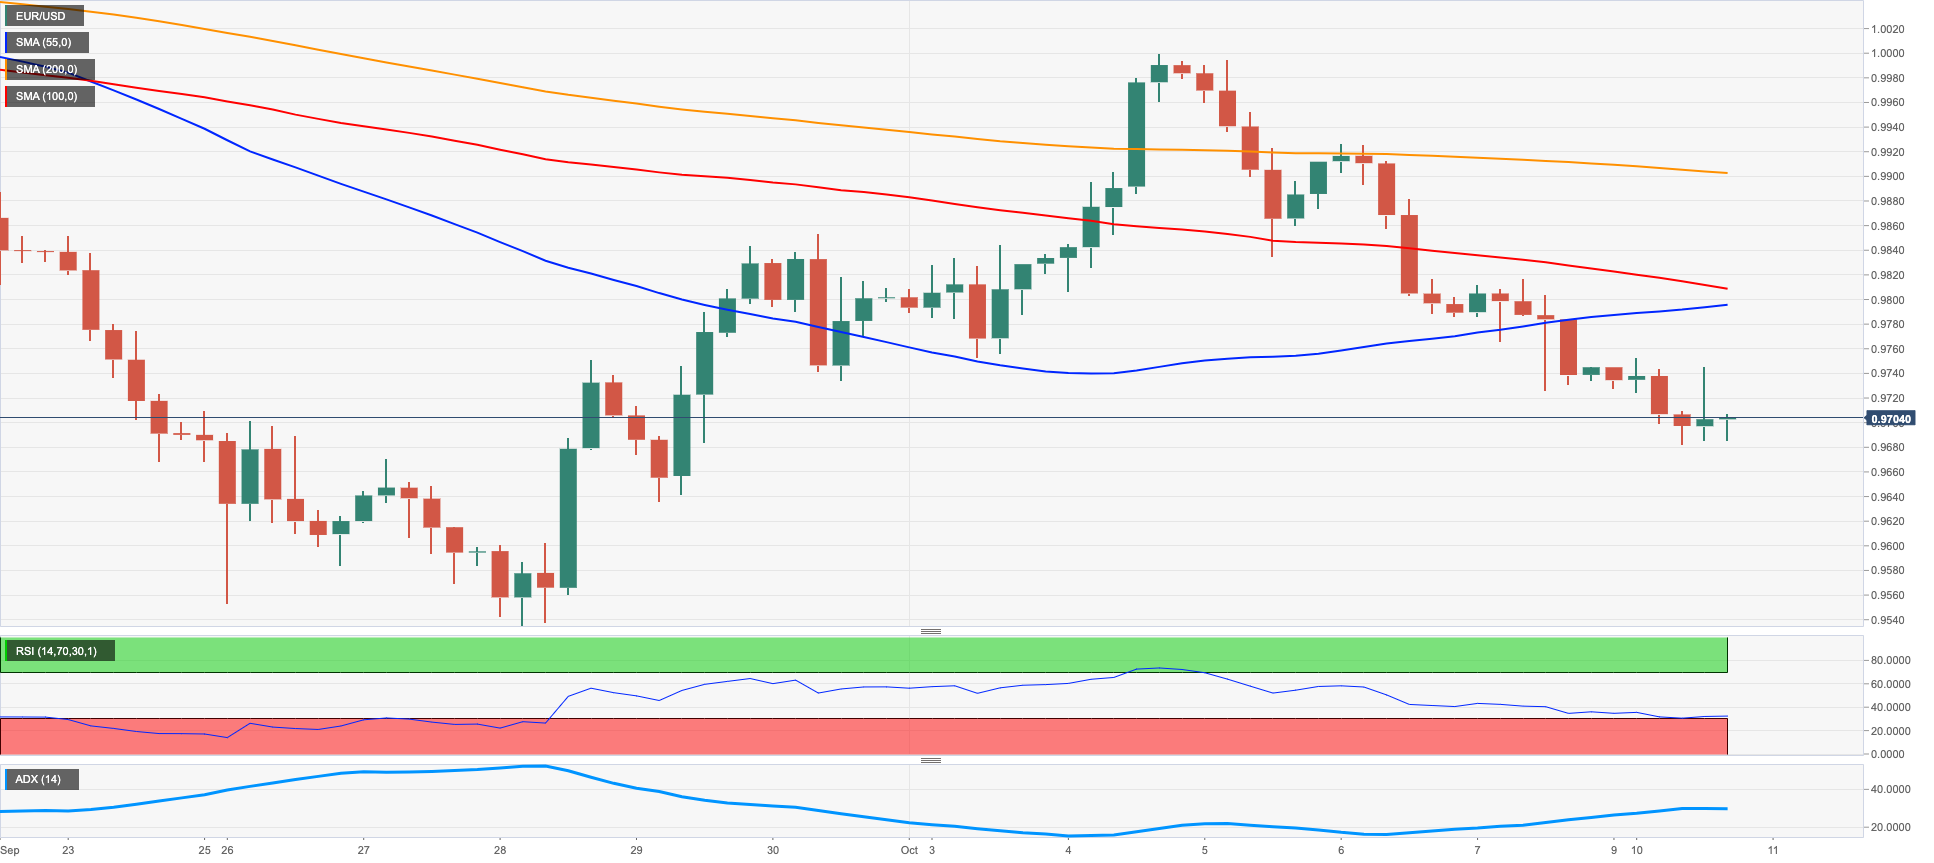
EURUSD
In quite an uneventful session, EUR/USD extended further the ongoing leg lower and revisited the area below the 0.9700 support in a context favourable to the safe haven universe.
Indeed, heightened effervescence in the geopolitical landscape kept the greenback well bid and sponsored further gains in the USD Index (DXY) to new 2-week highs north of 113.00 the figure on Monday, while outflows intensified from the riskier assets.
In addition, the daily pullback in spot contrasted with the continuation of the upside momentum in the German 10-year bund yields, which advanced near the 2.25% level amidst the inactivity in the US money market due to the Columbus Day holiday.
There were no data releases scheduled in both the euro and US calendars on Monday.
Considering the current downside momentum, EUR/USD faces the next contention of note at the 2022 low at 0.9535 (September 28) ahead of the round level at 0.9500 and the weekly low at 0.9411 (June 17 2002). In the opposite direction, the parity zone emerges as a solid hurdle, an area where the October peak at 0.9999 (October 4) and the temporary 55-day SMA coincide. Further up comes the 7-month resistance line near 1.0030. The pair needs to clear this region to mitigate the downside pressure and open the door to a probable challenge of the weekly high at 1.0050 (September 20) ahead of the September top at 1.0197 (September 12) and the 100-day SMA at 1.0199. The daily RSI lost the grip further and revisited the 40 zone.
Resistance levels: 0.9816 0.9904 0.9999 (4H chart)
Support levels: 0.9681 0.9635 0.9535 (4H chart)
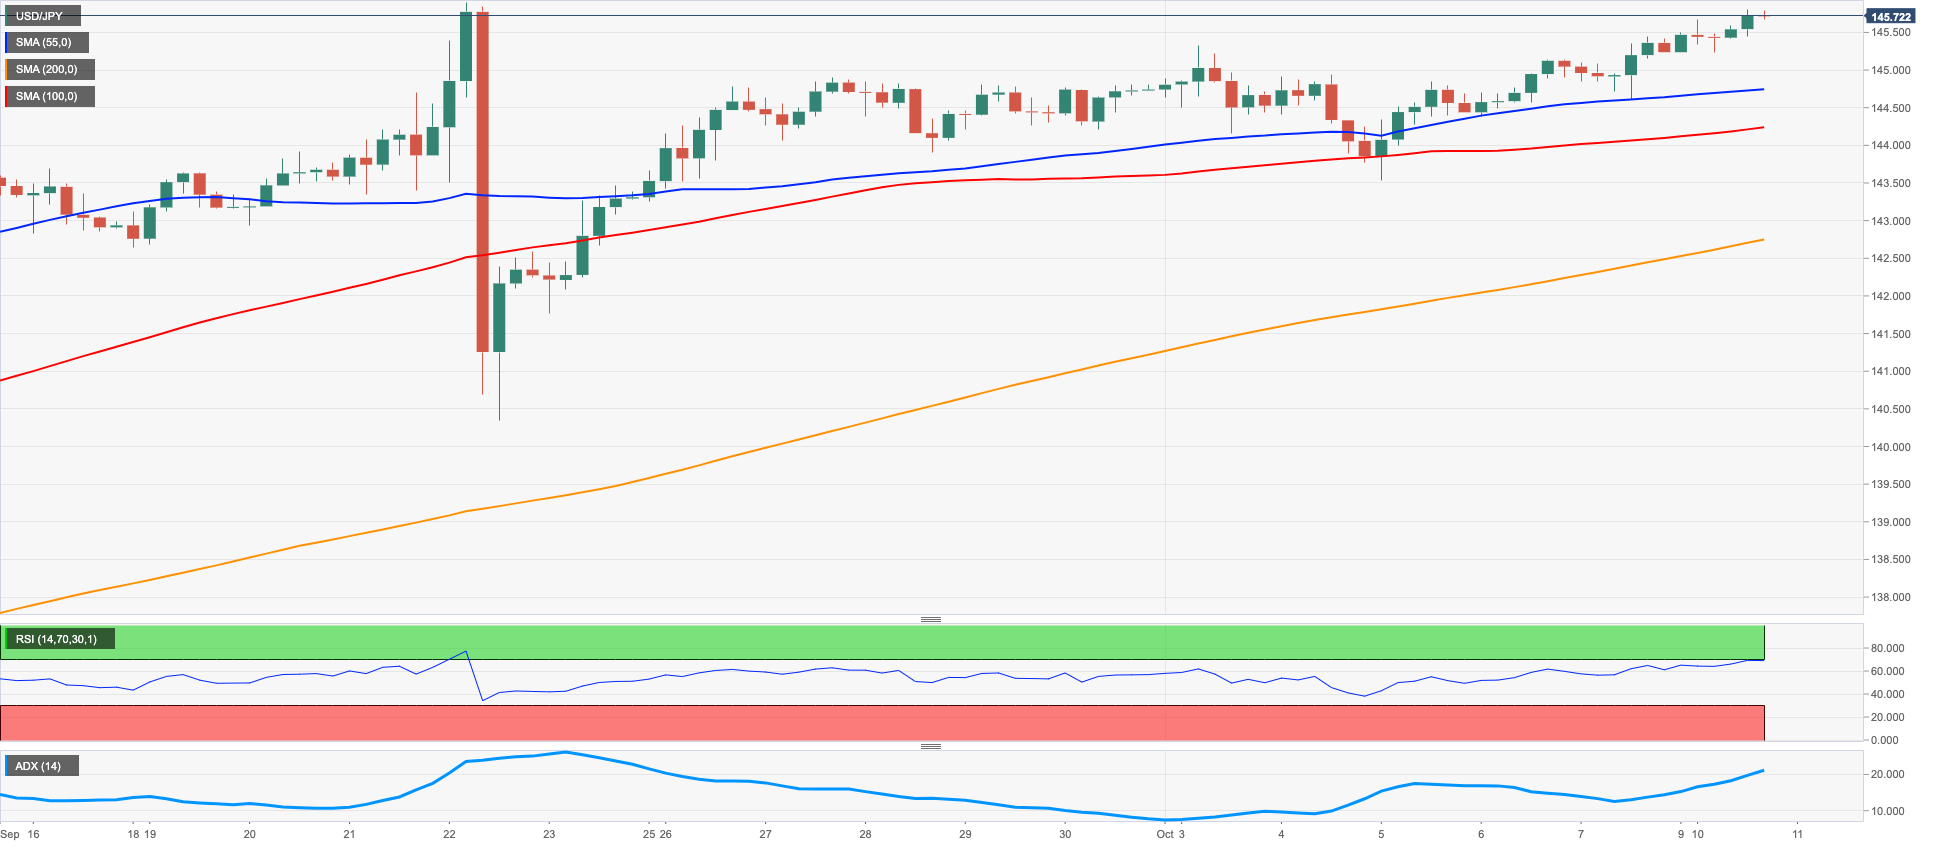
USDJPY
The multi-session rally in the dollar motivated USD/JPY to extend the upside momentum further north of the key 145.00 mark and trade at shouting distance from the 2022 peak at 145.90.
It is worth recalling that a joint move between the BoJ and the MoF triggered the first FX intervention since 1998 back on September 22, when the pair printed fresh YTD tops just below the 146.00 hurdle.
Markets were closed in Japan due to the Health and Sports Day holiday. Next on tap in the domestic calendar will be the Eco Watchers Survey and August’s Current Account results, all due on Tuesday.
No changes to the topside in USD/JPY, which continues to target the 2022 high at 145.90 (September 7) followed by the August 1998 top at 147.67 (August 11 1998) and the August 1990 peak at 151.65. On the other hand, initial support comes at the weekly low at 143.52 (October 5) before the post-intervention low at 140.34 (September 22). The loss of the latter could put the interim 55- and 100-day SMAs at 139.51 and 137.16, respectively, back on the investors’ radar prior to the weekly low at 135.80 (August 23) and another weekly low at 131.73 (August 11). The daily RSI improved slightly and trespassed the 66 yardstick.
Resistance levels: 145.80 145.90 146.97 (4H chart)
Support levels: 144.63 144.38 143.52 (4H chart)
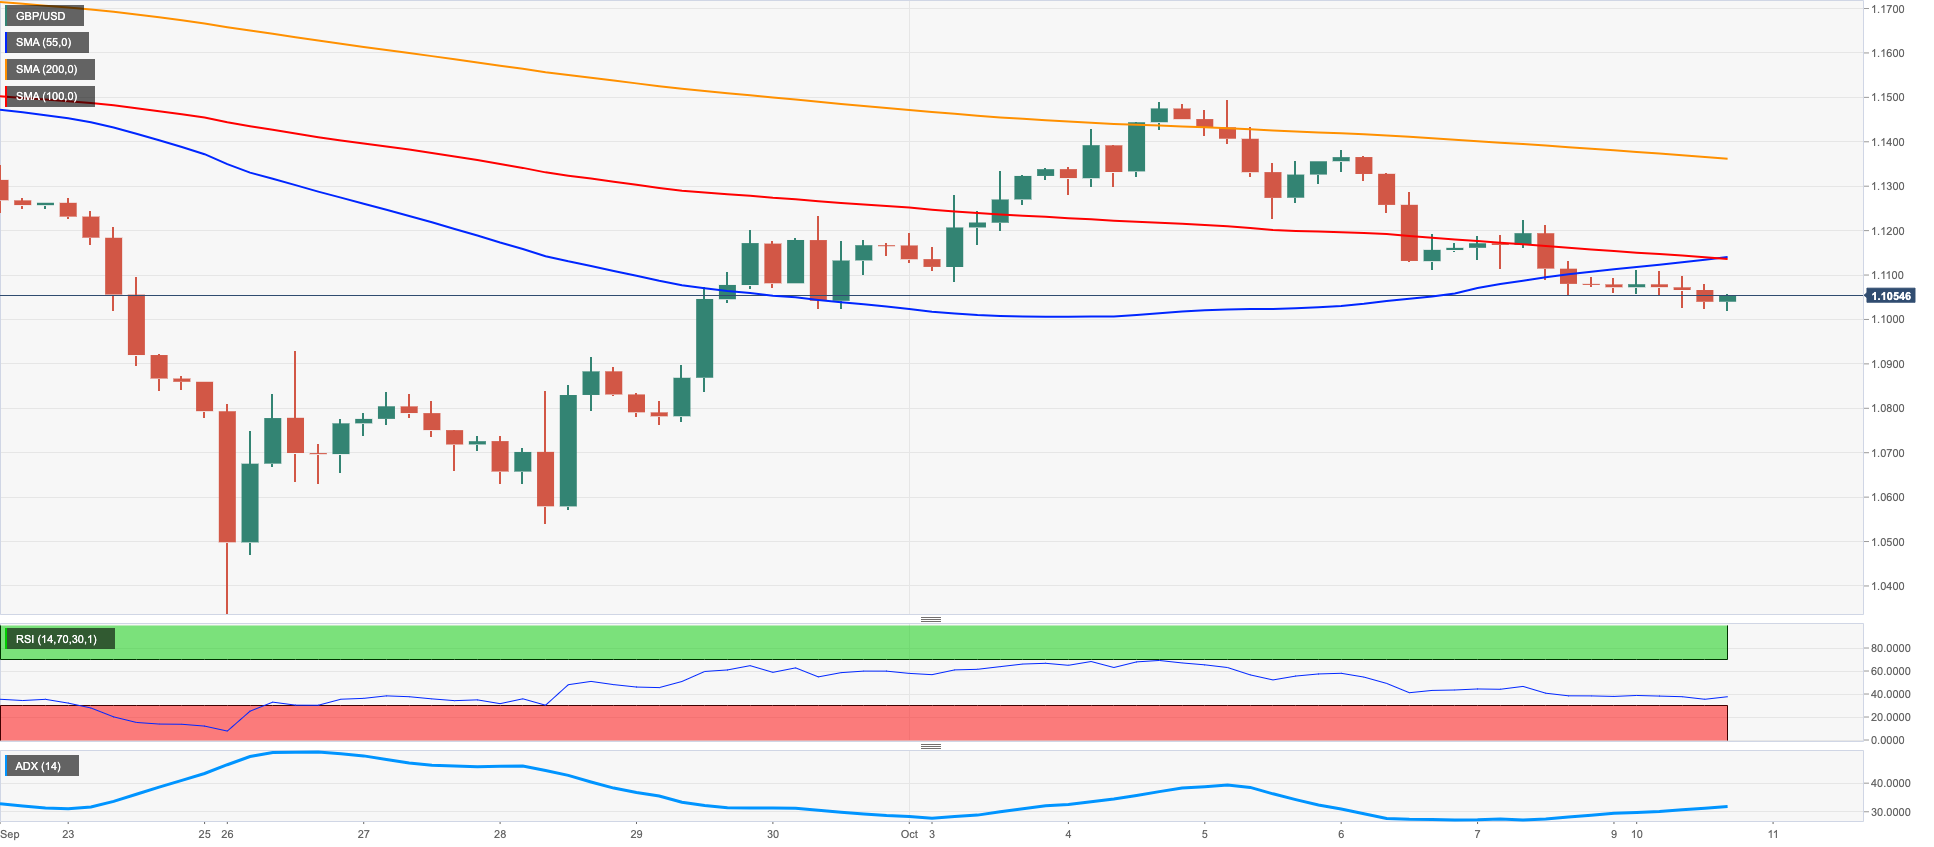
GBPUSD
GBP/USD kept the negative price action for the fourth session in a row and accelerated the losses following the recent breakdown of the 1.1100 level.
The unabated march north in the dollar teamed up with the resumption of the risk aversion and kept the sentiment in the risk-linked galaxy well depressed for yet another session, prompting cable to retreat to new multi-day lows near 1.1020.
The UK docket was empty on Monday, leaving all the attention to the release of the UK labour market report on Tuesday seconded by speeches by BoE’s Cunliffe and Bailey.
Further weakness in GBP/USD could meet minor contention at the 1.0538 level (September 28) ahead of the all-time low at 1.0356 (September 26). On the flip side, the resumption of the upside pressure should target the October peak at 1.1495 (October 5) prior to the 55-day SMA at 1.1642 and the September high at 1.1738 (September 13). North from here emerges the weekly top at 1.1900 (August 26), which appears underpinned by the 100-day SMA at 1.1902 and precedes the psychological 1.2000 yardstick. The daily RSI retreated further and flirted with the 41 area .
Resistance levels: 1.1225 1.1383 1.1397 (4H chart)
Support levels: 1.1019 1.0761 1.0538 (4H chart)
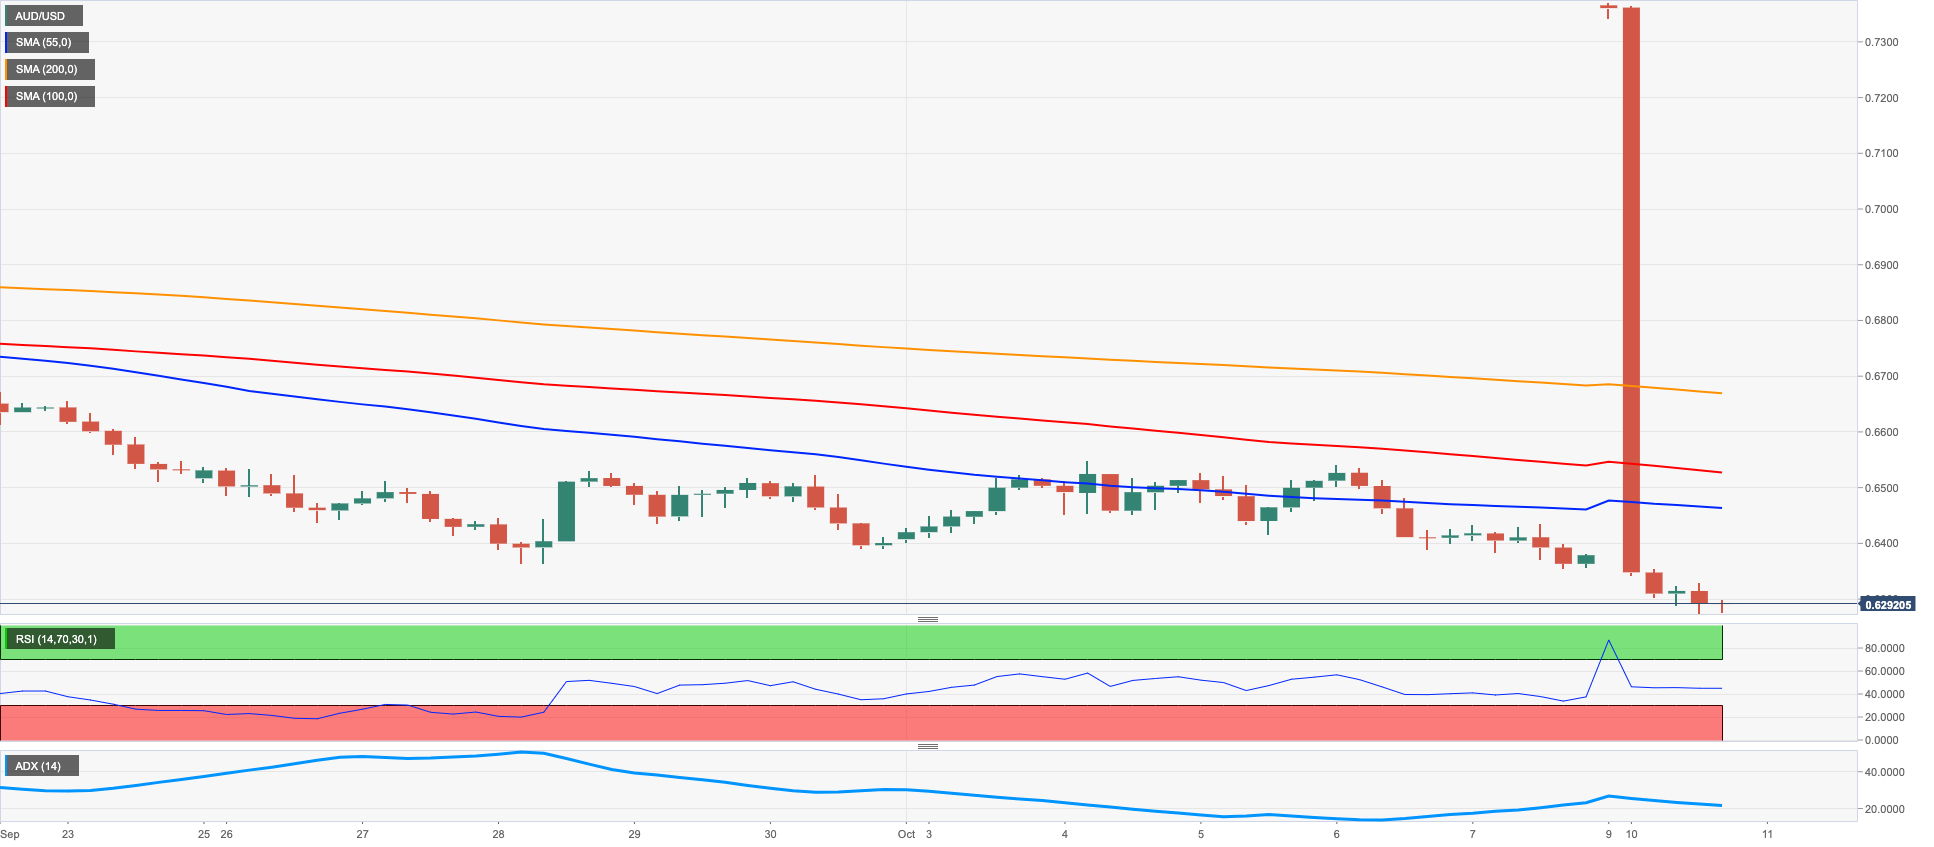
AUDUSD
Another day, another drop in AUD/USD.
This time the pair slipped back to the 0.6275/70 band, an area last seen back in late April 2020, on the back of the relentless upside in the greenback.
In fact, further buying interest in the dollar emerged in response to fresh geopolitical concerns stemming from the war in Ukraine, while investors were also adjusting to the likelihood of a tighter monetary stance from the Fed in light of Friday’s robust Nonfarm Payrolls figures.
The mixed tone in the commodity space did not help the Aussie dollar either, where copper prices regained some poise and iron ore gave away part of Friday’s advance.
The breach of the 2022 low at 0.6274 (October 10) should prompt the weekly low at 0.6253 (April 21 2020) to re-emerge on the horizon before the psychological yardstick at 0.6000 and ahead of the April 2020 low at 0.5980 (April 3). On the contrary, bulls aim to revisit the weekly top at 0.6547 (October 3) followed by another weekly peak at 0.6747 (September 20). Once cleared, the temporary 55- and 100-day SMAs at 0.6785 and 0.6865, respectively, should return to the fore prior to the September high at 0.6916 (September 13) just followed by the psychological 0.7000 mark. The daily RSI entered the oversold territory near 29.
Resistance levels: 0.6380 0.6432 0.6540 (4H chart)
Support levels: 0.6274 0.6253 0.6195 (4H chart)
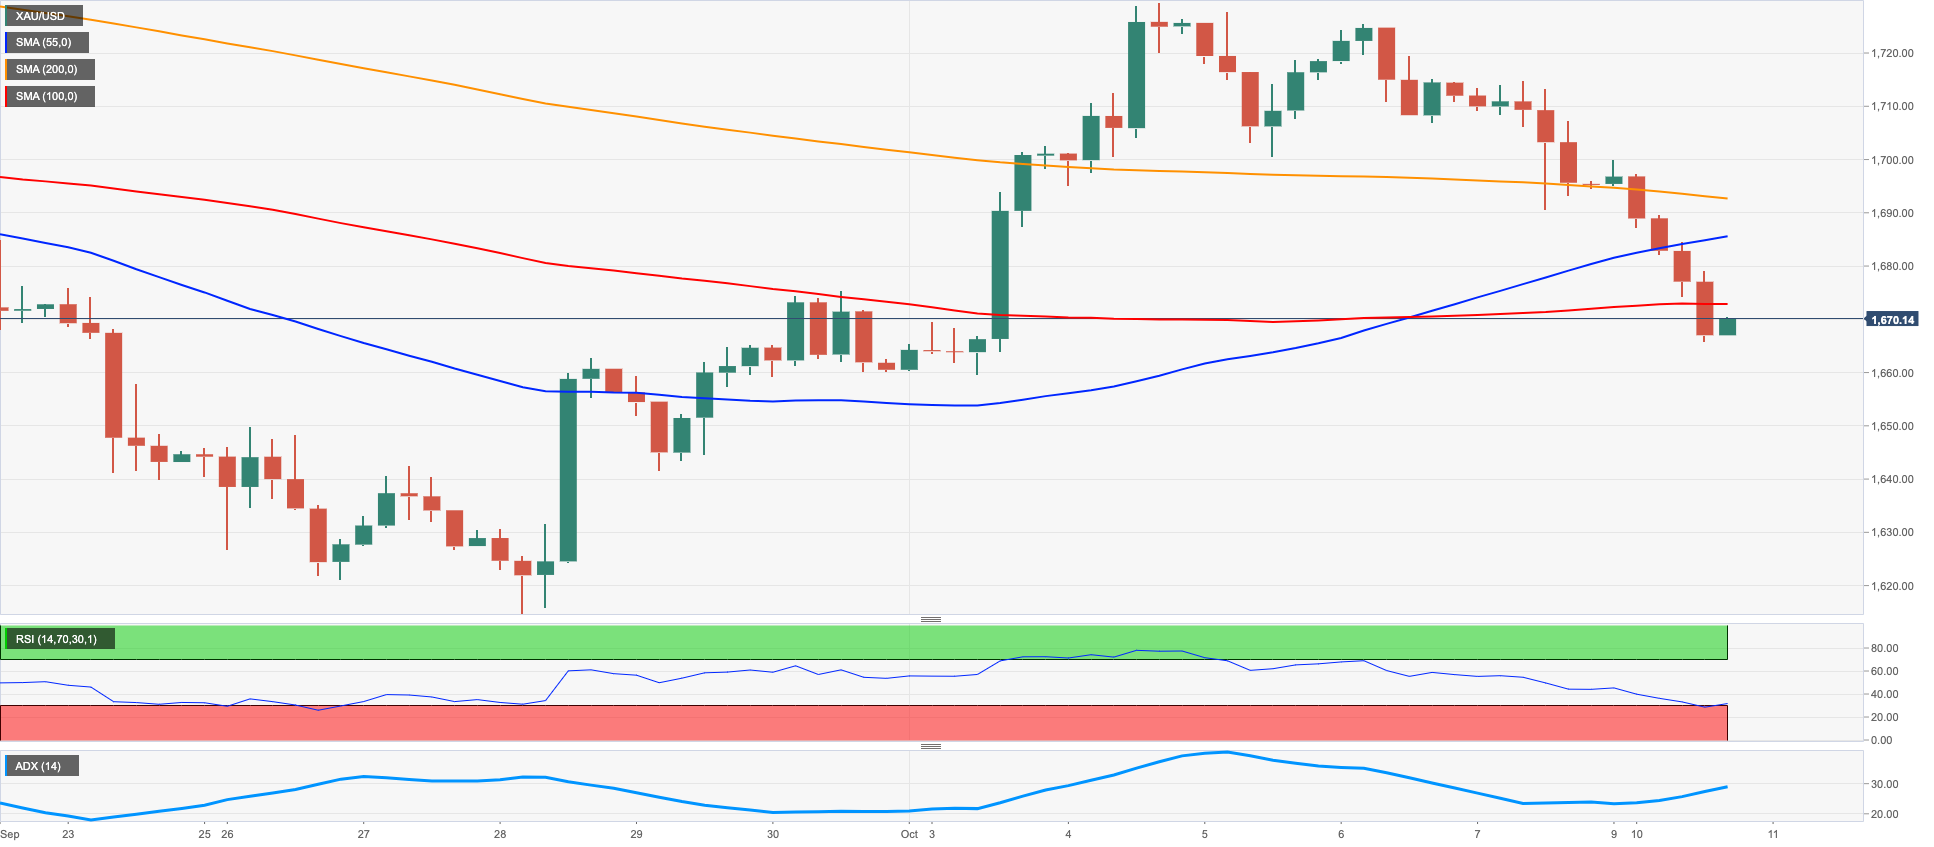
GOLD
The ounce troy of the precious metal clinched the fourth straight session with losses on Monday, extending the breakdown of the $1,700 mark and approaching the $1,660 region.
Further gains in the dollar kept gold bulls at bay despite the pick-up in the geopolitics-led risk aversion among market participants.
Indeed, the yellow metal seems more worried about the prospects of further interest rate hikes by the Federal Reserve. Those fears did nothing but aggravate in the wake of another healthy result from the US job creation during September, as per NFP results published last Friday.
If gold breaks below the 2022 low at $1,614 (September 28) it could then dispute the round level at $1,600 ahead of the April 2020 low at $1,572 (April 1). Occasional bullish attempts, in the meantime, should meet the initial up barrier at the September top at $1,735 (September 12) prior to the 100-day SMA at $1,757 and the $1,765 level (August 25). Extra gains from here could see the critical $1,800 zone revisited before the August peak at $1,807 (August 10).
Resistance levels: $1,694 $1,714 $1,725 (4H chart)
Support levels: $1,665 $1,659 $1,641 (4H chart)
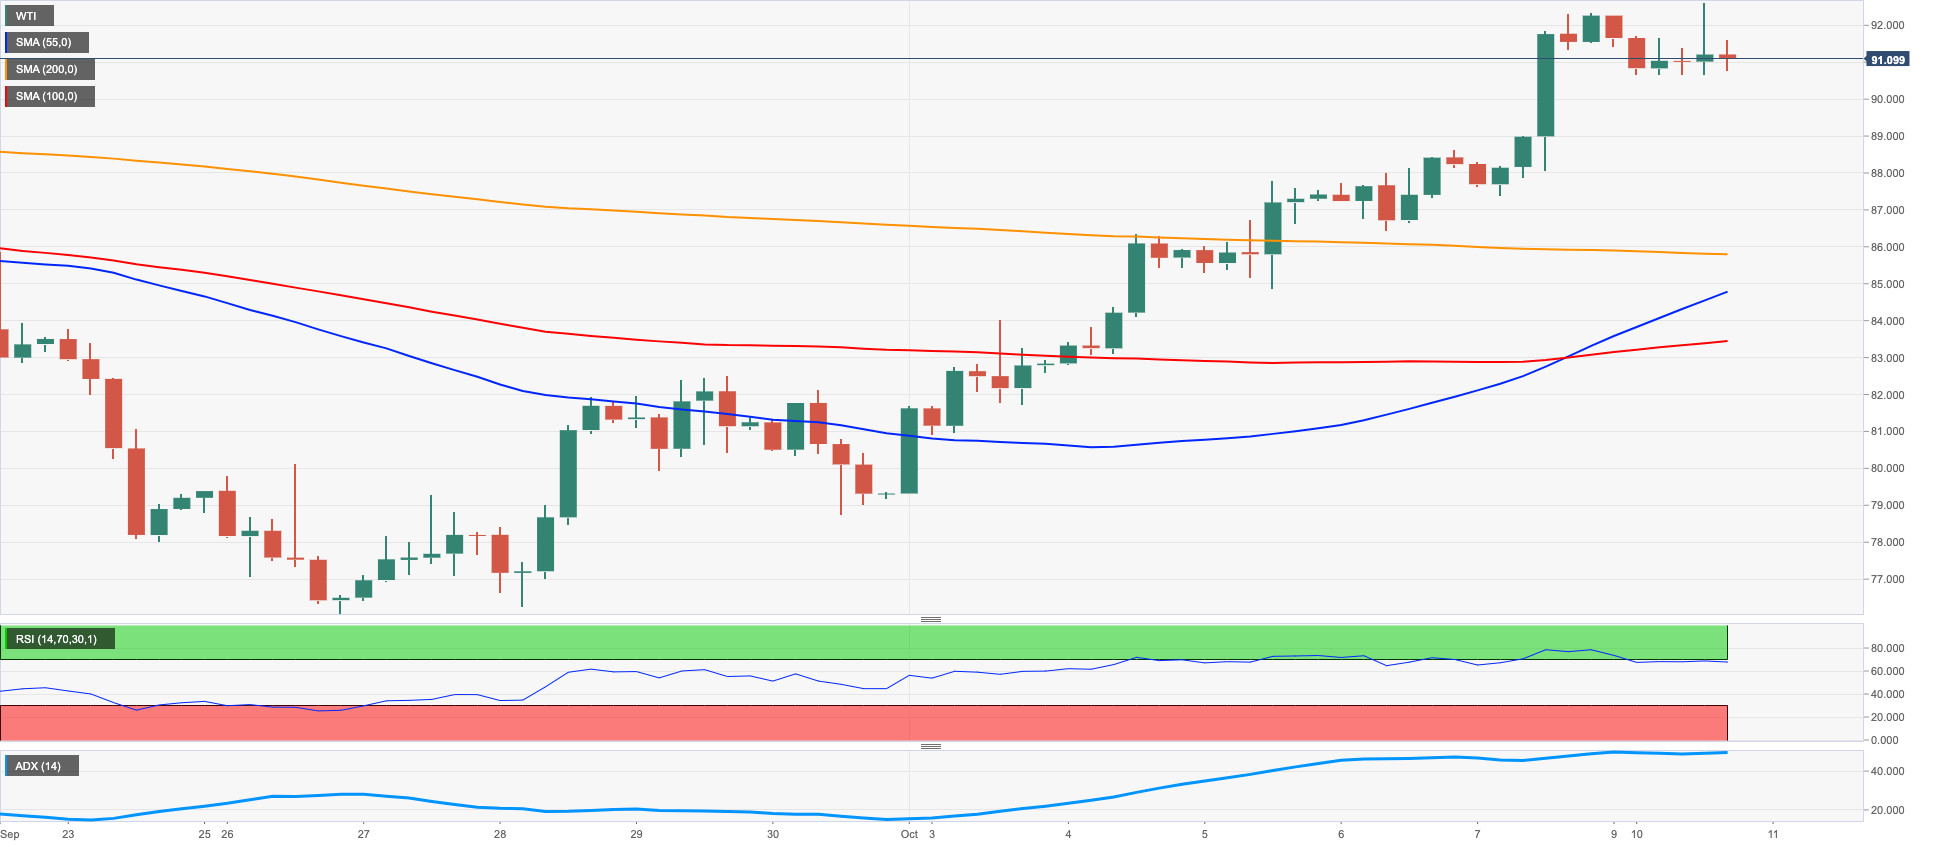
CRUDE WTI
Following five consecutive daily sessions with gains, prices of the barrel of the WTI met some selling pressure above the $93.00 mark and ended up partially surrendering that advance on Monday.
Indeed, recession concerns returned to the fore and somewhat dented the upbeat sentiment among traders, particularly after the OPEC+ decided to cut the oil output by 2 mbpd at the cartel’s meeting in Vienna on October 5.
Later in the week, the API and the EIA will publish their reports on US crude oil supplies in the week to October 7 on Wednesday and Thursday, respectively.
The October peak at $93.62 (October 10) now aligns as the immediate hurdle in case WTI regains the upper hand in the near term. The surpass of the latter could open the door to a visit to the weekly high at $97.65 (August 30) ahead of the key 200-day SMA at $97.96, which is deemed as the latest defense for an assault of the psychological $100.00 mark per barrel. Next on the downside comes the September low at $76.28 (September 26) ahead of the 2022 low at $74.30 (January 3). If the commodity breaches this level, it could prompt a test of the weekly low at $66.15 (December 20 2021) to start shaping up prior to the December 2021 low at $62.46 (December 2).
Resistance levels: $93.62 $97.65 $101.87 (4H chart)
Support levels: $87.03 $86.41 $85.48 (4H chart)
DOW JONES
Equities tracked by the three major US stock indices traded mostly in a bearish tone except for the Dow Jones, which advanced marginally on Monday against the backdrop of rising prudence among investors ahead of the publication of the FOMC Minutes and the release of US inflation figures measured by the CPI on Wednesday and Thursday, respectively.
In the meantime, fresh geopolitical concerns fueled the resumption of the risk aversion, while market participants kept gauging Friday’s Nonfarm Payrolls figures vs. expectations of further tightening by the Federal Reserve.
Against that, the Dow Jones gained 0.05% to 29,310, the S&P500 shed 0.19% to 3,632 and the tech-reference Nasdaq Composite dropped 1.26% to 10,518.
Further losses in the Dow Jones could well see the 2022 low at 28,715 (September 30) revisited prior to the October 2020 low at 26,143 (October 30). In case of the resumption of the bullish mood, the index should face the next up barrier at the October high at 30,454 (October 5) before the weekly top at 31,026 (September 19) and the September peak at 32,504 (September 12). Further up appears the key 200-day SMA at 33,066 before the 33,364 level (August 26). The daily RSI looked somewhat stable around 38.
Top Performers: Walgreen Boots, Merck&Co, Amgen
Worst Performers: Salesforce Inc, Microsoft, Walt Disney
Resistance levels: 30,454 31,020 31,673 (4H chart)
Support levels: 29,010 28,715 26,143 (4H chart)

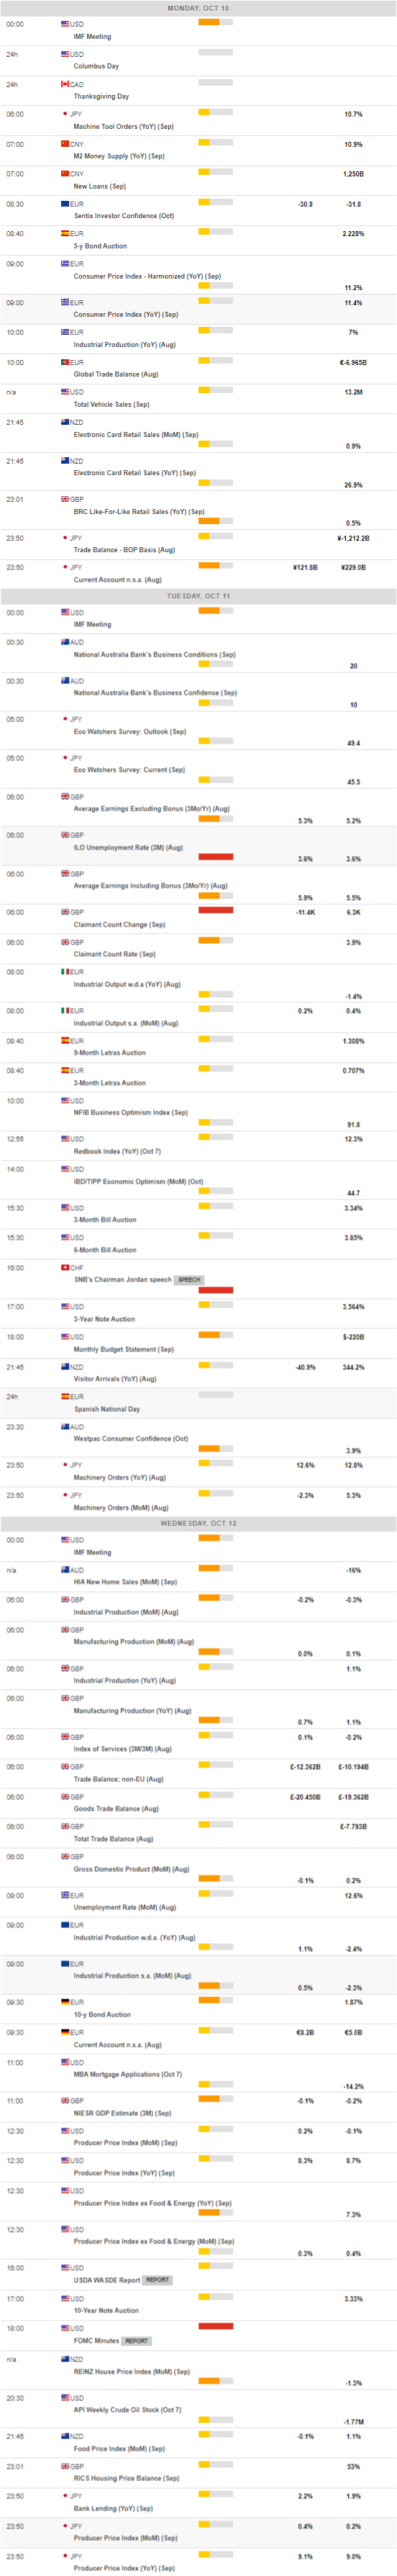
MACROECONOMIC EVENTS
All Information & Updates provided by:

All information relating to the financial markets available on this page has been prepared and issued by FXStreet (Forexstreet SL, Spain, Reg: B62498233) on the basis of publicly available information and all information believed to be reliable and does not conflict with Kuwaiti local laws, and all necessary care has been taken to before the company to ensure that the facts mentioned are correct from the source.
NCM Investment nor any of its directors or employees shall in any way be held responsible for the contents of this news, and the information contained on this page is intended only to provide clients with publicly available information and should not be construed as investment advice, report or analysis and/or constitute an offer or invitation to buy or sell financial instruments of any kind.
RISK WARNING: Forex and CFDs are highly risky leveraged products, as losses can exceed deposits. Please ensure you understand all the risks and take independent advice if necessary. NCM will segregate the clients based on the criteria of the regulator and its bylaws. NCM does not provide any advisory service; the material published does not constitute advice or a recommendation for a transaction in any financial instrument. NCM accepts no responsibility for any use of the content presented and any consequences of that use. Anyone acting on the information provided does so at their own risk.