
- Contact Us:
-

-

-

-


Daily Market Updates
12 Oct 2022
EURUSD
EUR/USD found some respite to the recent weakness and managed to bounce off the 0.9670 region on the back of the solid resurgence of the appetite for the riskier assets.
In fact, the pair reversed four consecutive daily pullbacks, gaining at the same time more than a cent to daily highs past 0.9770 on Tuesday.
The daily recovery in the pair came in response to the marked pullback in the greenback, which prompted the USD Index (DXY) to revisit the mid-112.00s after climbing as high as the area of 2-week peaks around 113.50 during early trading.
As the US debt market returned to normality following Monday’s inactivity, yields traded on the defensive as well as their German peers on the back of rising prudence ahead of the release of the FOMC Minutes on Wednesday and US inflation figures tracked by the CPI on Thursday.
The greenback also derived some weakness after Cleveland Fed L.Mester (voter, hawk) suggested that a potential shock could motivate the US economy to slip back into recession. She added that inflation could drop to 3.5% in 2023 and 2.0% by 2025, while she sees unemployment at 4.5% by the end of 2023 and 5% in 2024. Mester also said she does not anticipate lower rates in 2023.
Data wise in Euroland, Industrial Production in Italy expanded at a monthly 2.3% in August and 2.9% over the last twelve months. In the US, the NFIB Business Optimism Index improved to 92.1 in September (from 91.8) and the IBD/TIPP Economic Optimism worsened to 41.6 for the current month (from 44.7).
EUR/USD clinched a new weekly low at 0.9669 (October 11). If the pair clears this level, it could then attempt a move to the 2022 low at 0.9535 (September 28) prior to the round level at 0.9500 and the weekly low at 0.9411 (June 17 2002). On the flip side, the proximity of the parity region - where the October high at 0.9999 (October 4) and the interim 55-day SMA converge – should offer initial resistance ahead of the 7-month resistance line near 1.0020. If the pair surpasses this zone, then the downside pressure could subside somewhat and allow for a probable visit to the weekly top at 1.0050 (September 20) seconded by the September peak at 1.0197 (September 12) and the August high at 1.0368 (August 10). The daily RSI bounced markedly past the 43 mark.
Resistance levels: 0.9774 0.9816 0.9896 (4H chart)
Support levels: 0.9669 0.9635 0.9535 (4H chart)
-638011081656872485.png)
USDJPY
USD/JPY charted an inconclusive session on Tuesday, quickly fading the initial uptick to the vicinity of 145.90 and succumbing to the selling pressure in the dollar and the corrective decline in US yields.
However, the better tone in the risk complex favoured the selling bias in the Japanese currency and therefore limited the downside momentum in the pair on Tuesday.
In Japan, final figures saw the Eco Watchers Survey Current at 48.4 in September and the Eco Watchers Survey Outlook at 49.2 (from 49.4). Additionally, the Current Account surplus shrank to ¥58.9B in August.
Further gains in USD/JPY are expected to confront the 2022 top at 145.90 (September 7) ahead of the August 1998 peak at 147.67 (August 11 1998) and seconded by the August 1990 high at 151.65. On the contrary, the weekly low at 143.52 (October 5) should offer initial contention prior to the post-intervention low at 140.34 (September 22). A deeper drop could prompt the temporary 55- and 100-day SMAs at 139.67 and 137.35, respectively, to re-emerge on the horizon before the weekly low at 135.80 (August 23) and another weekly low at 131.73 (August 11). The daily RSI looked stable around 66.
Resistance levels: 145.86 145.90 146.97 (4H chart)
Support levels: 145.23 144.63 144.38 (4H chart)
-638011082511201810.png)
GBPUSD
In line with the rest of its risk-associated peers, the sterling reclaimed some ground lost vs. the dollar and managed to lift GBP/USD well above 1.1100 the figure, where it met some initial resistance.
Indeed, cable reversed four consecutive daily pullbacks, shedding around five cents since last week’s tops in the area just shy of the 1.1500 barrier (October 4,5) to Tuesday’s decline around the 1.1000 neighbourhood.
Extra strength for the British pound came after the UK labour market report surprised to the upside earlier in the session. Indeed, the Employment Change shrank by 109K persons (vs. 155K expected) and the Unemployment Rate ticked lower to 3.5% in August. In addition, Average Earnings inc. Bonus rose 6% YoY in the three months ended in August and the Claimant Count Change increased by 25.5K persons in September. Further data saw the BRC Retail Sales Monitor expand 1.8% in the year to September.
If GBP/USD breaches the so far October low at 1.0997 (October 11) it could pave the wave for a drop to the minor support at the 1.0538 level (September 28) prior to the all-time low at 1.0356 (September 26). Meanwhile, bulls are expected to target the October high at 1.1495 (October 5) ahead of the 55-day SMA at 1.1626 and the September top at 1.1738 (September 13). The breakout of the latter could open the door to the temporary 100-day SMA at 1.1888 followed by the weekly peak at 1.1900 (August 26), which is considered as the last stop before the psychological 1.2000 mark. The daily RSI picks up pace and surpasses the 44 level.
Resistance levels: 1.1179 1.1225 1.1356 (4H chart)
Support levels: 1.0997 1.0761 1.0538 (4H chart)
-638011082120209810.png)
AUDUSD
Finally, the Aussie dollar managed to regain some buying interest and reversed five sessions in a row trading with losses on turnaround Tuesday. The pair, in addition, was able to meet bargain hunters soon after hitting the 0.6247 level for the first time since early April 2020.
The renewed selling bias in the dollar underpinned the change of direction in the pair, which was also supported by the mixed bias in the commodity space, where copper prices advanced marginally and the iron ore posted minuscule losses.
In Oz, the Consumer Confidence Index tracked by Westpac eased to 83.7 in October (from 84.4), while final figures saw Building Permits expand 28.1% MoM in August. In addition, NAB’s Business Confidence worsened to 5 in September (from 10).
AUD/USD printed a new 2022 low at 0.6247 (October 11). The breach of this level could pave the way for a probable test of the weekly low at 0.6253 (April 21 2020) ahead of the psychological 0.6000 mark and the April 2020 low at 0.5980 (April 3). In opposition, there is an initial up barrier at the weekly peak at 0.6547 (October 3) ahead of another weekly high at 0.6747 (September 20). Up from here come the interim 55- and 100-day SMAs at 0.6774 and 0.6857, respectively, before the September top at 0.6916 (September 13) and the psychological 0.7000 yardstick. The daily RSI rebounded from the oversold territory and trespassed 31.
Resistance levels: 0.6345 0.6380 0.6432 (4H chart)
Support levels: 0.6247 0.6195 0.6115 (4H chart)
-638011083115855957.png)
GOLD
The yellow metal finally managed to smile and advanced to the $1,680 region per ounce troy on Tuesday, setting aside at the same time four consecutive daily retracements.
The renewed offered bias in the dollar coupled with declining US yields across the curve lent much-needed oxygen to the precious metal and sponsored the bounce off earlier lows in the $1,660 zone.
Indeed, the strong rebound in the greenback appears to have met a tough resistance around 113.50 when tracked by the USD Index (DXY), triggering a corrective decline afterwards and thus bolstering the recovery in the USD-denominated assets and the risk-linked galaxy as well.
The continuation of the downtrend in gold needs to surpass the October low at $1,661 (October 11) to extend the decline to the 2022 low at $1,614 (September 28). The loss of the latter could leave the metal vulnerable to a deeper pullback to the round level at $1,600 prior to the April 2020 low at $1,572 (April 1). In contrast, there is an initial hurdle at the September peak at $1,735 (September 12) ahead of the 100-day SMA at $1,756, which precedes the $1,765 level (August 25). The breakout of the latter could open the door to the critical $1,800 area ahead of the August high at $1,807 (August 10).
Resistance levels: $1,684 $1,692 $1,714 (4H chart)
Support levels: $1,661 $1,641 $1,614 (4H chart)
-638011083488754196.png)
CRUDE WTI
Prices of the West Texas Intermediate (WTI) added to Monday’s retracement and dropped to the vicinity of the $88.00 mark on Tuesday, an area coincident with the 55-day SMA.
The knee-jerk in crude oil prices followed renewed concerns over a probable global slowdown, while the resurgence of COVID cases in China also collaborated with fears surrounding the demand for the commodity.
Further downside, however, appeared contained by the recent announcement by the OPEC+ to cut its oil output (by 2 mbpd) and the omnipresent tight conditions of the market.
In case the correction in WTI prices gathers extra impulse, then the September low at $76.28 (September 26) could return to the traders’ radar prior to the 2022 low at $74.30 (January 3). The loss of the latter exposes the weekly low at $66.15 (December 20 2021) ahead of the December 2021 low at $62.46 (December 2). On the other hand, the October high at $93.62 (October 10) emerges as the initial up barrier seconded by the weekly top at $97.65 (August 30) and the key 200-day SMA at $98.02. The breakout of this region could prompt the psychological $100.00 level per barrel to re-emerge on the horizon.
Resistance levels: $93.62 $97.65 $101.87 (4H chart)
Support levels: $88.35 $87.03 $85.48 (4H chart)
-638011084194672857.png)
DOW JONES
US stocks reversed the initial pessimism and rose to 2-day highs on Tuesday.
In fact, the renewed selling pressure around the dollar coupled with declining US yields across the curve supported further the re-emergence of the risk-on sentiment among traders ahead of the release of the FOMC Minutes and US inflation figures tracked by the CPI on Wednesday and Thursday, respectively.
That said, the Dow Jones advanced 1.12 % to 29,533, the S&P500 gained 0.39% to 3,626 and the tech-heavy Nasdaq Composite rose 0.05% to 10,544.
Dow Jones faces the immediate down barrier at the so far weekly low at 29,010 (October 10). Below this level, a test of the 2022 low at 28,715 (September 30) could start shaping up ahead of the October 2020 low at 26,143 (October 30). Instead, bulls should initially refocus on the October top at 30,454 (October 5). If the index clears the latter, it could then challenge the weekly peak at 31,026 (September 19) before the September high at 32,504 (September 12). North from here turns up the key 200-day SMA at 33,000 prior to the 33,364 level (August 26). The daily RSI gathers some upside traction and surpasses 40.
Top Performers: Amgen, Walgreen Boots, Walmart
Worst Performers: Salesforce Inc, Walt Disney, JPMorgan
Resistance levels: 30,454 31,020 31,597 (4H chart)
Support levels: 29,010 28,715 26,143 (4H chart)
-638011084496902121.png)
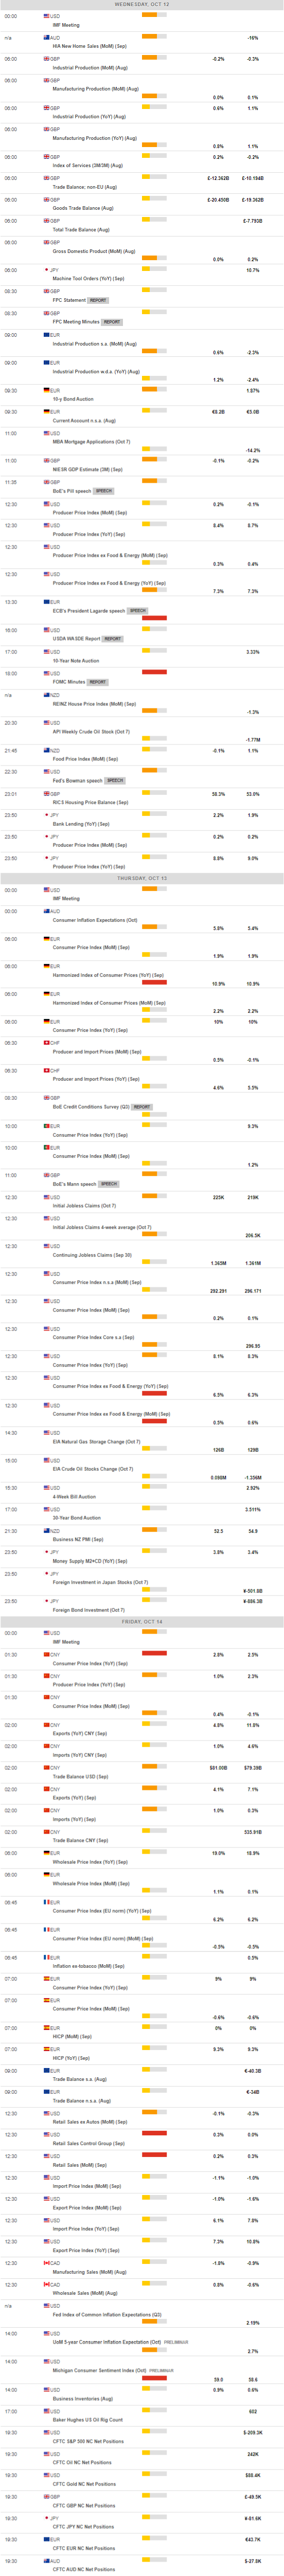
MACROECONOMIC EVENTS
All Information & Updates provided by:

All information relating to the financial markets available on this page has been prepared and issued by FXStreet (Forexstreet SL, Spain, Reg: B62498233) on the basis of publicly available information and all information believed to be reliable and does not conflict with Kuwaiti local laws, and all necessary care has been taken to before the company to ensure that the facts mentioned are correct from the source.
NCM Investment nor any of its directors or employees shall in any way be held responsible for the contents of this news, and the information contained on this page is intended only to provide clients with publicly available information and should not be construed as investment advice, report or analysis and/or constitute an offer or invitation to buy or sell financial instruments of any kind.
RISK WARNING: Forex and CFDs are highly risky leveraged products, as losses can exceed deposits. Please ensure you understand all the risks and take independent advice if necessary. NCM will segregate the clients based on the criteria of the regulator and its bylaws. NCM does not provide any advisory service; the material published does not constitute advice or a recommendation for a transaction in any financial instrument. NCM accepts no responsibility for any use of the content presented and any consequences of that use. Anyone acting on the information provided does so at their own risk.