
- Contact Us:
-

-

-

-


Daily Market Updates
13 Oct 2022
EURUSD
EUR/USD traded with a bullish bias and ended Wednesday’s session above the 0.9700 mark on the back of the renewed weakness around the greenback.
In fact, the selling pressure hurt the USD Index (DXY) in the wake of the release of the FOMC Minutes and motivated it to recede to the 113.00 neighbourhood against the backdrop of the lack of traction (in either direction) in US yields across the curve, while the German 10-year bund yields retreated from the 2.40%, an area last seen in August 2011.
The pair managed to pick up some pace after the FOMC Minutes noted members agreed that it will be appropriate to slow the pace of rate raises at some point to assess the tightening process. In addition, members said that once policy had entered a restrictive territory, it could be convenient to keep it there for some time. A more restrictive policy stance is needed to lower the current elevated inflation. Some participants mentioned the risk of a wage-price spiral.
In the euro docket, Industrial Production in the broader Euroland expanded 2.5% in the year to August and 1.5% vs. the previous month. In Germany, the 10-year bund auction came at 2.33% (from 1.87%).
In the US calendar, MBA Mortgage Applications contracted 2% in the week to October 7 and Producer Prices rose 0.4% MoM in September and 8.5% over the last twelve months, more than initially estimated.
If EUR/USD rebounds further, then there is an interim up barrier at the 55-day SMA at 0.9987 ahead of the October top at 0.9999 (October 4). Further up, and if the pair surpasses the 7-month resistance line near 1.0010, the downside pressure is expected to recede and open the door to a potential test of the weekly peak at 1.0050 (September 20) followed by the September high at 1.0197 (September 12) and the August top at 1.0368 (August 10). On the downside, the weekly low at 0.9669 (October 11) should offer initial contention prior to the 2022 low at 0.9535 (September 28) followed by the round level at 0.9500 and the weekly low at 0.9411 (June 17 2002). The daily RSI gathered some pace and trespassed 41.
Resistance levels: 0.9774 0.9816 0.9890 (4H chart)
Support levels: 0.9667 0.9635 0.9535 (4H chart)
-638011964606415968.png)
USDJPY
The rally in USD/JPY remained unabated on Wednesday.
Indeed, this time the pair came just pips away from the 147.00 mark to print new highs in an area last traded back in mid-August 1998, always on the back of the persevering risk-on mood and small losses in US yields across the curve.
In light of the ongoing price action in spot, Japanese finmin Suzuki reiterated the MoF continues to closely follow FX moves with a sense of urgency, adding that the speed of those moves is what really matters.
Data wise in Japan, the Reuters Tankan Index eased to 5 in October (from 10) and Machinery Orders expanded 9.7% in the year to August.
USD/JPY keeps pushing higher and now targets the round level at 147.00 prior to August 1998 high at 147.67 (August 11 1998) and the August 1990 top at 151.65. Contrarily, there is an immediate contention at the weekly low at 143.52 (October 5) ahead of the post-intervention low at 140.34 (September 22). Further south emerge the 55- and 100-day SMAs at 139.86 and 137.54, respectively, prior to the weekly low at 135.80 (August 23) and another weekly low at 131.73 (August 11). The daily RSI flirted with the overbought territory near 70.
Resistance levels: 146.97 147.41 147.67 (4H chart)
Support levels: 145.42 145.23 144.63 (4H chart)
-638011965684126701.png)
GBPUSD
The British pound was an outperformer on Wednesday and lifted GBP/USD back above the 1.1100 yardstick, always in response to further selling pressure in the greenback.
Indeed, the persistent risk-on sentiment helped the sterling leave behind five consecutive sessions trading in the negative territory, while news that the BoE could end its bond-buying programme at the end of this week showed no impact on the currency. Still around the BoE, MPC member H.Pill said he expected the bank to take significant monetary policy action at its next event.
In the UK docket, the GDP 3-Month Average contracted 0.3% in August and 0.3% MoM in the same month; on a yearly basis the GDP expanded 2.0%. Further releases for the month of August saw the trade deficit widen to £19.257B, the Construction Output expanded 6.1% YoY, Industrial Production contract 5.2% from a year earlier and Manufacturing Production shrank 6.7% vs. August 2021.
In case the bounce in GBP/USD becomes more serious, the October top at 1.1495 (October 5) should turn up as the next target of note prior to the 55-day SMA at 1.1603 and the September peak at 1.1738 (September 13). North from here comes the interim 100-day SMA at 1.1871 ahead of the weekly high at 1.1900 (August 26) and the psychological 1.2000 level. On the flip side, there is initial contention at the October low at 1.0923 (October 12) seconded by the minor support at the 1.0538 level (September 28). The breach of the latter could pave the way for another visit to the all-time low at 1.0356 (September 26). The daily RSI bounces to the proximity of 43.
Resistance levels: 1.1133 1.1179 1.1225 (4H chart)
Support levels: 1.0923 1.0761 1.0538 (4H chart)
-638011965323322414.png)
AUDUSD
The selling pressure gathered further tailwinds around the Aussie dollar and forced AUD/USD to record a fresh low at 0.6235 level on Wednesday. Spot, however, managed to later reverse the decline and end the session with a decent advance.
It is worth noting that the pair only closed with gains in the first session of the current month and is so far down for the fifth consecutive week and the third straight month.
Once again, AUD failed to pick up some buying interest on the back of the prevailing indecision around the greenback, although the mixed performance in the commodity universe also weighed on the currency.
Nothing scheduled in the docket Down Under left the speech by RBA Assistant Governor Ellis as the sole event on Wednesday. At his speech earlier in the Asian trading hours, Ellis suggested that the neutral rate is expected to be at least at 2.5%. He added that inflation expectations remain firmly anchored in the 2%-3% over the next year.
If bears push AUD/USD below the 2022 low at 0.6235 (October 12) then the pair could be on its way to challenge the psychological 0.6000 yardstick ahead of the April 2020 low at 0.5980 (April 3). Just the opposite, there is no resistance level of note until the October high at 0.6547 (October 3) prior to the weekly high at 0.6747 (September 20). If the pair breaks above the latter it could then move to the 55- and 100-day SMAs at 0.6759 and 0.6849, respectively, ahead of the September peak at 0.6916 (September 13), which precedes the psychological 0.7000 mark. The daily RSI sank in the oversold territory at 27.
Resistance levels: 0.6345 0.6380 0.6432 (4H chart)
Support levels: 0.6240 0.6195 0.6115 (4H chart)
-638011966029259867.png)
GOLD
The loss of momentum in the greenback in combination with the equally flat price action in US yields across the curve appear to have lent support to the precious metal on Wednesday.
Indeed, bullion charted decent gains near the $1,680 mark per ounce troy, grabbing some respite following five sessions in a row navigating in the negative territory.
So far, the precious metal looks underpinned by the $1,660 zone and manages well to cling to monthly gains for the first time since March.
The October low at $1,661 (October 11) offers initial support in case bears regain the upper hand around gold. Further south emerges the 2022 low at $1,614 (September 28) ahead of the round level at $1,600 and the April 2020 low at $1,572 (April 1). Inversely, the 55-day SMA at $1,720 comes first before the more relevant September high at $1,735 (September 12). The breakout of this level exposes the 100-day SMA at $1,754 ahead of the $1,765 level (August 25). North from here aligns the critical $1,800 zone prior to the August top at $1,807 (August 10).
Resistance levels: $1,684 $1,689 $1,714 (4H chart)
Support levels: $1,661 $1,641 $1,614 (4H chart)
-638011966334237934.png)
CRUDE WTI
Prices of the WTI dropped for the third session in a row and revisited 5-day lows near the $86.00 mark per barrel on Wednesday.
Persistent concerns over the likelihood of a global slowdown, unabated inflation worries and the stronger dollar all weighed on traders’ sentiment and dragged prices further south from Monday’s OPEC-led peaks past the $93.00 yardstick.
Also collaborating with the downtrend in prices, the OPEC revised lower its demand outlook for the current year. The cartel said the resurgence of COVID cases in China and persistent high inflation were behind the updated forecasts.
Later in the NA session, the API will report on US crude oil supplies in the week to October 7.
If sellers remain in control, prices of the WTI risk a deeper decline to the minor support at $79.16 (September 30) prior to the September low at $76.28 (September 26). Down from here emerges the 2022 low at $74.30 (January 3) ahead of the weekly low at $66.15 (December 20 2021) and the December 2021 low at $62.46 (December 2). Immediately to the upside aligns the October top at $93.62 (October 10) before the weekly peak at $97.65 (August 30) and the key 200-day SMA at $98.07. Beyond the latter, a probable move to the psychological $100.00 mark per barrel could start shaping up.
Resistance levels: $90.05 $93.62 $97.65 (4H chart)
Support levels: $86.30 $85.48 $82.18 (4H chart)
-638011967008558463.png)
DOW JONES
US equities reversed the initial pessimism on the back of persistent recession concerns and rising speculation of a tighter-for-longer stance from the Federal Reserve.
Indeed, higher-than-expected US producer prices sustained fears that the Fed could maintain the current aggressive normalization process for longer, while the solid demand for the greenback also put stocks under further pressure on Wednesday.
However, some optimism returned to the investors after the FOMC Minutes delivered no surprises and members reiterated once again that at some point it might be appropriate to slow the pace of the tightening cycle.
In fact, the Dow Jones rose 0.30% to 29,327, the S&P500 advanced 0.10% to 3,592 and the tech-benchmark Nasdaq Composite gained 0.10% to 10,436.
The weekly low at 29,010 (October 10) should hold the initial test in case the Dow Jones accelerates its decline in the near term. The breach of these levels could pave the way for a potential visit to the 2022 low at 28,715 (September 30) prior to the October 2020 low at 26,143 (October 30). In opposition, there is a Fibo level (of the September drop) at 29,609, which precedes the October peak at 30,454 (October 5). The surpass of this level could put the weekly high at 31,026 (September 19) back on the investors’ radar ahead of the September top at 32,504 (September 12). Further gains could see the key 200-day SMA at 32,964 revisited before the 33,364 level (August 26). The daily RSI appears somewhat stable near 40.
Top Performers: JPMorgan Coca-Cola, Intel
Worst Performers: Boeing, Walgreen Boots, Honeywell
Resistance levels: 29,608 30,454 31,020 (4H chart)
Support levels: 29,010 28,715 26,143 (4H chart)
-638011967305796040.png)
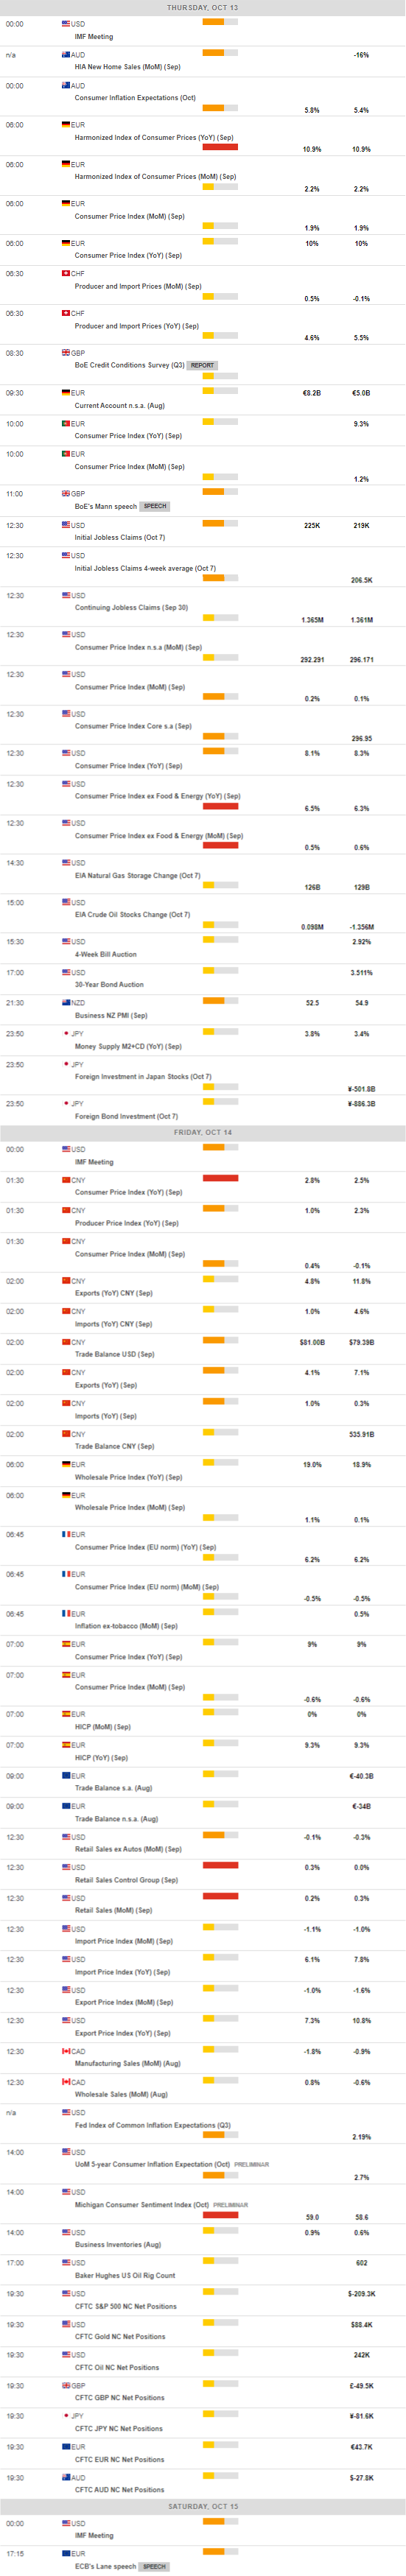
MACROECONOMIC EVENTS
All Information & Updates provided by:

All information relating to the financial markets available on this page has been prepared and issued by FXStreet (Forexstreet SL, Spain, Reg: B62498233) on the basis of publicly available information and all information believed to be reliable and does not conflict with Kuwaiti local laws, and all necessary care has been taken to before the company to ensure that the facts mentioned are correct from the source.
NCM Investment nor any of its directors or employees shall in any way be held responsible for the contents of this news, and the information contained on this page is intended only to provide clients with publicly available information and should not be construed as investment advice, report or analysis and/or constitute an offer or invitation to buy or sell financial instruments of any kind.
RISK WARNING: Forex and CFDs are highly risky leveraged products, as losses can exceed deposits. Please ensure you understand all the risks and take independent advice if necessary. NCM will segregate the clients based on the criteria of the regulator and its bylaws. NCM does not provide any advisory service; the material published does not constitute advice or a recommendation for a transaction in any financial instrument. NCM accepts no responsibility for any use of the content presented and any consequences of that use. Anyone acting on the information provided does so at their own risk.