
- Contact Us:
-

-

-

-


Daily Market Updates
14 Oct 2022
EURUSD
Quite a volatile day for stocks and the FX world.
Indeed, EUR/USD dropped to as low as the 0.9630 region – or new monthly lows – soon after US inflation figures rose above expectations for the month of September.
However, dip-buyers, bargain hunters and opportunistic bulls all stepped in later and sponsored a nearly 2 cents rebound to the boundaries of the 0.9800 yardstick.
Totally the opposite way for the greenback, which saw the USD Index (DXY) flirt with the 114.00 barrier just to tumble to the 112.20/25 band in the next three hours.
As expected, US yields leapt to fresh peaks in the wake of the publication of the US CPI results, retreating somewhat afterwards. The move higher in yields came in tandem with further conviction of a 75 bps rate hike by the Federal Reserve at its November 2 gathering.
-638012849814180504.png)
On the latter, CME Group’s FedWatch Tool sees the probability of such an outcome at nearly 100%, from almost 50% a month ago.
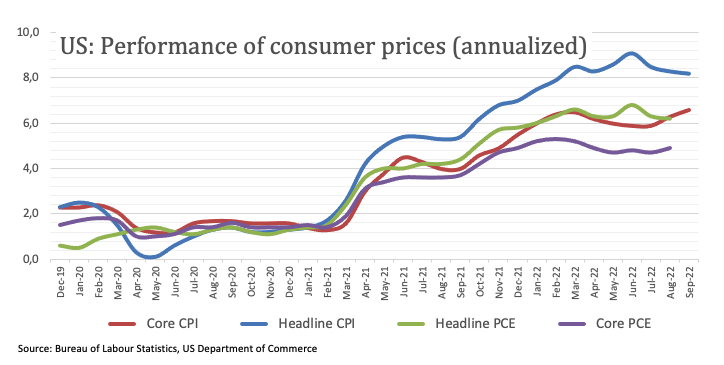
So, back to the calendar, US headline CPI rose 0.4% MoM in September and 8.2% over the last twelve months. The Core CPI gained 0.6% MoM and 6.6% YoY. In addition, Initial Jobless Claims went up by 228K in the week to October 8.
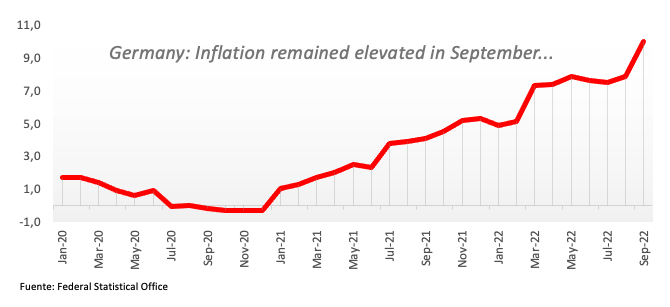
In the euro area, final inflation figures in Germany saw the CPI rise 1.9% during last month and 10.0% on a yearly basis.
The continuation of the recovery in EUR/USD should initially target the temporary 55-day SMA at 0.9979 prior to the more relevant October peak at 0.9999 (October 4). The latter coincides with the 8-month resistance line and, if cleared, it should mitigate the pair’s selling bias and allow for a move to the weekly high at 1.0050 (September 20) seconded by the September top at 1.0197 (September 12) and the August peak at 1.0368 (August 10). On the contrary, the October low at 0.9631 (October 13) is expected to hold the initial test ahead of the 2022 low at 0.9535 (September 28) and the round level at 0.9500. The loss of this level could open the door to the weekly low at 0.9411 (June 17 2002). The daily RSI leapt to the vicinity of 46.
Resistance levels: 0.9798 0.9881 0.9999 (4H chart)
Support levels: 0.9631 0.9535 0.9337 (4H chart)
-638012849477623201.png)
USDJPY
The post-inflation jump in US yields catapulted USD/JPY past the 147.00 barrier and clinched new 24-year highs near 147.70 on Thursday.
Indeed, the short end of the US yield curve climbed to the area near 4.55% for the first time since August 2007, while the belly approached the 4.10% zone, an area last seen back in August 2008.
Spot, however, lost some momentum and gave away part of those gains afterwards, pari passu with the sell-off in the dollar and the slight loss of traction in yields.
In Japan, Bank Lending expanded at an annualized 2.3% in September and Producer Prices rose 0.7% MoM also in September and 9.7% vs. the same month of 2021.
After hitting fresh 24-year highs, USD/JPY now targets the round level at 148 ahead of the August 1990 top at 151.65. In the opposite direction, the weekly low at 143.52 (October 5) emerges as the next contention area prior to the post-intervention low at 140.34 (September 22) and the 55-SMA at 140.10. South from here comes the interim 100-day SMA at 137.75 followed by the weekly low at 135.80 (August 23) and another weekly low at 131.73 (August 11). The daily RSI flirted remained in the overbought territory past 71.
Resistance levels: 147.67 147.95 150.75 (4H chart)
Support levels: 146.44 145.42 145.23 (4H chart)
-638012851426040095.png)
GBPUSD
GBP/USD gained more than three cents – or over 2% - since earlier lows in the proximity of 1.1050 to the 1.1380 region on Thursday.
The deep sell-off in the dollar once market participants digested the higher-than-expected US inflation figures was mainly behind the acute daily uptick in cable, which printed at the same time fresh multi-session tops.
In the UK calendar, the sole event came from the BoE’s Credit Conditions Survey, which showed that lenders see less available credit in the three months to November.
Following Thursday’s price action in GBP/USD, bulls now target the October peak at 1.1495 (October 5) ahead of the 55-day SMA at 1.1588 and the September high at 1.1738 (September 13). The breakout of this region should expose the temporary 100-day SMA at 1.1859 prior to the weekly top at 1.1900 (August 26) and seconded by the psychological 1.2000 mark. On the downside, the October low at 1.0923 (October 12) is expected to offer initial contention before the minor support at the 1.0538 level (September 28) and the all-time low at 1.0356 (September 26). The daily RSI rebounded sharply and flirted with 52.
Resistance levels: 1.1379 1.1495 1.1589 (4H chart)
Support levels: 1.1057 1.0923 1.0761 (4H chart)
-638012851070105371.png)
AUDUSD
The late sell-off in the greenback allowed AUD/USD to clinch the second consecutive daily advance, managing at the same time to reclaim the area beyond 0.6300 the figure.
The renewed downside in the US dollar following the release of higher-than-expected CPI in September underpinned the bounce in the pair and the rest of the risk complex.
The pair, somehow, managed to ignore the generalized bearish performance in the commodity space, where copper prices were an exception and regained the area of weekly highs, while the lack of direction in prices of the iron ore prevailed for yet another session.
Data wise in Oz, Consumer Inflation Expectations held steady at 5.4% in October, in what was the only release in the calendar on Thursday.
Extra upside in AUD/USD could now test the October top at 0.6547 (October 3) ahead of the weekly peak at 0.6747 (September 20), which appears reinforced by the 55-day SMA. The breakout of this level could open the door to the 100-day SMA at 0.6841 before the September high at 0.6916 (September 13) and the psychological 0.7000 mark. On the downside, the next support of note comes at the 2022 low at 0.6169 (October 13) ahead of the psychological 0.6000 level. The loss of the latter could lead up to a potential test of the April 2020 low at 0.5980 (April 3). The daily RSI improved a tad to the 33 region.
Resistance levels: 0.6316 0.6345 0.6380 (4H chart)
Support levels: 0.6169 0.6115 0.5980 (4H chart)
-638012851740074229.png)
GOLD
Quite volatile session for the precious metal. In fact, after bottoming out in new monthly lows near $1,640, bullion attempted a rebound to the $1,680/85 band, although it returned to the negative territory eventually.
Despite the strong drop in the greenback, the yellow metal succumbed to the sharp uptick in US yields across the curve, which garnered rapid traction following higher-than-expected US inflation figures during September.
Indeed, the latter added to the already strong conviction among market participants that extra jumbo interest rate hikes by the Fed remain well in store for the time being.
If sellers remain in control of the price action in gold, the next contention aligns at the October low at $1,642 (October 13) ahead of the 2022 low at $1,614 (September 28) and the round level at $1,600. A move below the latter leaves bullion vulnerable to a drop to the April 2020 low at $1,572 (April 1). Contrarily, the immediate hurdle comes at the 55-day SMA at $1,719 just ahead of the September top at $1,735 (September 12). Once cleared, the 100-day SMA at $1,752 should come to the fore prior to the $1,765 level (August 25) and the critical $1,800 region, which precedes the August peak at $1,807 (August 10).
Resistance levels: $1,684 $1,714 $1,729 (4H chart)
Support levels: $1,642 $1,614 $1,572 (4H chart)
-638012852227342096.png)
CRUDE WTI
Prices of the barrel of the WTI reversed three consecutive daily pullbacks and managed to regain some upside traction and flirt with the key $90.00 mark on Thursday.
The sharp sell-off in the dollar sustained the daily change of direction in the commodity, which was further reinforced by the marked drop in distillates inventories, as per the EIA’s weekly report. Still with the EIA, crude oil stockpiles rose by 9.880M barrels in the week to October 7, while supplies at Cushing shrank by 0.309M barrels and gasoline stockpiles increased by 2.023M barrels.
In case the bounce in the WTI gets more serious, the next up barrier is expected at the October peak at $93.62 (October 10) seconded by the weekly high at $97.65 (August 30) and the key 200-day SMA at $98.13. The surpass of this level could motivate crude oil to challenge the psychological $100.00 mark. Inversely, immediate support aligns at the weekly low at $85.58 (October 13) ahead of the minor support at $79.16 (September 30) and the September low at $76.28 (September 26). If breached, then a test of the 2022 low at $74.30 (January 3) could start emerging on the horizon prior to the weekly low at $66.15 (December 20 2021) and the December 2021 low at $62.46 (December 2).
Resistance levels: $89.64 $93.62 $97.65 (4H chart)
Support levels: $85.54 $84.58 $82.18 (4H chart)
-638012852879897762.png)
DOW JONES
US equities rose sharply and reversed the earlier post-inflation drop following the U-turn in the investors’ sentiment.
Indeed, market participants looked past the likelihood of the tighter-for-longer stance from the Fed – exacerbated after US CPI rose more than expected in September – and encouraged the major indices to strongly rebound on Thursday soon after recording new 2022 lows.
That said, the Dow Jones gained 2.46%% to 29,937, the S&P500 rose 2.10% to 3,651 and the tech-heavy Nasdaq Composite advanced 1.96% to 10,621.
Next on the upside for the Dow Jones appears the October high at 30,454 (October 5) prior to the weekly top at 31,026 (September 19) and the September peak at 32,504 (September 12). Extra upside could prompt the key 200-day SMA at 32,932 to return to the traders’ radar ahead of the 33,364 level (August 26). The resumption of the selling bias should meet the initial support at the 2022 low at 28,660 (October 13) seconded by the October 2020 low at 26,143 (October 30). The daily RSI rose past the 47 level.
Top Performers: Walgreen Boots, Dow, JPMorgan
Worst Performers: Walmart, Nike, Home Depot
Resistance levels: 30,080 30,454 31,020 (4H chart)
Support levels: 28,660 26,143 25,992 (4H chart)
-638012853422317164.png)
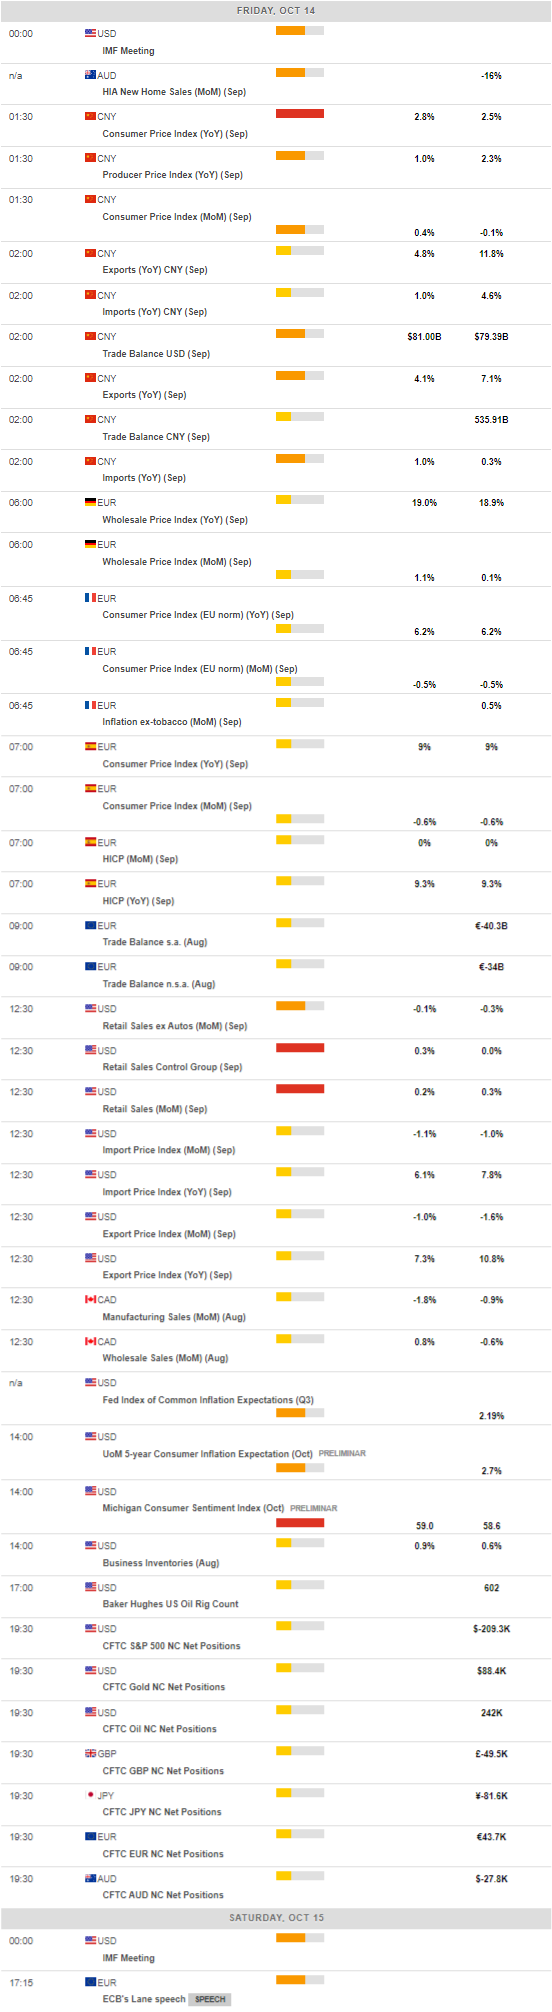
MACROECONOMIC EVENTS
All Information & Updates provided by:

All information relating to the financial markets available on this page has been prepared and issued by FXStreet (Forexstreet SL, Spain, Reg: B62498233) on the basis of publicly available information and all information believed to be reliable and does not conflict with Kuwaiti local laws, and all necessary care has been taken to before the company to ensure that the facts mentioned are correct from the source.
NCM Investment nor any of its directors or employees shall in any way be held responsible for the contents of this news, and the information contained on this page is intended only to provide clients with publicly available information and should not be construed as investment advice, report or analysis and/or constitute an offer or invitation to buy or sell financial instruments of any kind.
RISK WARNING: Forex and CFDs are highly risky leveraged products, as losses can exceed deposits. Please ensure you understand all the risks and take independent advice if necessary. NCM will segregate the clients based on the criteria of the regulator and its bylaws. NCM does not provide any advisory service; the material published does not constitute advice or a recommendation for a transaction in any financial instrument. NCM accepts no responsibility for any use of the content presented and any consequences of that use. Anyone acting on the information provided does so at their own risk.