
- Contact Us:
-

-

-

-


Daily Market Updates
17 Oct 2022
EURUSD
EUR/USD corrected sharply lower after hitting fresh weekly tops just beyond 0.9800 the figure at the end of the week, putting the 0.9700 neighbourhood to the test amidst the intense recovery in the dollar.
Indeed, the greenback recouped losses from Thursday’s post-CPI sell-off and motivated the USD Index (DXY) to regain the 113.00 barrier and above accompanied by another positive day in US yields across the curve.
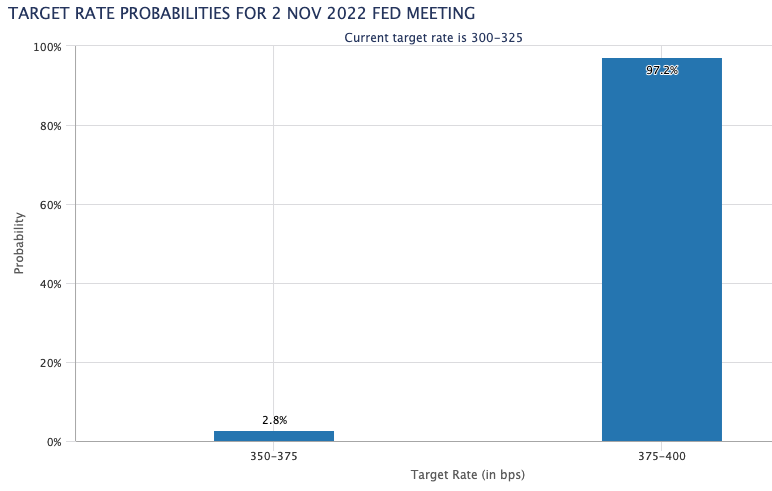
In the meantime, expectations of a 75 bps at the next FOMC event remained well and sound and with the possibility at nearly 98% according to CME Group’s FedWatch Tool.
Speaking about interest rates, St, Louis Fed J.Bullard (voter, hawk) said he sees PCE inflation in the sub-3.0% area by the end of 2023 and suggested the appropriate range for the Fed Funds at 4.50%-4.75% by year end.
From the ECB, Board member O.Rehn said that quantitative tightening (QT) will begin once the neutral rate is reached
In the docket, the EMU’s trade deficit widened to €50.9B in August, while final inflation figures in France saw the CPI drop 0.6% MoM in September and gain 5.6% over the last twelve months.
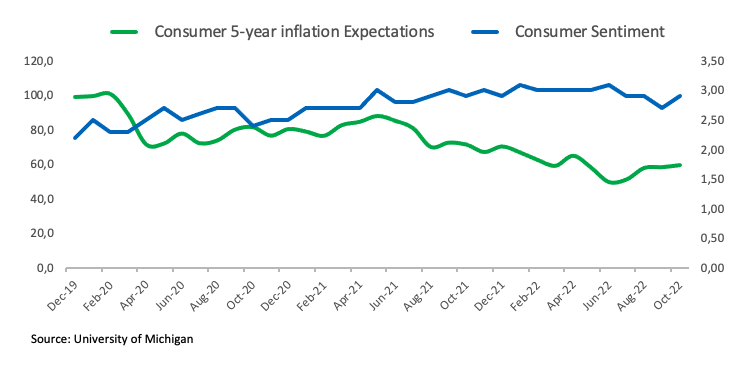
In the US, Retail Sales came in flat on a monthly basis in September and expanded 0.1% when excluding the Autos sector. In addition, preliminary readings saw the Consumer Sentiment improve to 59.8 for the current month and the 5-Year Inflation Expectations climb to 2.9% (from 2.7%). Finally, Business Inventories expanded at a monthly 0.8% in August, a tad below estimates.
If the selling pressure picks up pace, then EUR/USD could challenge the October low at 0.9631 (October 13) prior to the 2022 low at 0.9535 (September 28). The loss of this level exposes the round level at 0.9500 ahead of the weekly low at 0.9411 (June 17 2002). On the other hand, the 55-day SMA at 0.9970 should offer initial resistance seconded by the October high at 0.9999 (October 4), which appears underpinned by the 8-month resistance line. If the pair leaves this area behind, it could then attempt a test of the weekly top at 1.0050 (September 20) prior to the 100-day SMA at 1.0160 and the September peak at 1.0197 (September 12). The daily RSI grinded lower and approached 42.
Resistance levels: 0.9808 0.9875 0.9999 (4H chart)
Support levels: 0.9706 0.9631 0.9535 (4H chart)
-638014706407621144.png)
USDJPY
USD/JPY climbed further and reached levels last seen in August 1990 north of the 148.00 hurdle on Friday.
The relentless march north in the pair – and the equally unabated depreciation of the Japanese yen – came on the back of the re-emergence of the upside momentum in the dollar and the persevering upside in US yields across the curve. On the latter, yields in the short end of the curve revisited the area past 4.50%, levels last traded back in August 2007.
Following the recent price action in the pair, Japanese finmin Suzuki once again reiterated the concerns surrounding the high volatility in the FX markets.
From the BoJ, Governor Kuroda suggested inflation could be below the 2% level in 2023.
In Japan, Foreign Bond Investment shrank to ¥1713.7B in the week to October 8.
USD/JPY climbed to as high as the 148.85 level on October 14. Further north from here, there are no resistance levels of note until the August 1990 top at 151.65. On the contrary, the October low at 143.52 (October 5) offers initial support ahead of the post-intervention low at 140.34 (September 22), which appears reinforced by the 55-SMA. The loss of the latter opens the door to the 100-day SMA at 137.96 before the weekly low at 135.80 (August 23) and another weekly low at 131.73 (August 11). The daily RSI entered further in the overbought territory north of 76.
Resistance levels: 148.85 150.75 151.25 (4H chart)
Support levels: 146.42 145.42 145.23 (4H chart)
-638014707626974409.png)
GBPUSD
Friday was no exception to the heightened volatility that prevailed around the British pound this past week.
Indeed, GBP/USD reversed two daily builds in a row and shed more than 1% on Friday on the back of the resumption of the solid demand for the greenback. Cable retreated from weekly tops in levels just shy of 1.1400 the figure on Thursday, to the mid-1.1100s in its worst moment on Friday.
The sterling derived further weakness from the speech by UK PM L.Truss, who anticipated the return of the increase of the corporation tax. Truss also ruled out further U-turns on the UK tax package and said (new) Chancellor Hunt will announce a medium-term fiscal plan by the end of the month.
There were no data releases scheduled in the UK calendar at the end of the week. Next of importance will be the release of the September inflation figures on October 19.
There is an initial hurdle at the weekly peak at 1.1380 (October 13) ahead of the October high at 1.1495 (October 5). Once GBP/USD clears this level, it could challenge the 55-day SMA at 1.1570 before the September top at 1.1738 (September 13). Further north comes the interim 100-day SMA at 1.1844 ahead of the weekly peak at 1.1900 (August 26) and the psychological 1.2000 mark. On the flip side, initial contention arises at the October low at 1.0923 (October 12) prior to the minor support at the 1.0538 level (September 28) and followed by the all-time low at 1.0356 (September 26). The daily RSI ticked lower and flirted with 47.
Resistance levels: 1.1299 1.1380 1.1495 (4H chart)
Support levels: 1.1151 1.1057 1.0923 (4H chart)
-638014707290090135.png)
AUDUSD
AUD/USD tumbled markedly and set aside two consecutive daily pullbacks on Friday, trading at shouting distance from recent 2022 levels in the sub-0.6200 region.
The move higher in the dollar coupled with the upside bias in US yields and persistent hawkish messages from Fed’s rate-setters weighed on the Aussie dollar as well as the rest of the risk-linked galaxy.
Indeed, on the latter, copper prices and the tonne of iron ore grinded lower, reflecting the broad-based weakness in the commodity universe.
The docket in Oz was empty on Friday, leaving the RBA Minutes as the next relevant release on October 18.
Further selling pressure should put the AUD/USD en route to confront the 2022 low at 0.6169 (October 13) prior to the psychological 0.6000 level and the April 2020 low at 0.5980 (April 3). In the opposite direction, the October peak at 0.6547 (October 3) comes first before the weekly high at 0.6747 (September 20). Beyond this region appears the 100-day SMA at 0.6831, which precedes the 6-month resistance line around 0.6870. The surpass of this zone exposes the September top at 0.6916 (September 13) prior to the psychological 0.7000 level. The daily RSI immersed further into the oversold territory below 27.
Resistance levels: 0.6346 0.6432 0.6540 (4H chart)
Support levels: 0.6169 0.6115 0.5980 (4H chart)
-638014707985266054.png)
GOLD
Once again, renewed dollar strength in combination with extra recovery in US yields across the curve morphed into another negative session for the precious metals, with prices of the ounce troy dropping to new monthly lows around $1,640.
Indeed, latest results from US fundamentals continued to show a marked resilience of the economy, which does nothing but underpin the case for the tighter-for-longer stance from the Federal Reserve in the upcoming months.
The latest plethora of hawkish comments from Fed’s rate-setters supported the current status quo from the central bank. Against this, the Fed Funds Target Range could climb to the 4.75%-5.00% by year end in the most hawkish of the views.
Once the October low at $1,640 (October 14) is cleared, gold could then dispute the 2022 low at $1,614 (September 28) prior to the round level at $1,600 and the April 2020 low at $1,572 (April 1). Inversely, occasional bullish attempts could see the 55-day SMA at $1,716 revisited before the September peak at $1,735 (September 12) and the 100-day SMA at $1,750. The surpass of this region should leave the yellow metal vulnerable to a test of the $1,765 level (August 25) ahead of the critical $1,800 region and the August high at $1,807 (August 10).
Resistance levels: $1,684 $1,714 $1,729 (4H chart)
Support levels: $1,640 $1,614 $1,572 (4H chart)
-638014708332226835.png)
CRUDE WTI
Prices of the American reference for the sweet light crude oil deepened the weekly leg lower and visited the vicinity of the $85.00 mark per barrel on Friday, unwinding further the OPEC-led bounce to levels past the $93.00 recorded on October 10.
Indeed, the selling mood took over markets’ sentiment and dragged prices lower on the back of the re-emergence of recession concerns and demand jitters, the latter stemming from renewed COVID measures in China, which undermined prospects for the demand of crude going forward.
Investors’ worries around a slowdown gathered extra pace after the US consumer sentiment gauge showed the morale among consumers remains healthy, which translated into extra conviction that the Fed needs to maintain the current course.
In the calendar, driller Baker Hughes reported that US oil rig count went up by 8 in the week to October 14, taking the total US active oil rigs to 610.
Next on the downside for the WTI comes the minor support at $79.16 (September 30), which precedes the September low at $76.28 (September 26) and the 2022 low at $74.30 (January 3). The breach of the latter is expected to motivate the weekly low at $66.15 (December 20 2021) to re-emerge on the horizon prior to the December 2021 low at $62.46 (December 2 2021). The initial up barrier, in the meantime, turns up at the October high at $93.62 (October 10) seconded by the weekly high at $97.65 (August 30) and the key 200-day SMA at $98.16, all preceding the psychological $100.00 mark per barrel.
Resistance levels: $90.05 $93.62 $97.65 (4H chart)
Support levels: $85.19 $84.58 $82.18 (4H chart)
-638014711343294216.png)
DOW JONES
Equities tracked by the three major US stock indices closed the week well into the negative territory in response to renewed concerns that the Fed could extend the aggressive normalization of its monetary conditions in the upcoming months.
Indeed, investors’ sentiment soured after the flash U-Mich gauge showed a higher-than-expected print for the month of October, at a time when inflation expectations also went up, adding to the already rising jitters emerged in the wake of another unexpected rise in US inflation figures for the month of September, published on Thursday.
Despite the marked pullback, the Dow Jones managed to clinch the second weekly close with gains.
All in all, the Dow Jones retreated 1.34% to 29,634, the S&P500 dropped 2.37% to 3,583 and the tech-benchmark Nasdaq Composite shed 3.08% to 10,321.
In case losses accelerate in the Dow Jones, the next support of note aligns at the 2022 low at 28,660 (October 13) ahead of the October 2020 low at 26,143 (October 30). In the meantime, the October top at 30,454 (October 5) continues to cap the upside ahead of the weekly peak at 31,026 (September 19) and the September high at 32,504 (September 12). Further gains could revisit the key 200-day SMA at 32,898 before the 33,364 level (August 26). The daily RSI deteriorated to the sub-45 area.
Top Performers: JPMorgan, UnitedHealth, Boeing
Worst Performers: American Express, Apple, Chevron
Resistance levels: 30,454 31,020 31,535 (4H chart)
Support levels: 28,660 26,143 25,992 (4H chart)
-638014712298062592.png)
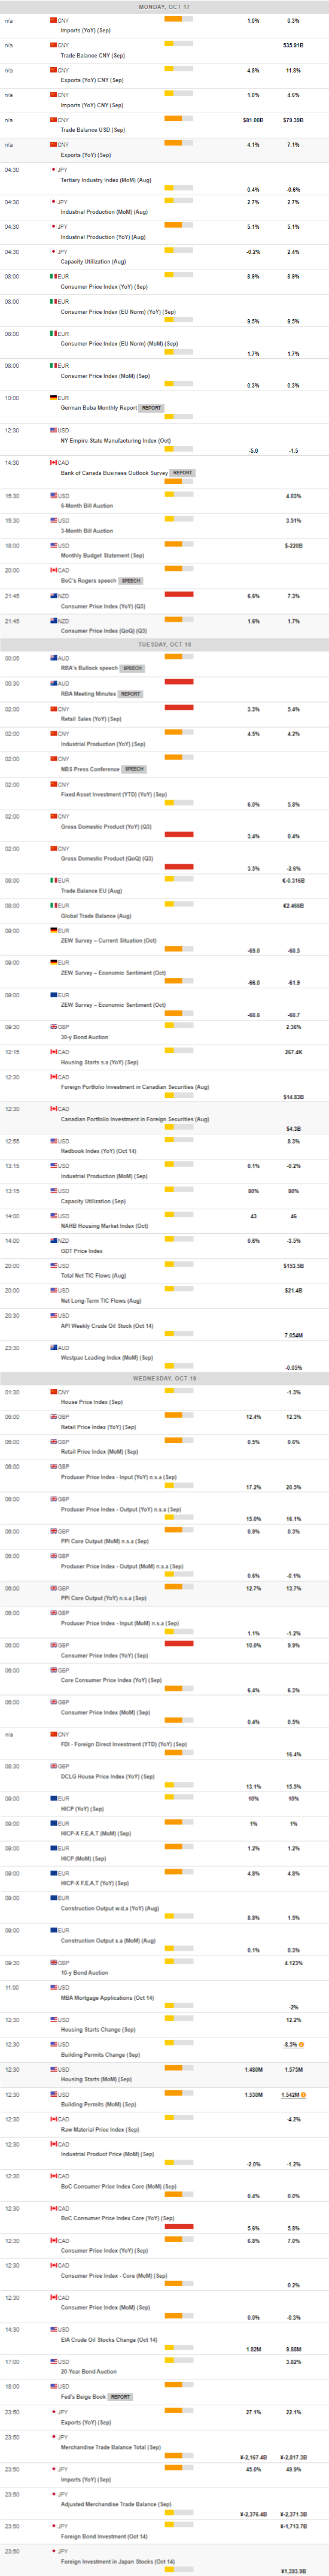
MACROECONOMIC EVENTS
All Information & Updates provided by:

All information relating to the financial markets available on this page has been prepared and issued by FXStreet (Forexstreet SL, Spain, Reg: B62498233) on the basis of publicly available information and all information believed to be reliable and does not conflict with Kuwaiti local laws, and all necessary care has been taken to before the company to ensure that the facts mentioned are correct from the source.
NCM Investment nor any of its directors or employees shall in any way be held responsible for the contents of this news, and the information contained on this page is intended only to provide clients with publicly available information and should not be construed as investment advice, report or analysis and/or constitute an offer or invitation to buy or sell financial instruments of any kind.
RISK WARNING: Forex and CFDs are highly risky leveraged products, as losses can exceed deposits. Please ensure you understand all the risks and take independent advice if necessary. NCM will segregate the clients based on the criteria of the regulator and its bylaws. NCM does not provide any advisory service; the material published does not constitute advice or a recommendation for a transaction in any financial instrument. NCM accepts no responsibility for any use of the content presented and any consequences of that use. Anyone acting on the information provided does so at their own risk.