
- Contact Us:
-

-

-

-


Daily Market Updates
18 Oct 2022
EURUSD
EUR/USD regained the smile and advanced well north of the 0.9800 hurdle at the beginning of the week, printing at the same time new multi-session peaks.
The resumption of the sentiment towards the risk complex weighed on the greenback and underpinned the recovery in spot, forcing the USD Index (DXY) to briefly probe the area below the 112.00 mark.
The calm session in the US and German money markets saw yields of the 10-year benchmarks fade part of the recent advance and trade with humble losses. The only exception was the 30-year bond yields, which advanced marginally past the 4.00% yardstick.
Looking at the ECB, Board member O.Rehn suggested that stagflation risks appear to have increased, while his colleague De Guindos could not rule out a recession in the Euroland, at the time when he suggested that the region’s inflation is expected to start receding in 2023. De Guindos also expects the FX rate to stabilize in the next month and while he reiterated that the bank does not target the exchange rate, it does consider it.
Data wise in the euro zone, Italian final Inflation Rate rose 0.3% MoM in September and 8.9% YoY. In the US docket, the NY Empire State Manufacturing Index deteriorated to -9.1 for the month of October.
Further recovery in EUR/USD should target the 55-day SMA at 0.9962 prior to the October top at 0.9999 (October 4), which remains bolstered by the 8-month resistance line. Once cleared, the downside pressure around the pair is expected to alleviate and therefore motivate spot to potentially challenge the weekly peak at 1.0050 (September 20) ahead of the 100-day SMA at 1.0150 and the September high at 1.0197 (September 12). Sellers, in the meantime, should look to retest the October low at 0.9631 (October 13) before the 2022 low at 0.9535 (September 28). South from here aligns the round level at 0.9500 seconded by the weekly low at 0.9411 (June 17 2002). The daily RSI picked up pace and trespassed 50.
Resistance levels: 0.9852 0.9866 0.9999 (4H chart)
Support levels: 0.9706 0.9631 0.9535 (4H chart)
-638016272267192406.png)
USDJPY
USD/JPY alternated gains with losses in the area of fresh 32-year highs just below the 149.00 yardstick on Monday.
Indeed, the persistent risk-on sentiment kept the dollar under pressure and favoured the exodus from the safe havens, morphing at the same time into extra depreciation of the yen.
In addition, the recovery in US bonds motivated yields to scale back part of their recent gains and also limited the upside bias in the pair.
Following the ongoing sharp depreciation of the Japanese currency, Japan Top Currency Diplomat Wanda said that the country will strongly respond to excessive movements in the FX markets, while finmin Suzuki reiterated that the MoF continues to closely follow FX developments.
BoJ’s Governor Kuroda said inflation would pick up pace over the rest of the year, although he reiterated that it will drop below 2% next fiscal year onward.
In the Japanese calendar, final figures saw Industrial Production expand 5.8% in the year to August, while the Tertiary Industry Index expanded 0.7% MoM in the same month.
USD/JPY now faces the immediate up barrier at the 2022 top at 148.89 (October 17) ahead of the key round level at 150.00 and the August 1990 top at 151.65. On the flip side, initial contention is still seen at the October low at 143.52 (October 5) prior to the post-intervention low at 140.34 (September 22). South from here comes the temporary 100-day SMA at 138.18 ahead of the weekly low at 135.80 (August 23) and another weekly low at 131.73 (August 11). The daily RSI remained well in the overbought territory near 77.
Resistance levels: 148.89 150.75 151.25 (4H chart)
Support levels: 146.42 145.42 145.23
-638016272640795444.png)
GBPUSD
Falling in line with the rest of its risky peers, the sterling posted (very) strong gains vs. the dollar at the beginning of the week, lifting GBP/USD back above 1.1400 the figure, although shedding some ground afterwards.
Investors’ focus of attention was on the speech by UK Chancellor J.Hunt, who reiterated that the government’s main responsibility is to ensure economic stability. Hunt added, among other things, that stamp duty and national insurance changes will go ahead, and the basic rate of income tax is seen at 20% indefinitely. He also said that the universal energy price guarantee will end in April 2023, while support after that will be targeted.
Next of relevance in the UK docket will be the release of the September inflation figures on Wednesday.
The continuation of the upside momentum in GBP/USD is seen facing the next hurdle at the October top at 1.1495 (October 5). Beyond the latter emerges the 55-day SMA at 1.1554 ahead of the September peak at 1.1738 (September 13). The surpass of this region could expose a move to the 100-day SMA at 1.1832 before the weekly high at 1.1900 (August 26) and the psychological 1.2000 yardstick. On the contrary, the October low at 1.0923 (October 12) should hold the initial downside followed by the 1.0538 level (September 28) and the all-time low at 1.0356 (September 26). The daily RSI improved to the vicinity of 50.
Resistance levels: 1.1439 1.1495 1.1589 (4H chart)
Support levels: 1.1289 1.1151 1.1057 (4H chart)
-638016271789199773.png)
AUDUSD
AUD/USD capitalized on the weaker dollar and the prevailing appetite for the risk complex and managed to partially recoup Friday’s sharp retracement.
Indeed, the acute rebound in the pair managed to reclaim levels beyond the 0.6300 mark, putting further distance from last week’s lows near 0.6170.
The mixed performance in the commodity galaxy limited the pair’s upside bias after copper prices retreated marginally, while price action around the iron ore remained directionless.
Other than the domestic backyard and dollar dynamics, the Aussie dollar is expected to track developments from the 20th National Congress of the Communist Party in China, particularly announcements regarding economic growth prospects.
No data releases Down Under on Monday leaves all the attention to the publication of the RBA Minutes on Tuesday.
If the recovery in AUD/USD gathers extra pace, then the next hurdle of note is not expected until the October high at 0.6547 (October 3) ahead of the weekly top at 0.6747 (September 20). The surpass of the latter exposes the 100-day SMA at 0.6822 just ahead of the 6-month resistance line near 0.6860. North from here appears the September peak at 0.6916 (September 13) before the psychological 0.7000 yardstick. On the downside, initial support emerges at the 2022 low at 0.6169 (October 13) ahead of the psychological 0.6000 level and the April 2020 low at 0.5980 (April 3). The daily RSI left the oversold territory and climbed past the 35 level.
Resistance levels: 0.6311 0.6346 0.6432 (4H chart)
Support levels: 0.6194 0.6169 0.6115 (4H chart)
-638016273029033061.png)
GOLD
Gold set aside two consecutive daily pullbacks and reclaimed the vicinity of the $1,670 mark per ounce troy on Monday.
In fact, the resumption of the bearish trade around the dollar in combination with the mixed developments in US yields across the curve facilitated the rebound in the precious metal, always amidst a calm macro environment and with investors almost fully pricing in a ¾ point rate raise by the Federal Reserve at the November 2 meeting.
Still around rate hikes – and also limiting the upside potential of the yellow metal - there seems to be firmer confidence that the European Central Bank (ECB) will also hike its key policy rate by 75 bps at its gathering next week.
Extra gains in gold are expected to meet a temporary hurdle at the 55-day SMA at $1,714 ahead of the more relevant September high at $1,735 (September 12) and the 100-day SMA at $1,748. Once cleared, the precious metal could head towards the $1,765 level (August 25) prior to the critical $1,800 region and the August top at $1,807 (August 10). Contrarily, there is an initial down barrier at the October low at $1,640 (October 14) ahead of the 2022 low at $1,614 (September 28). The loss of this region could open the door to the round level at $1,600 and the April 2020 low at $1,572 (April 1).
Resistance levels: $1,684 $1,714 $1,729 (4H chart)
Support levels: $1,640 $1,614 $1,572 (4H chart)
-638016273399465424.png)
CRUDE WTI
WTI prices extended the recent choppy activity and posted modest gains at the beginning of the week.
In fact, the soft tone in the dollar plus positive news coming from China kind of lifted spirits among traders on Monday and encouraged crude oil to regain some upside traction to the area just past the $87.00 mark per barrel.
However, the spectre of a global slowdown and the persistent COVID-zero policy in China are expected to keep the commodity under pressure for the time being.
If $84.63 (October 17) is breached, then the WTI risks a deeper pullback to the key $80.00 mark per barrel ahead of the minor support at $79.16 (September 30). South from here emerges the September low at $76.28 (September 26) followed by the 2022 low at $74.30 (January 3). Once cleared, a probable test of the weekly low at $66.15 (December 20 2021) could return to the traders’ radar ahead of the December 2021 low at $62.46 (December 2 2021). In the opposite direction, the October top at $93.62 (October 10) should offer initial resistance seconded by the weekly peak at $97.65 (August 30) and the key 200-day SMA at $98.20, all before the psychological $100.00 mark.
Resistance levels: $87.09 $89.72 $90.05 (4H chart)
Support levels: $84.60 $82.18 $79.12 (4H chart)
-638016274110825788.png)
DOW JONES
Better-than-expected results from Bank of America sponsored an initial rally in the banking sector that was rapidly followed by the rest of equities on Monday.
In fact, the burst of optimism among investors quickly spread to the rest of the sectors in the US markets, relegating usual recession concerns and looking past the already priced in 75 bps rate hike by the Fed in November.
Indeed, the Dow Jones gained 2.13% to 30,265, the S&P500 advanced 2.87% to 3,685 and the tech-heavy Nasdaq Composite rose 3.47% to 10,679.
If gains around the Dow Jones accelerate, then the index should revisit the October peak at 30,454 (October 5) in the near term prior to the weekly high at 31,026 (September 19) and the September top at 32,504 (September 12). If cleared, then the focus of attention is expected to gyrate to the key 200-day SMA at 32,867 ahead of the 33,364 level (August 26). In case sellers regain control, the 2022 low at 28,660 (October 13) is expected to return to the fore prior to the October 2020 low at 26,143 (October 30). The daily RSI leapt to the proximity of 51.
Top Performers: JPMorgan, Microsoft, American Express
Worst Performers: Dow, 3M, Amgen
Resistance levels: 30,454 31,020 31,520 (4H chart)
Support levels: 28,660 26,143 25,992 (4H chart)
-638016274426561526.png)
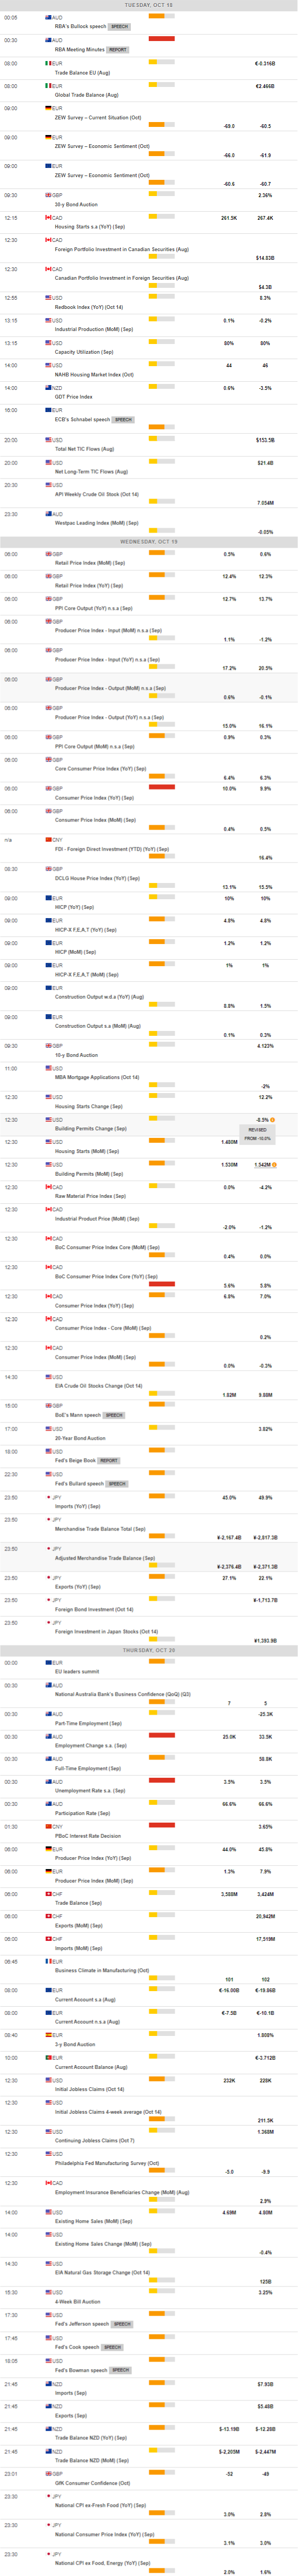
MACROECONOMIC EVENTS
All Information & Updates provided by:

All information relating to the financial markets available on this page has been prepared and issued by FXStreet (Forexstreet SL, Spain, Reg: B62498233) on the basis of publicly available information and all information believed to be reliable and does not conflict with Kuwaiti local laws, and all necessary care has been taken to before the company to ensure that the facts mentioned are correct from the source.
NCM Investment nor any of its directors or employees shall in any way be held responsible for the contents of this news, and the information contained on this page is intended only to provide clients with publicly available information and should not be construed as investment advice, report or analysis and/or constitute an offer or invitation to buy or sell financial instruments of any kind.
RISK WARNING: Forex and CFDs are highly risky leveraged products, as losses can exceed deposits. Please ensure you understand all the risks and take independent advice if necessary. NCM will segregate the clients based on the criteria of the regulator and its bylaws. NCM does not provide any advisory service; the material published does not constitute advice or a recommendation for a transaction in any financial instrument. NCM accepts no responsibility for any use of the content presented and any consequences of that use. Anyone acting on the information provided does so at their own risk.