
- Contact Us:
-

-

-

-


Daily Market Updates
19 Oct 2022
EURUSD
EUR/USD charted decent gains and advanced for the second session in a row, meeting initial resistance in the 0.9870/75 band on turnaround Tuesday.
The greenback, in the meantime, regained composure after bottoming out in the sub-112.00 region – or multi-session lows – and advanced marginally when tracked by the USD Index (DXY).
The small uptick in the dollar came in line with a marginal improvement in US yields across the curve. In Germany, the 10-year bund yields also moved higher and kept business in the upper end of the recent range.
Nothing new in the macro scenario, where investors appear to have already priced in a 75 bps rate hike by the ECB and the Fed, while the FX universe has practically ignored the resurgence of the geopolitical effervescence so far.
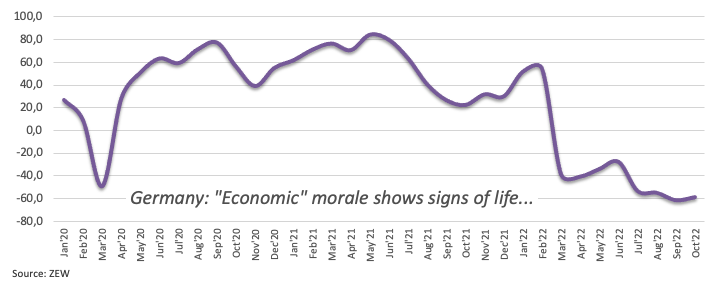
In the euro docket, the Economic Sentiment tracked by the ZEW institute in both Germany and the Euroland unexpectedly improved to -59.2 and -59.7, respectively, for the month of October.
Across the Atlantic, Industrial Production expanded at a monthly 0.4% in September and 5.3% over the last twelve months. In addition, the NAHB Housing Market Index tumbled to 38 (from 46) in October.
The surpass of the weekly top at 0.9875 (October 18) could open the door to a visit to the 55-day SMA at 0.9956 ahead of the 8-month resistance line near 0.9980. If EUR/USD clears this region, the downside pressure is predicted to mitigate and allow for the continuation of the recovery to, initially, the October peak at 0.9999 (October 4) prior to the weekly high at 1.0050 (September 20) and the 100-day SMA at 1.0141. Further up aligns the September top at 1.0197 (September 12). On the flip side, the October low at 0.9631 (October 13) is seen holding the initial test prior to the 2022 low at 0.9535 (September 28). The loss of the latter could pave the way for a move to the round level at 0.9500 followed by the weekly low at 0.9411 (June 17 2002). The daily RSI hovered around the 51 region.
Resistance levels: 0.9875 0.9926 0.9999 (4H chart)
Support levels: 0.9823 0.9706 0.9631 (4H chart)
-638017166191184617.png)
USDJPY
The rally in USD/JPY looked everything but abated once again on Tuesday. This time the pair surpassed the 149.00 hurdle to clinch fresh tops in an area last visited back in mid-August 1990, always in a context favourable to the risk-on trade.
Despite the erratic sentiment in the greenback, spot climbed further and recorded the 10th consecutive session with gains. The upside momentum, however, appeared limited by the lack of upside traction in yields in the 2y-10y segment, while the long end of the curve advanced tepidly.
The ongoing depreciation of the Japanese currency triggered once again a plethora of comments from Japanese officials: Chief Cabinet Secretary Matsuno said the government continues to closely follow FX movements with a high feeling of urgency. In addition, PM Kishida suggested that speculative-driven rapid FX fluctuations are problematic, while BoJ’s Kuroda noted that the yen depreciation is becoming a factor in price gains.
There were no releases in the Japanese docket on Tuesday.
Next on the upside for USD/JPY now comes the key round level at 150.00 ahead of the August 1990 peak at 151.65. In the opposite direction, the October low at 143.52 (October 5) still appears as the immediate support ahead of the post-intervention low at 140.34 (September 22). The loss of the latter could open the door to the interim 100-day SMA at 138.39 prior to the weekly low at 135.80 (August 23) and another weekly low at 131.73 (August 11). The daily RSI held steady around 77.
Resistance levels: 149.38 150.75 151.25 (4H chart)
Support levels: 148.11 146.42 145.42 (4H chart)
-638017167044349254.png)
GBPUSD
Following the inconclusive price action around the greenback and some domestic woes, GBP/USD gave away part of the strong gains recorded at the beginning of the week and revisited the 1.1250 region on Tuesday, where it met some contention.
In fact, the sterling succumbed to rumours in the UK political area despite calmer waters surrounding the Gilt market, particularly after Chancellor Hunt’s speech on Monday.
Nothing scheduled in the UK calendar left all the attention to the publication of the UK inflation figures on Wednesday.
If GBP/USD leaves behind the weekly top at 1.1439 (October 17) it could then challenge the October high at 1.1495 (October 5). North from here comes the temporary 55-day SMA at 1.1538 prior to the September high at 1.1738 (September 13). Extra gains are seen testing the 100-day SMA at 1.1818 ahead of the weekly top at 1.1900 (August 26) and the psychological 1.2000 mark. On the downside, initial support emerges at the October low at 1.0923 (October 12) seconded by the 1.0538 level (September 28) and the all-time low at 1.0356 (September 26). The daily RSI deflated a tad to the 50 area.
Resistance levels: 1.1439 1.1495 1.1589 (4H chart)
Support levels: 1.1255 1.1151 1.1057 (4H chart)
-638017166731766041.png)
AUDUSD
AUD/USD rose to 2-day highs and managed to extend further the breakout of the 0.6300 barrier on Tuesday.
Indeed, AUD-bulls met extra motivation in the inconclusive price action around the greenback and pushed spot higher despite the absence of a clear direction in the commodity universe.
From the RBA Minutes, members suggested that additional rate hikes are inevitable in the upcoming months, although rates are not particularly high. In addition, members noted that higher rates abroad are projected to substantially decrease global growth and reduce inflation.
In addition, Deputy Governor Bullock said that a 25 bps rate hike in October was necessary, as it assessed developments in consumption, earnings and the foreign economy. She also suggested that inflation could be brought down without entering recession and said that the board intends to raise interest rates further in the next months, while their speed and timing will depend on data.
A more serious rebound in AUD/USD is expected to face the next up barrier at the October peak at 0.6547 (October 3) ahead of the 55- and 100-day SMAs at 0.6709 and 0.6814, respectively. North from here turns up the 6-month resistance line around 0.6860 prior to the September high at 0.6916 (September 13) and the psychological 0.7000 mark. Contrarily, the 2022 low at 0.6169 (October 13) emerges as the immediate relevant contention before the psychological 0.6000 level and followed by the April 2020 low at 0.5980 (April 3). The daily RSI bounced sharply and flirted with the 40 area.
Resistance levels: 0.6339 0.6346 0.6391 (4H chart)
Support levels: 0.6194 0.6169 0.6115 (4H chart)
-638017167371068682.png)
GOLD
Prices of the ounce troy of the precious metal printed marginal gains for the second session in a row on Tuesday, extending at the same time the optimistic start of the week.
The lack of direction in both the greenback and US yields underpinned another positive session with gains in bullion, which managed at the same time to put further distance from last week’s lows around $1,640 (October 14).
Price action around bullion, in the meantime, is expected to keep tracking developments from the tightening bias in major central banks, while the persistent elevated inflation and bouts of geopolitical effervescence could limit occasional weakness.
Gold faces the next up barrier at the 55-day SMA at $1,712 prior to the September top at $1,735 (September 12) and the 100-day SMA at $1,746. If the yellow metal clears this region, then the door could open to another visit to the $1,765 level (August 25) before the critical $1,800 region, which is closely followed by the August peak at $1,807 (August 10). Inversely, bears should face the next support at the October low at $1,640 (October 14) before the 2022 low at $1,614 (September 28). A deeper retracement could put the round level at $1,600 back on the traders’ radar ahead of the April 2020 low at $1,572 (April 1).
Resistance levels: $1,668 $1,684 $1,714 (4H chart)
Support levels: $1,640 $1,614 $1,572 (4H chart)
-638017167725356489.png)
CRUDE WTI
Prices of the barrel of the West Texas Intermediate (WTI) tumbled to fresh 2-week lows and revisited the proximity of the $82.00 mark on Tuesday.
This time, demand concerns played the rounds among traders and kept the sentiment depressed. The absence of key data releases in China also added to the downbeat mood, while speculation that the White House could announce the release of extra oil from the SPR also added to the decline.
Later in the NA session, the API will report on the US crude oil inventories in the week to October 14.
If the selling pressure in the WTI gathers extra steam, then a test of the key $80.00 mark per barrel could start shaping up prior to the minor support at $79.16 (September 30). A drop below the latter could pave the way for a move to the September low at $76.28 (September 26) before the 2022 low at $74.30 (January 3). The next up barrier is expected at the October peak at $93.62 (October 10) ahead of the weekly high at $97.65 (August 30), which precedes the key 200-day SMA at $98.22 and the psychological $100.00 mark.
Resistance levels: $85.40 $87.09 $89.72 (4H chart)
Support levels: $82.10 $79.12 $76.54 (4H chart)
-638017168365708424.png)
DOW JONES
Equities tracked by the three major US stock indices leapt to multi-week highs on Tuesday. Indeed, the Dow Jones traded at shouting distance from the 31,000 pts barrier.
This week’s abrupt change of mood among traders followed once again better-than-expected quarterly results, this time from lender Goldman Sachs. Same as in the previous session, optimism rapidly spread to the rest of the sectors soon after the results were out.
All in all, the Dow Jones rose 1.23% to 30,559, the S&P500 gained 1.30% to 3,725 and the tech-benchmark Nasdaq Composite advanced 1.18% to 10,802.
Extra buying interest could motivate the Dow Jones to revisit the weekly top at 31,026 (September 19) ahead of the September peak at 32,504 (September 12). North from here comes the key 200-day SMA at 32,839 seconded by the 33,364 level (August 26). The resumption of the downtrend could put a test of the 2022 low at 28,660 (October 13) back on the radar before the October 2020 low at 26,143 (October 30). The daily RSI extended the march north to the 55 zone.
Top Performers: Salesforce Inc, Goldman Sachs, American Express
Worst Performers: Intel, J&J, Amgen
Resistance levels: 30,837 31,020 31,514 (4H chart)
Support levels: 28,660 26,143 25,992 (4H chart)
-638017168720497013.png)
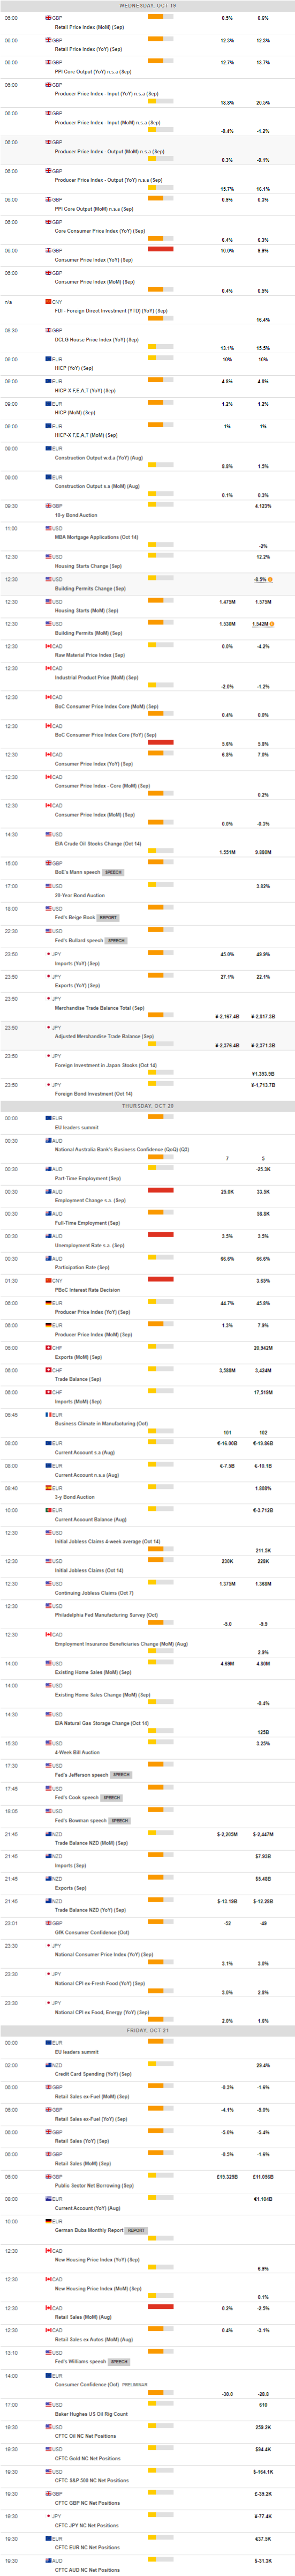
MACROECONOMIC EVENTS
All Information & Updates provided by:

All information relating to the financial markets available on this page has been prepared and issued by FXStreet (Forexstreet SL, Spain, Reg: B62498233) on the basis of publicly available information and all information believed to be reliable and does not conflict with Kuwaiti local laws, and all necessary care has been taken to before the company to ensure that the facts mentioned are correct from the source.
NCM Investment nor any of its directors or employees shall in any way be held responsible for the contents of this news, and the information contained on this page is intended only to provide clients with publicly available information and should not be construed as investment advice, report or analysis and/or constitute an offer or invitation to buy or sell financial instruments of any kind.
RISK WARNING: Forex and CFDs are highly risky leveraged products, as losses can exceed deposits. Please ensure you understand all the risks and take independent advice if necessary. NCM will segregate the clients based on the criteria of the regulator and its bylaws. NCM does not provide any advisory service; the material published does not constitute advice or a recommendation for a transaction in any financial instrument. NCM accepts no responsibility for any use of the content presented and any consequences of that use. Anyone acting on the information provided does so at their own risk.