
- Contact Us:
-

-

-

-


Daily Market Updates
21 Oct 2022
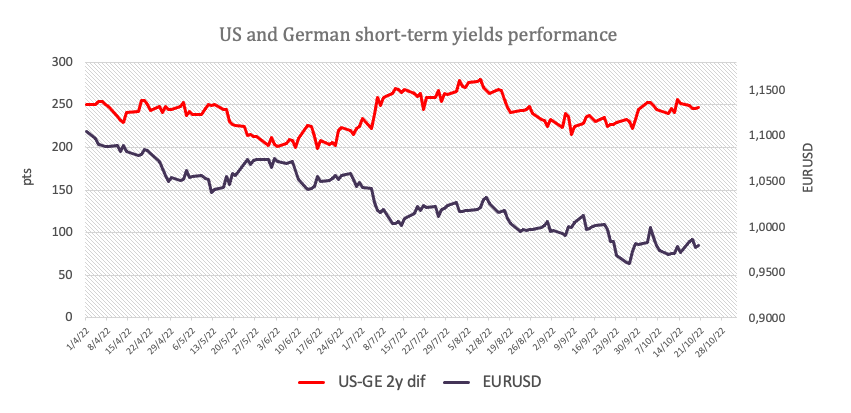
EURUSD
EUR/USD posted humble gains following Wednesday’s steep sell-off, managing to gather quite strong upside traction and reach the mid-0.9800s before deflating on Thursday.
The weak tone in the greenback, in the meantime, allowed the recovery in the pair as well as in the risk complex, with the USD Index (DXY) revisiting the 112.20/15 band, where it met decent contention.
The daily downtick in the buck came in contrast to the continuation of the upside momentum in US yields, which climbed to fresh multi-year highs across the curve, as investors continued to assess the tighter-for-longer stance from the Federal Reserve.
Back to the docket, the Current Account deficit in the broader euro area widened to €26.32B in August in what was the sole release close to home.
In the US calendar, Initial Jobless Claims rose by 214K in the week to October 15, the Philly Fed Manufacturing Index improved to -8.7 in October, the CB Leading Index contracted 0.4% MoM in September and Existing Home Sales shrank 1.5% MoM to 4.71M units, also in September.
If bulls push harder, then EUR/USD is seen facing the immediate up barrier at the weekly high at 0.9875 (October 18) ahead of the 55-day SMA at 0.9941, which appears closely followed by the 8-month resistance line. Above this region, the pair’s downside bias could lose some steam and prompt spot to challenge the October top at 0.9999 (October 4) prior to the weekly peak at 1.0050 (September 20). Extra gains could then see the 100-day SMA at 1.0123 retested ahead of the September high at 1.0197 (September 12). On the flip side, the October low at 0.9631 (October 13) is expected to hold the downside initially prior to the 2022 low at 0.9535 (September 28). South from here emerges the round level at 0.9500 before the weekly low at 0.9411 (June 17 2002). The daily RSI ticked slightly higher to the area past 47.
Resistance levels: 0.9852 0.9875 0.9926 (4H chart)
Support levels: 0.9754 0.9706 0.9631 (4H chart)
-638018858991120788.png)
USDJPY
Another day, another high in USD/JPY.
Indeed, this time spot clinched its 12th consecutive daily advance and ephemerally trespassed the key 150.00 barrier – or fresh 32-year highs – on Thursday, always amidst persistent speculation of further intervention by the BoJ/MoF.
On the latter, Japan Top Currency Diplomat Kanda declined to comment on interventions at the time when he stressed the readiness to take appropriate action in the FX markets. Earlier on, finmin Suzuki also made no comments regarding the likelihood of FX intervention.
In the meantime, the BoJ announced it will conduct emergency bond purchases amidst the intense depreciation of the yen and the widening Fed-BoJ policy divergence. The central bank said it would buy around ¥100B of JGBs in the 10y-20y range and ¥100B in the 5y-10y range.
Data wise in Japan, the trade deficit shrank to ¥2094B in September and Foreign Bond Investment rose to ¥389.9B in the week to October 15.
If USD/JPY manages to surpass the 150.00 level in a sustainable fashion, then the next target of note is seen at the August 1990 high at 151.65. On the contrary, initial support still lies at the October low at 143.52 (October 5) ahead of the post-intervention low at 140.34 (September 22). The loss of the latter could prompt the pair to test the interim 100-day SMA at 138.78 prior to the weekly low at 135.80 (August 23) and another weekly low at 131.73 (August 11). The daily RSI hovered around the 80 region.
Resistance levels: 150.08 150.75 151.25 (4H chart)
Support levels: 149.55 148.11 146.42 (4H chart)
-638018860033536883.png)
GBPUSD
GBP/USD regained some balance and set aside two daily drops in a row on the back of the marked selling pressure in the dollar and the resurgence of the appetite for the riskier assets on Thursday.
In fact, after hitting fresh weekly lows near 1.1170, the sterling sparked a decent comeback and reclaimed the 1.1200 mark and beyond, all against the backdrop of the escalating turmoil in UK politics, where (now former) PM L.Truss announced her resignation. According to latest news on the matter, the new PM could be announced in the next few days.
From the BoE, MPC member Broadbent said it is not clear whether rates must rise as much as markets expect.
In the meantime, daily gains in the quid were accompanied by a marginal uptick in the UK 10-year benchmark gilt yields, which reversed three consecutive daily drops.
There were no data releases scheduled in the UK docket on Thursday.
The weekly top at 1.1439 (October 17) turns up as the initial hurdle in case GBP/USD regains further upside pressure. Beyond this level appears the October peak at 1.1495 (October 5) seconded by the 55-day SMA at 1.1505. Extra gains could then target the September high at 1.1738 (September 13) ahead of the 100-day SMA at 1.1792 and the weekly top at 1.1900 (August 26), which precedes the psychological 1.2000 level. On the downside, there are no support levels of importance until the October low at 1.0923 (October 12) followed by the 1.0538 level (September 28) and the all-time low at 1.0356 (September 26). The daily RSI improved a tad and flirted with 49.
Resistance levels: 1.1336 1.1439 1.1495 (4H chart)
Support levels: 1.1171 1.1151 1.1057 (4H chart)
-638018859576677540.png)
AUDUSD
AUD/USD kept the erratic performance so far this week.
Indeed, the Aussie dollar left behind Wednesday’s pullback and regained the 0.6300 barrier and above in a context favourable to the risky assets and amidst a broad-based offered stance in the dollar.
The mixed results from the commodity universe also seems to have lent legs to the pair after copper prices rebounded markedly vs. marginal gains in prices of the tonne of iron ore.
Data wise Down Under, the Employment Change rose by 0.9K persons in September, while the Unemployment Rate held steady at 3.5% in the same period.
AUD/USD looks consolidative for the time being and the break above this theme should motivate the pair to dispute the October top at 0.6547 (October 3) ahead of the 55- and 100-day SMAs at 0.6684 and 0.6795, respectively. North from here turns up the September peak at 0.6916 (September 13) before the psychological 0.7000 yardstick. In opposition, the next area of contention is expected at the 2022 low at 0.6169 (October 13) before the psychological 0.6000 mark and ahead of the April 2020 low at 0.5980 (April 3). The daily RSI picked up pace and surpassed 37.
Resistance levels: 0.6356 0.6432 0.6540 (4H chart)
Support levels: 0.6228 0.6194 0.6169 (4H chart)
-638018860351432776.png)
GOLD
The renewed offered bias in the greenback motivated prices of the yellow metal to attempt a mild rebound soon after recording 3-week lows near $1,620 per ounce troy on Thursday.
However, the persistent march north in US yields kept the upside potential in bullion subsided, as market participants continued to reprice the Fed’s tightening stance.
So far, the precious metal navigates the second consecutive week with losses and trades on the defensive for the 7th consecutive month, shedding at the same time more than 10% since the beginning of the year.
Gold prices trade at shouting distance from the 2022 low at $1,614 (September 28). The breach of this level could prompt the round level at $1,600 to emerge on the horizon ahead of the April 2020 low at $1,572 (April 1). By contrast, there is a temporary up-barrier at the 55-day SMA at $1,707 prior to the September high at $1,735 (September 12) and the 100-day SMA at $1,741. Further up comes the $1,765 level (August 25) before the critical $1,800 zone and the August top at $1,807 (August 10).
Resistance levels: $1,645 $1,668 $1,682 (4H chart)
Support levels: $1,622 $1,614 $1,572 (4H chart)
-638018860641285737.png)
CRUDE WTI
Prices of the American reference for the sweet light crude oil navigated in a volatile session on Thursday, climbing as high as the area above the $87.00 mark and meeting support near the $84.00 mark per barrel.
In fact, news citing the probability that China could ease some COVID restrictions for visitors lifted spirits among traders, while the renewed selling pressure in the US dollar also collaborated with the daily improvement.
The resumption of the downside pressure could force prices of the WTI to revisit the weekly low at $82.10 (October 18) ahead of the key $80.00 mark per barrel. Once cleared, the minor support at $79.16 (September 30) could then return to the radar prior to the September low at $76.28 (September 26) and the 2022 low at $74.30 (January 3). On the other hand, the next up barrier of relevance turns up at to the October top at $93.62 (October 10) before the weekly peak at $97.65 (August 30). The continuation of the bounce could revisit the key 200-day SMA at $98.25 just ahead of the psychological $100.00 mark.
Resistance levels: $87.12 $89.72 $93.62 (4H chart)
Support levels: $84.23 $82.06 $79.12 (4H chart)
-638018861323719127.png)
DOW JONES
Equities added to Wednesday’s downtick when tracked by the three major US stock indices. Against that, the Dow Jones dropped 0.27% to 30,339, the S&P500 shed 0.75% to 3,667 and the tech-benchmark Nasdaq Composite retreated 0.24% to 10,655.
The optimism among traders rapidly fizzled out after the opening bell in Wall St. on Thursday, as the initial upbeat tone in response to better-than-estimated quarterly results did not stick, giving way to recession concerns against the backdrop of the unabated climb in US yields.
So, extra weakness in the Dow Jones is not expected to meet any noteworthy support until the 2022 low at 28,660 (October 13) prior to the October 2020 low at 26,143 (October 30). Immediately to the upside, in the meantime, comes the October peak at 30.837 (October 18) seconded by the weekly high at 31,026 (September 19) and the September top at 32,504 (September 12). The breakout of this level exposes a visit to the key 200-day SMA at 32,775 ahead of the 33,364 level (August 26). The daily RSI deflated to the proximity of 51.
Top Performers: IBM, Salesforce Inc, Dow
Worst Performers: Home Depot, Travelers, Caterpillar
Resistance levels: 30,837 31,020 31,455 (4H chart)
Support levels: 28,660 26,143 25,992 (4H chart)
-638018861604927889.png)
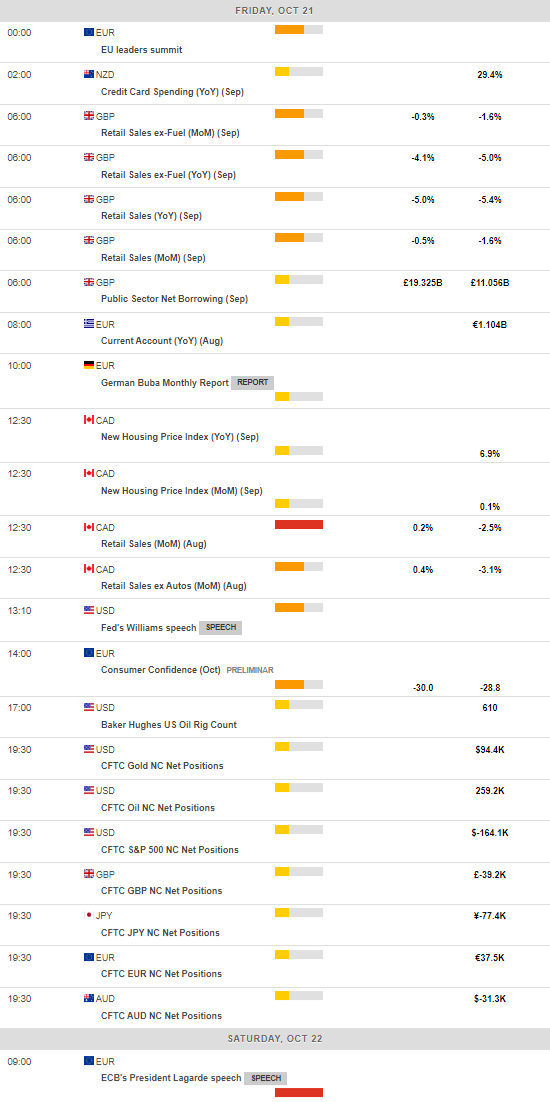
MACROECONOMIC EVENTS
All Information & Updates provided by:

All information relating to the financial markets available on this page has been prepared and issued by FXStreet (Forexstreet SL, Spain, Reg: B62498233) on the basis of publicly available information and all information believed to be reliable and does not conflict with Kuwaiti local laws, and all necessary care has been taken to before the company to ensure that the facts mentioned are correct from the source.
NCM Investment nor any of its directors or employees shall in any way be held responsible for the contents of this news, and the information contained on this page is intended only to provide clients with publicly available information and should not be construed as investment advice, report or analysis and/or constitute an offer or invitation to buy or sell financial instruments of any kind.
RISK WARNING: Forex and CFDs are highly risky leveraged products, as losses can exceed deposits. Please ensure you understand all the risks and take independent advice if necessary. NCM will segregate the clients based on the criteria of the regulator and its bylaws. NCM does not provide any advisory service; the material published does not constitute advice or a recommendation for a transaction in any financial instrument. NCM accepts no responsibility for any use of the content presented and any consequences of that use. Anyone acting on the information provided does so at their own risk.