
- Contact Us:
-

-

-

-


Daily Market Updates
24 Oct 2022
EURUSD
What a comeback for the single currency.
Indeed, EUR/USD regained strong upside traction and quickly left behind the drop to new weekly lows in the vicinity of the 0.9700 mark in response to the abrupt and acute drop in the greenback following another intervention in the FX markets by the Bank of Japan (BoJ) and the Ministry of Finance (MoF).
The pair, in the meantime, managed to close the first week with gains in levels well north of 0.9800 the figure, leaving an auspicious prospect for the upcoming week, where the main attraction will be the ECB interest rate decision on October 27.
In addition, market chatter around the likelihood that the Federal Reserve could slow the pace of its tightening stance also put the buck under pressure and motivated the daily knee-jerk in US yields across the curve.
In the German money market, yields of the 10-year benchmark bund also closed with losses after three daily advances in a row.
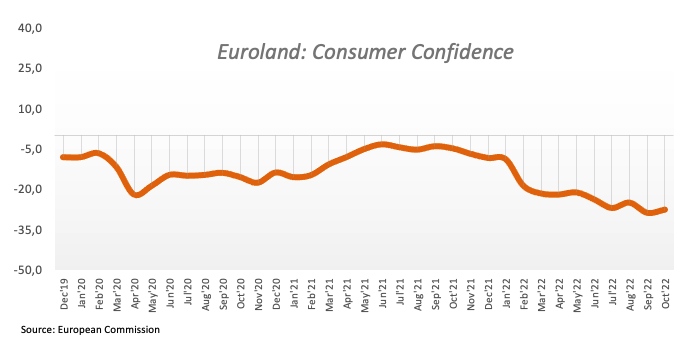
In the euro calendar, flash figures saw the European Commission’s Consumer Confidence “improved” to -27.6 for the month of October.
Across the pond, the Monthly Budget Statement deficit widened to $430B in what was the sole release in the US docket.
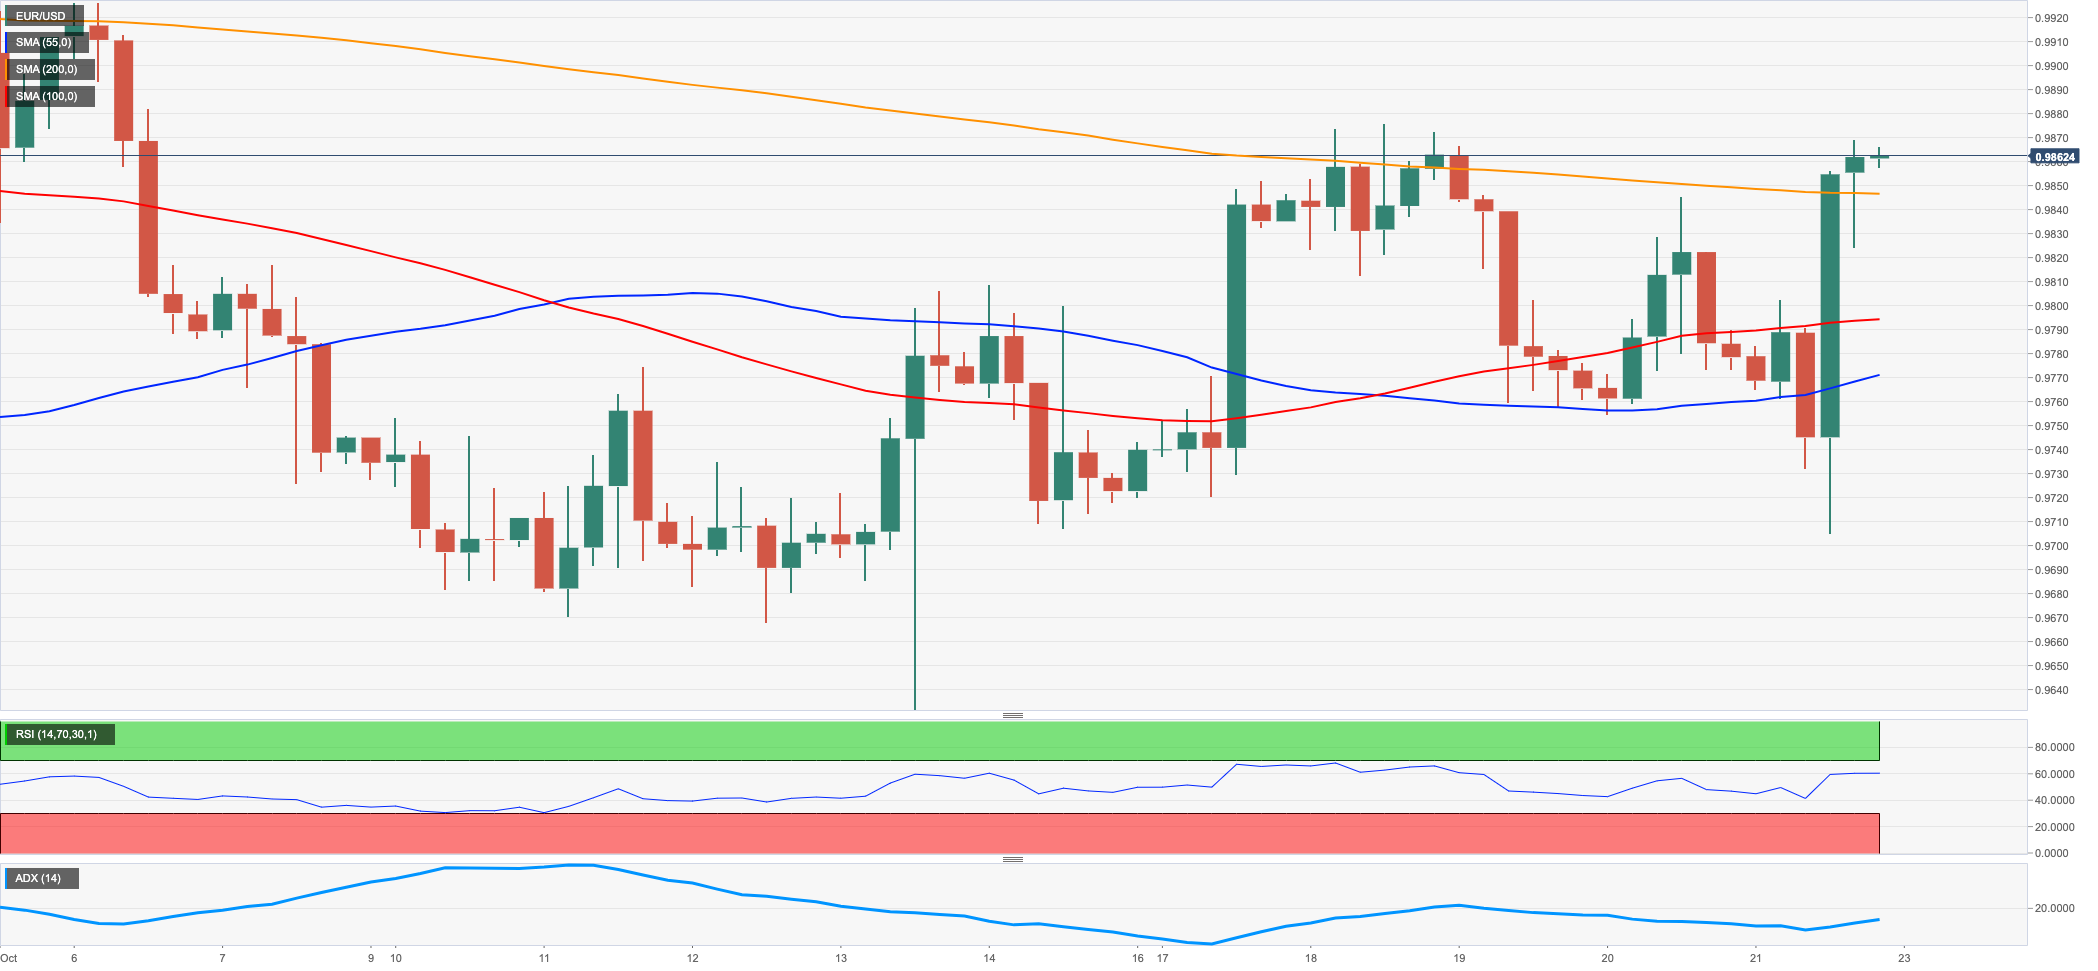
In case the upside bias gathers extra impulse, EUR/USD faces the next hurdle at the weekly top at 0.9875 (October 18) prior to the 55-day SMA at 0.9935 and the 8-month resistance line near 0.9950. The pair’s downside pressure should alleviate once this area is cleared, allowing for a potential test of the October peak at 0.9999 (October 4) ahead of the weekly high at 1.0050 (September 20). Further up turns up the interim 100-day SMA at 1.0114 seconded by the September top at 1.0197 (September 12). By contrast, the October low at 0.9631 (October 13) emerges as the initial support ahead of the 2022 low at 0.9535 (September 28). If breached, then the round level at 0.9500 should come to the fore prior to the weekly low at 0.9411 (June 17 2002). By contrast, The daily RSI edged higher and poked with 82.
Resistance levels: 0.9875 0.9926 0.9999 (4H chart)
Support levels: 0.9704 0.9631 0.9535 (4H chart)
USDJPY
USD/JPY climbed further and printed fresh 32-year highs in levels just pips away from the 152.00 mark during early trade on Friday.
However, another joint BoJ/MoF FX intervention abruptly dragged spot back to the vicinity of the 146.00 region and forced it to close with gains for the first time after twelve consecutive daily advances. In addition, the pair closed the week in the negative territory after nine straight weekly gains.
Further weakness hurt spot following speculation that the Fed could start discussing modifying the pace of the rate hikes at the December gathering.
Against the backdrop of the persistently widening monetary policy divergence between the BoJ and the Federal Reserve, the only factor that could motivate the pair to decelerate its pace should come from another BoJ/MoF FX intervention, although this could ultimately be fruitless in light of the unchanged monetary stance from the BoJ.
In the Japanese docket, the Inflation Rate held steady at 3.0% in the year to September, same as the Core Inflation Rate. In addition, the Inflation Rate Ex-Food and Energy rose 1.8% YoY.
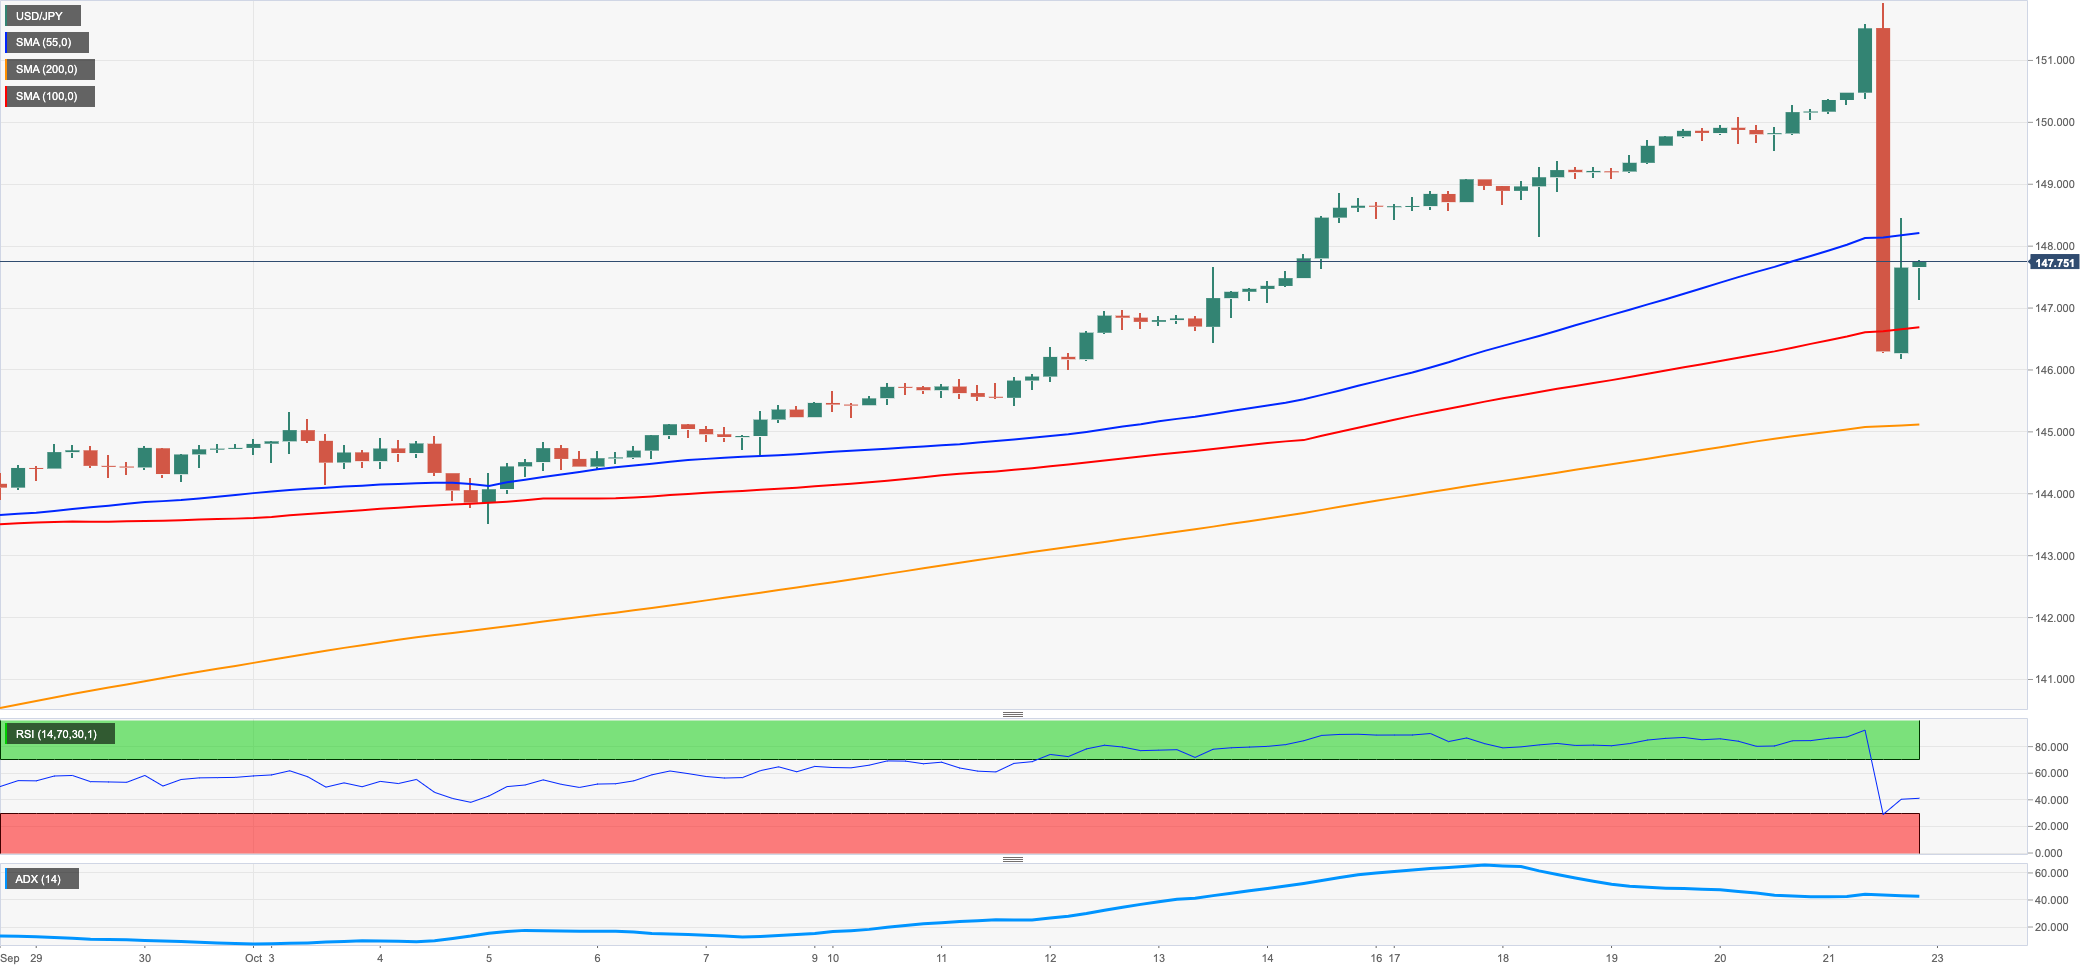
USD/JPY now sees the next target at the 2022 high at 151.94 (October 21) ahead of the June 1990 high at 155.80 (June 25). On the flip side, the weekly low at 148.11 (October 18) appears as the immediate contention ahead of the October low at 143.52 (October 5) and the post-intervention low at 140.34 (September 22). A deeper retracement could see the 100-day SMA at 138.96 revisited before the weekly low at 135.80 (August 23) and another weekly low at 131.73 (August 11). The daily RSI suddenly abandoned the overbought territory and sank to the 60 zone.
Resistance levels: 151.94 155.80 159.00 (4H chart)
Support levels: 146.18 145.42 145.09 (4H chart)
GBPUSD
Buyers returned to the Sterling and encouraged GBP/USD to reverse the initial deep pullback to the 1.1060 region, reclaiming at the same time the area beyond the 1.1300 yardstick at the end of the week.
Indeed, the sharp move lower in the dollar helped the quid to offset the almost omnipresent concerns around the UK political arena, particularly in the aftermath of the resignation of PM L.Truss on Thursday.
In the UK docket, Consumer Confidence tracked by Gfk bettered a tad to -47 in October (from -49). In addition, Public Sector Net Borrowing rose to £19.25B and headline Retail Sales contracted 6.9% in the year to September and 6.2% when excluding Fuel.
In the UK debt market, the 10-year gilt yields rose for the second consecutive session, this time past the 4.00% yardstick.
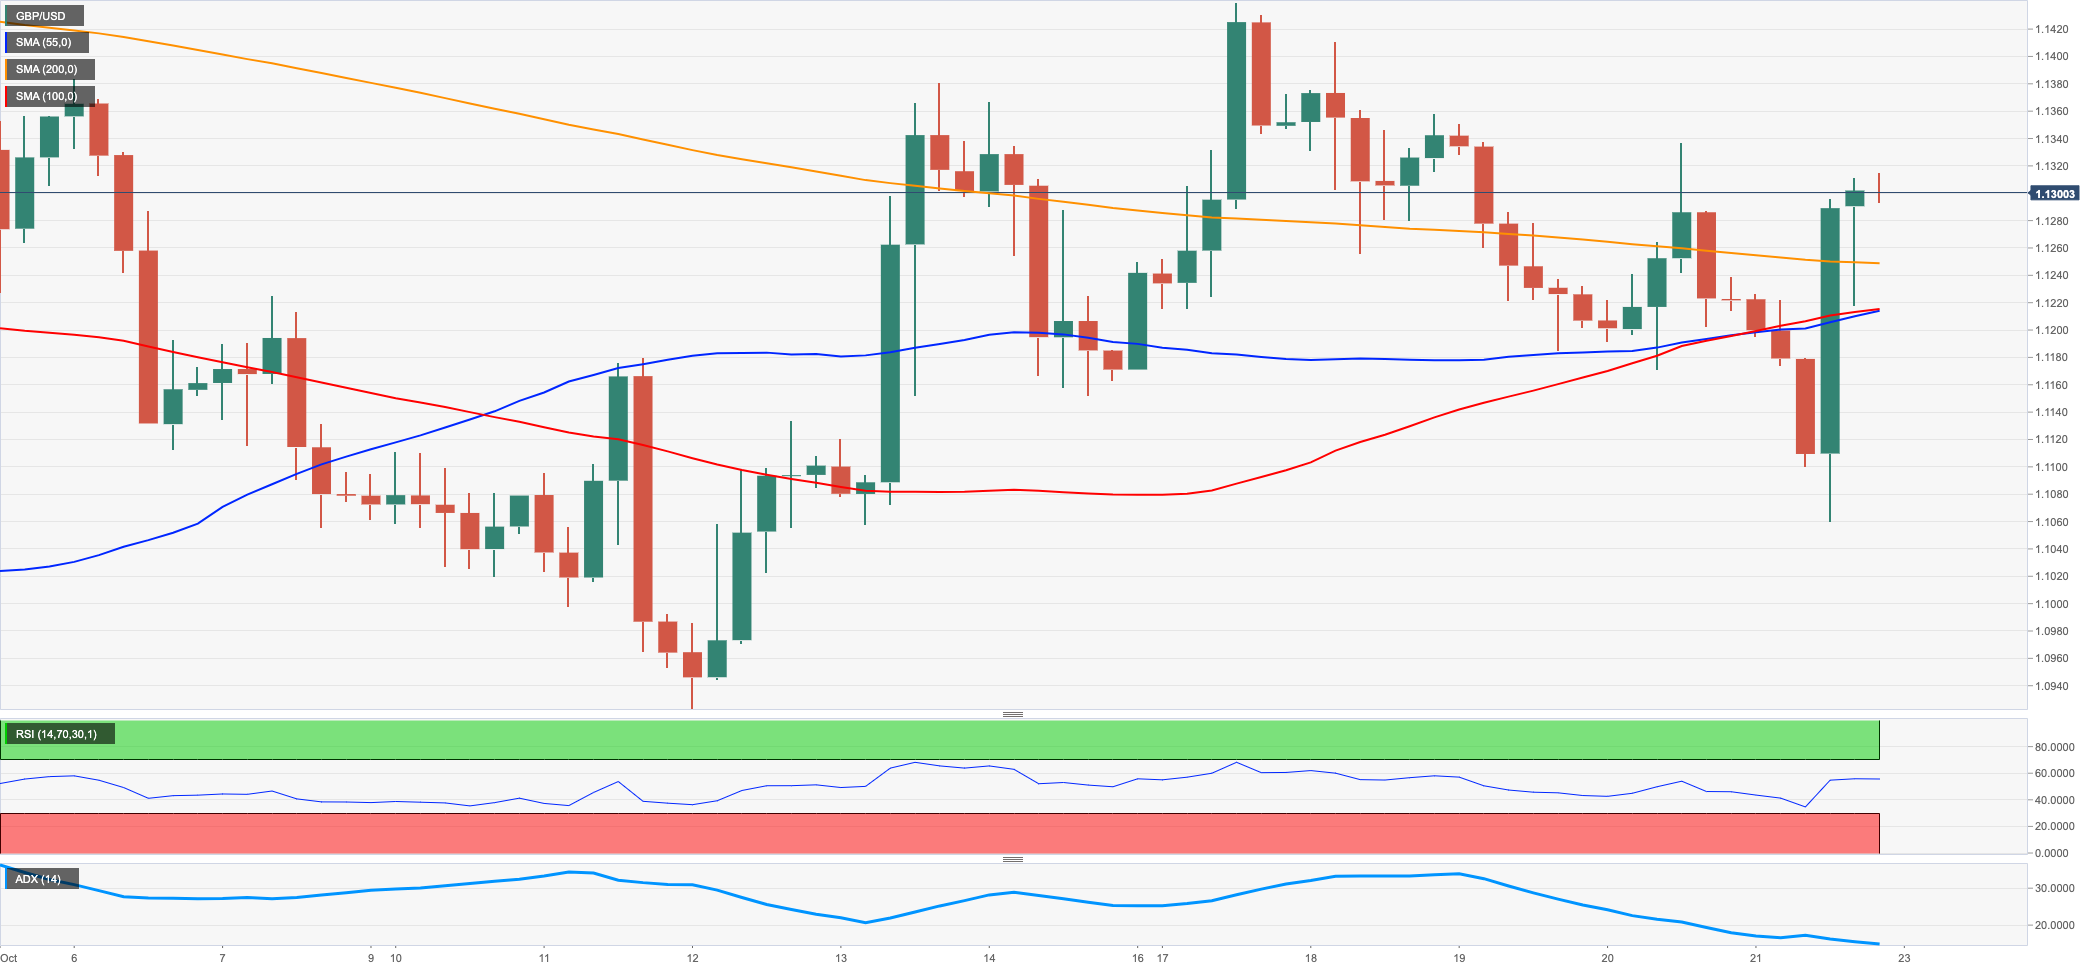
GBP/USD reversed the weekly retracement and now sets sails to the weekly peak at 1.1439 (October 17) just ahead of the 55-day SMA at 1.1490 and the October high at 1.1495 (October 5). The surpass of this level could put the September top at 1.1738 (September 13) back on the traders’ radar prior to the 100-day SMA at 1.1780 and the weekly peak at 1.1900 (August 26), which anticipates a visit to the psychological 1.2000 mark. Just the opposite, a drop below the weekly low at 1.1099 (October 21) could open the door to a deeper pullback to the October low at 1.0923 (October 12) ahead of the 1.0538 level (September 28) and the all-time low at 1.0356 (September 26). The daily RSI regained traction and reached 51.
Resistance levels: 1.1314 1.1336 1.1439 (4H chart)
Support levels: 1.1060 1.0923 1.0761 (4H chart)
AUDUSD
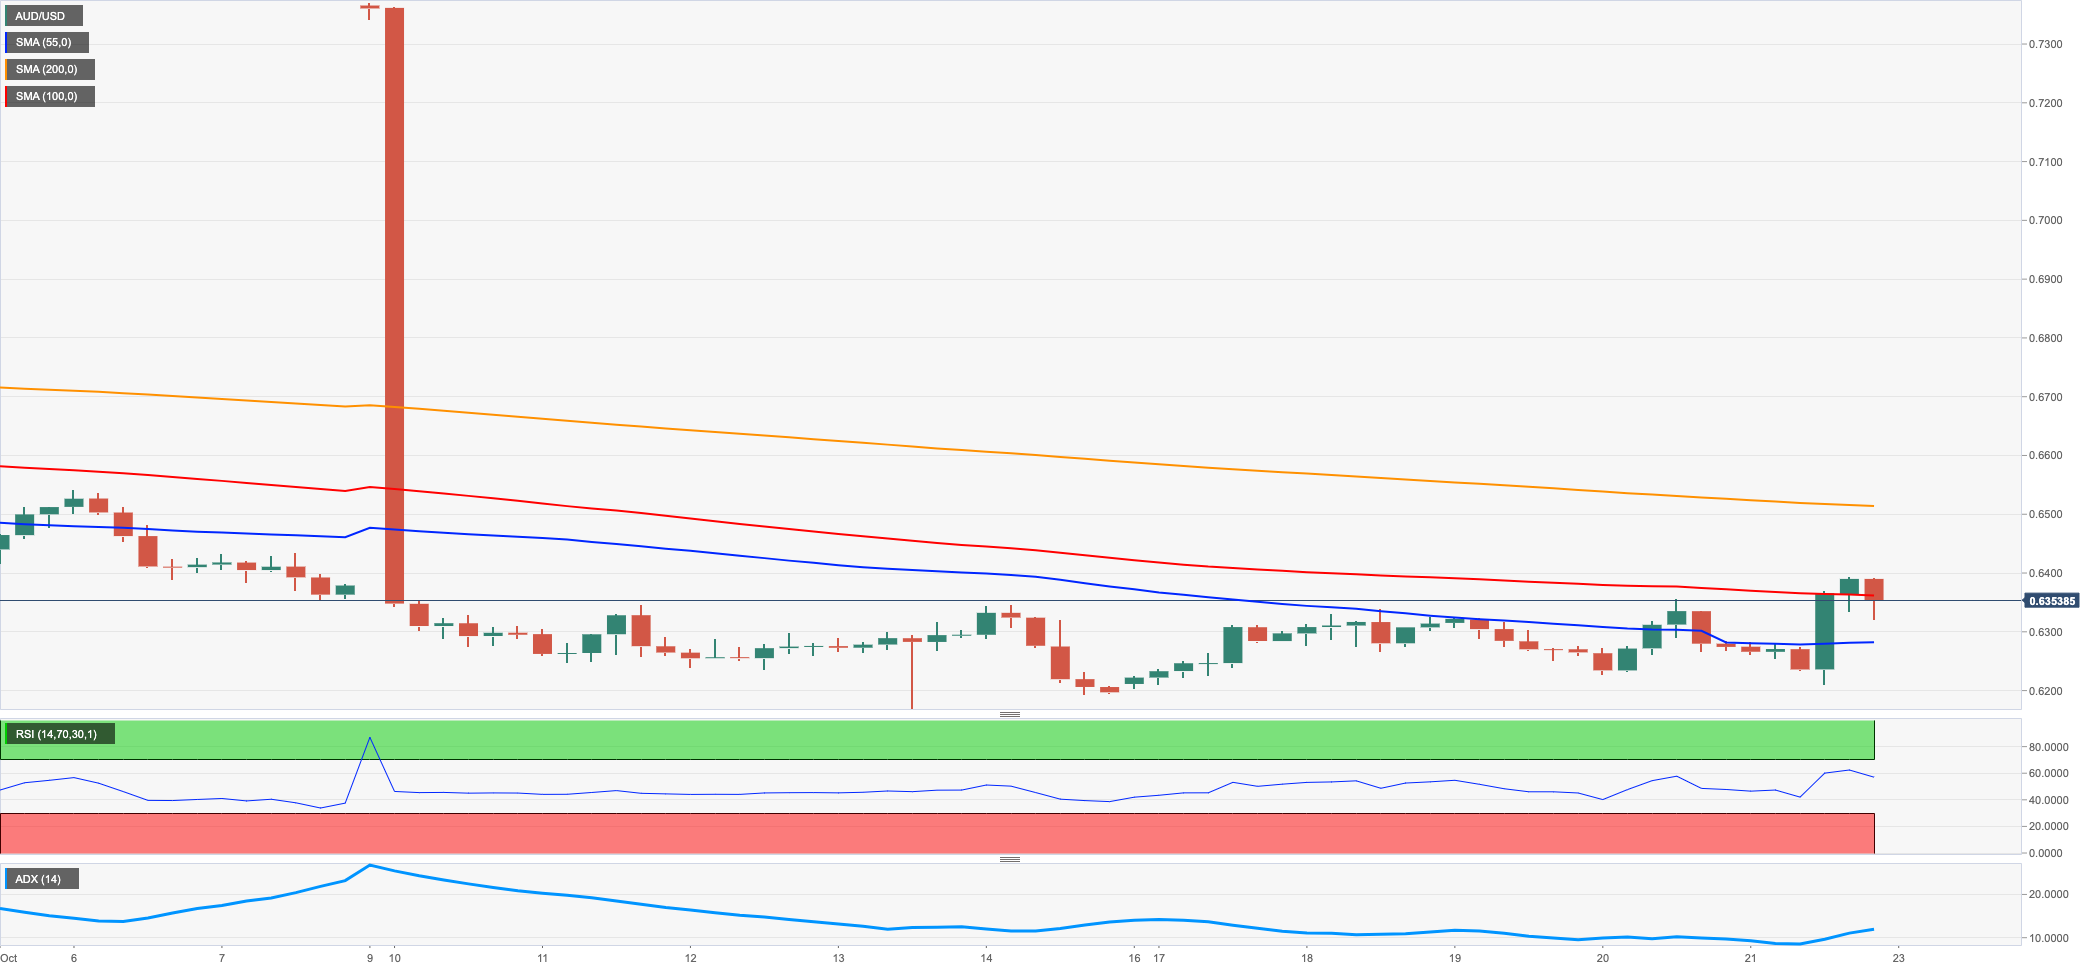
AUD/USD closed the week on a very upbeat tone and reached 2-week highs in the area just shy of the 0.6400 hurdle on Friday.
Indeed, the pair added to Thursday’s advance and reversed the initial pullback to the proximity of the 0.6200 neighbourhood on the back of the U-turn in the greenback in response to the BoJ/MoF intervention.
The mixed note in the commodity space saw copper prices rise for the second session in a row and the iron ore kept the range bound theme for yet another day, all collaborating with the optimism around the Aussie dollar.
The Australian docket remained empty on Friday.
AUD/USD rose sharply on Friday and now leaves the door open to further upside in the near term. Against that, the next hurdle of note emerges at the October peak at 0.6547 (October 3) prior to the 55- and 100-day SMAs at 0.6674 and 0.6786, respectively. The surpass of this area could pave the way for a visit to the September high at 0.6916 (September 13) ahead of the psychological 0.7000 yardstick. On the downside, the 2022 low at 0.6169 (October 13) appears as the immediate contention prior to the psychological 0.6000 yardstick and followed by the April 2020 low at 0.5980 (April 3). The daily RSI rebounded markedly and trespassed 45.
Resistance levels: 0.6392 0.6432 0.6540 (4H chart)
Support levels: 0.6210 0.6194 0.6169 (4H chart)
GOLD
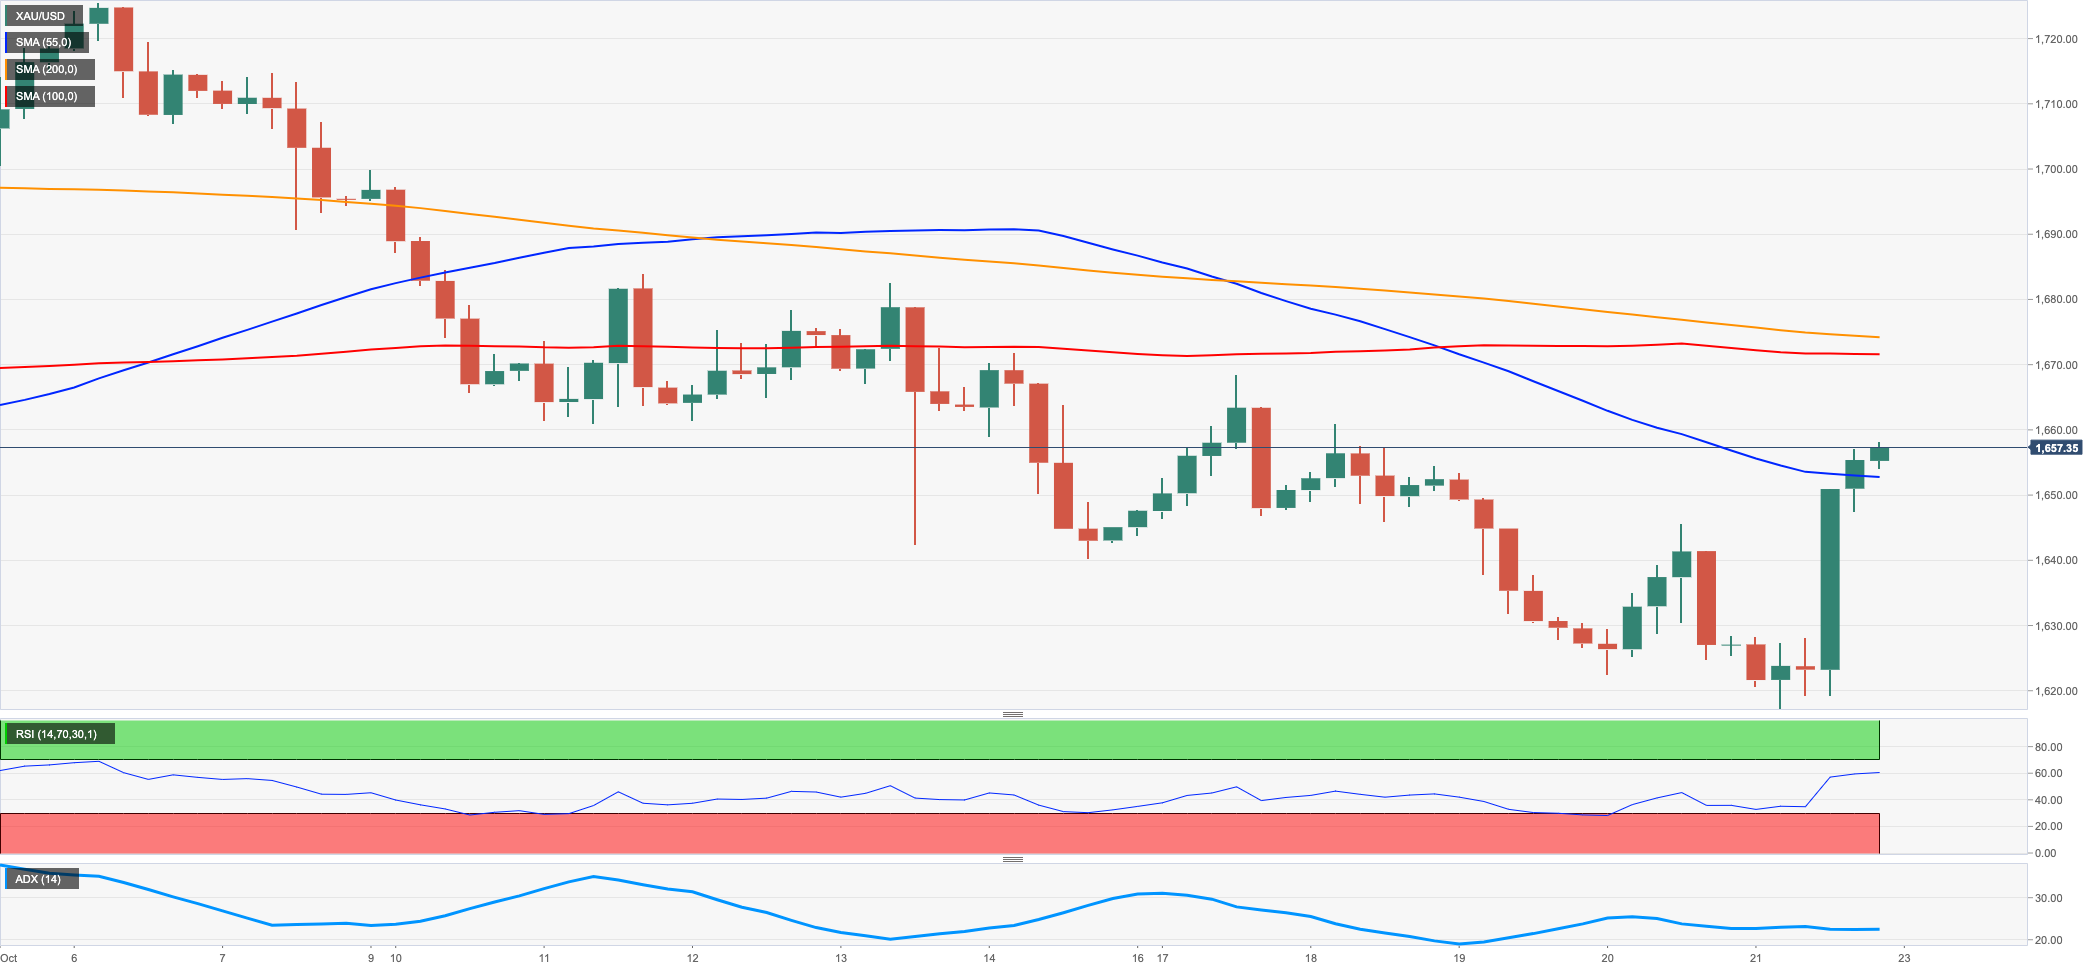
Gold prices advanced to 3-day peaks near the $1,660 level per ounce troy at the end of the week. In light of Friday’s gains, bullion managed to reverse the weekly leg lower and end with decent gains vs. the previous seven days.
The yellow metal reversed two straight sessions with losses on Friday on the back of the sharp BoJ-induced sell-off in the greenback, which left the USD Index (DXY) well immersed in the negative territory.
Further support for the precious metal also resurfaced after Fed’s rate-setters hinted at the possibility of smaller interest rate hikes in the next months, which eventually prompted yields in the 2y-10y tranche to give away daily gains.
Gold prices face a minor resistance at $1,682 (October 13) ahead of the interim 55-day SMA at $1,705 and the September top at $1,735 (September 12). North from here comes the 100-day SMA at $1,739 seconded by the $1,765 level (August 25), while the breakout of the latter could expose the critical $1,800 area before the August peak at $1,807 (August 10). Just the opposite, the next support of relevance turns up at the 2022 low at $1,614 (September 28) seconded by the round level at $1,600 and prior to the April 2020 low at $1,572 (April 1).
Resistance levels: $1,657 $1,668 $1,682 (4H chart)
Support levels: $1,617 $1,614 $1,572 (4H chart)
CRUDE WTI
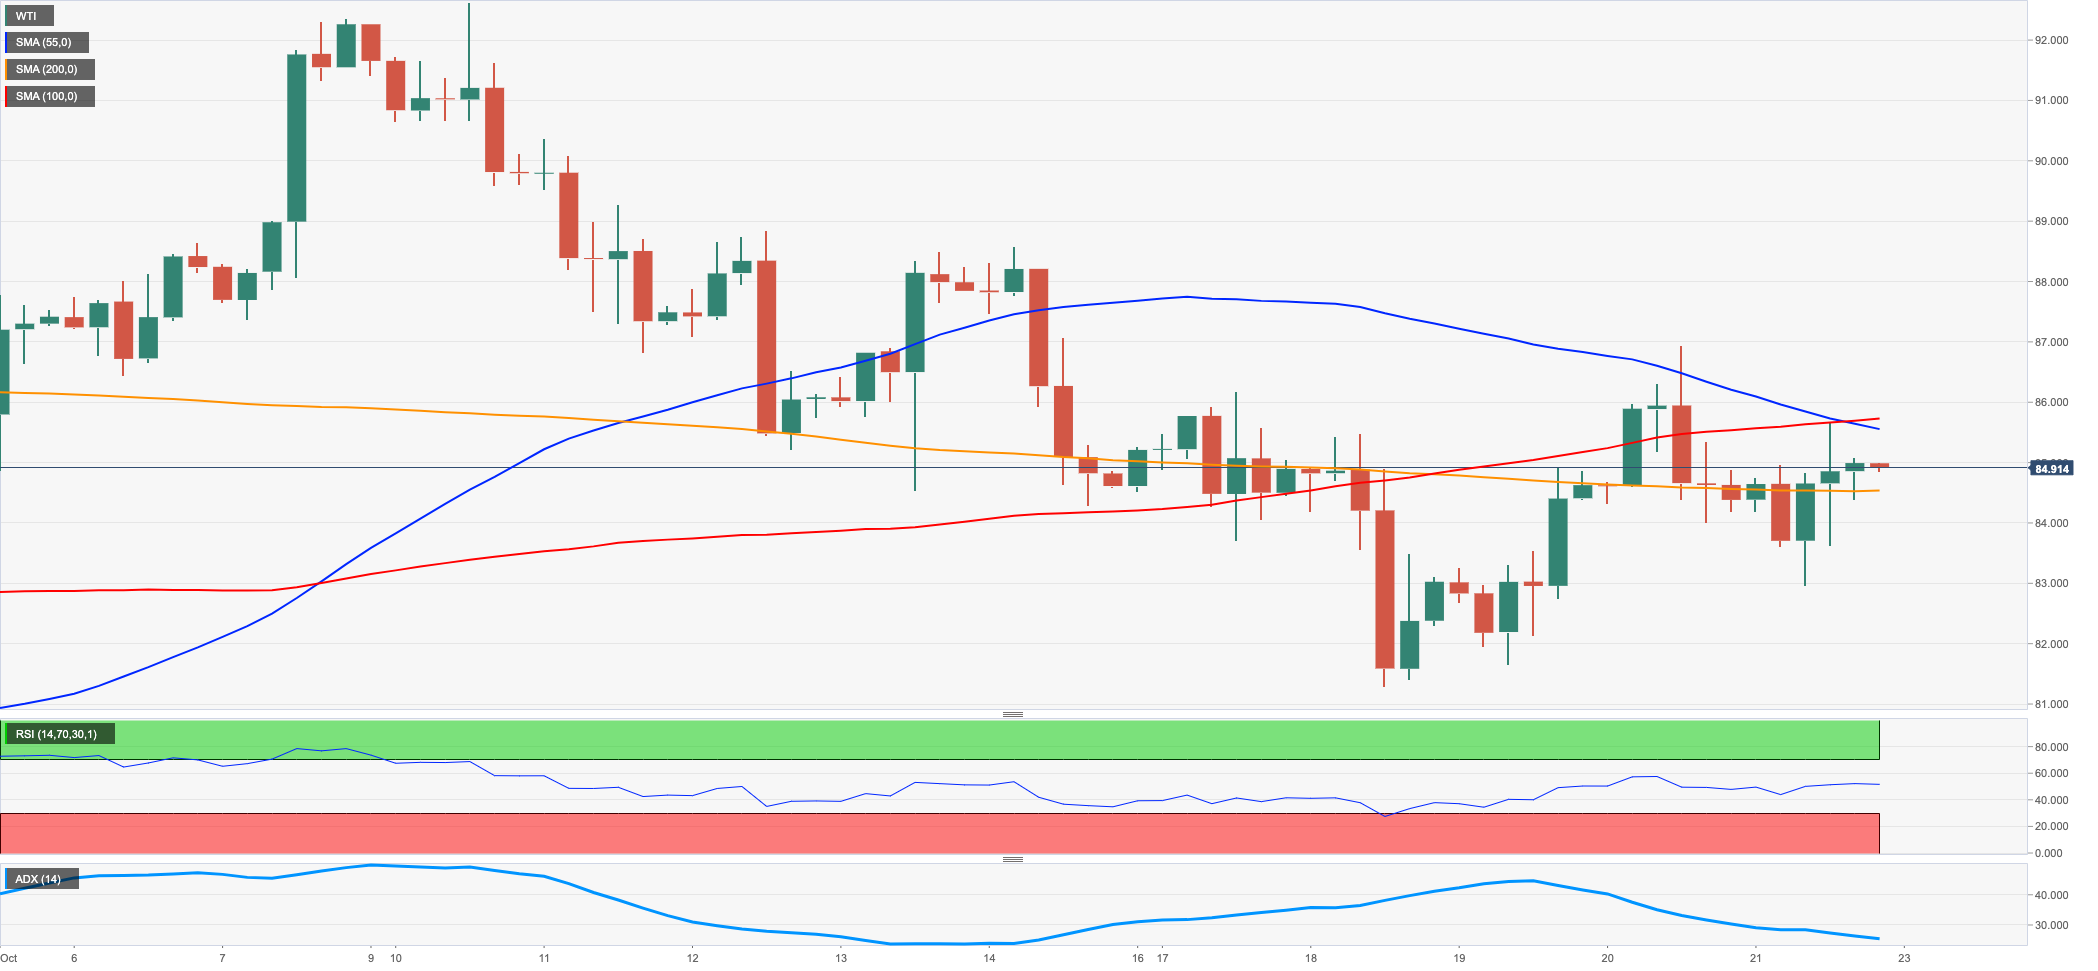
WTI prices charted humble gains on Friday, although they could not avoid the second consecutive weekly drop.
Crude oil practically ignored the late U-turn in the dollar and remained focused on demand concerns mainly stemming from China and the country’s ups and downs regarding COVID restrictions, the omnipresent tightness in the markets and news that Russian oil could bypass EU sanctions by finding fresh buyers.
In the docket, driller Baker Hughes said the oil rig count went up by 2 in the week to October 21, taking the total US active oil rigs to 612.
WTI keeps facing the next down barrier at the weekly low at $82.10 (October 18) prior to the key $80.00 mark per barrel. A deeper drop could pave the way for a move to the minor support at $79.16 (September 30) followed by the September low at $76.28 (September 26) and the 2022 low at $74.30 (January 3). In the opposite direction, there are no hurdles of note until the October top at $93.62 (October 10) ahead of the weekly high at $97.65 (August 30). North from here is expected the key 200-day SMA at $98.27, which precedes the psychological $100.00 mark.
Resistance levels: $85.88 $87.12 $89.72 (4H chart)
Support levels: $83.14 $82.06 $79.12 (4H chart)
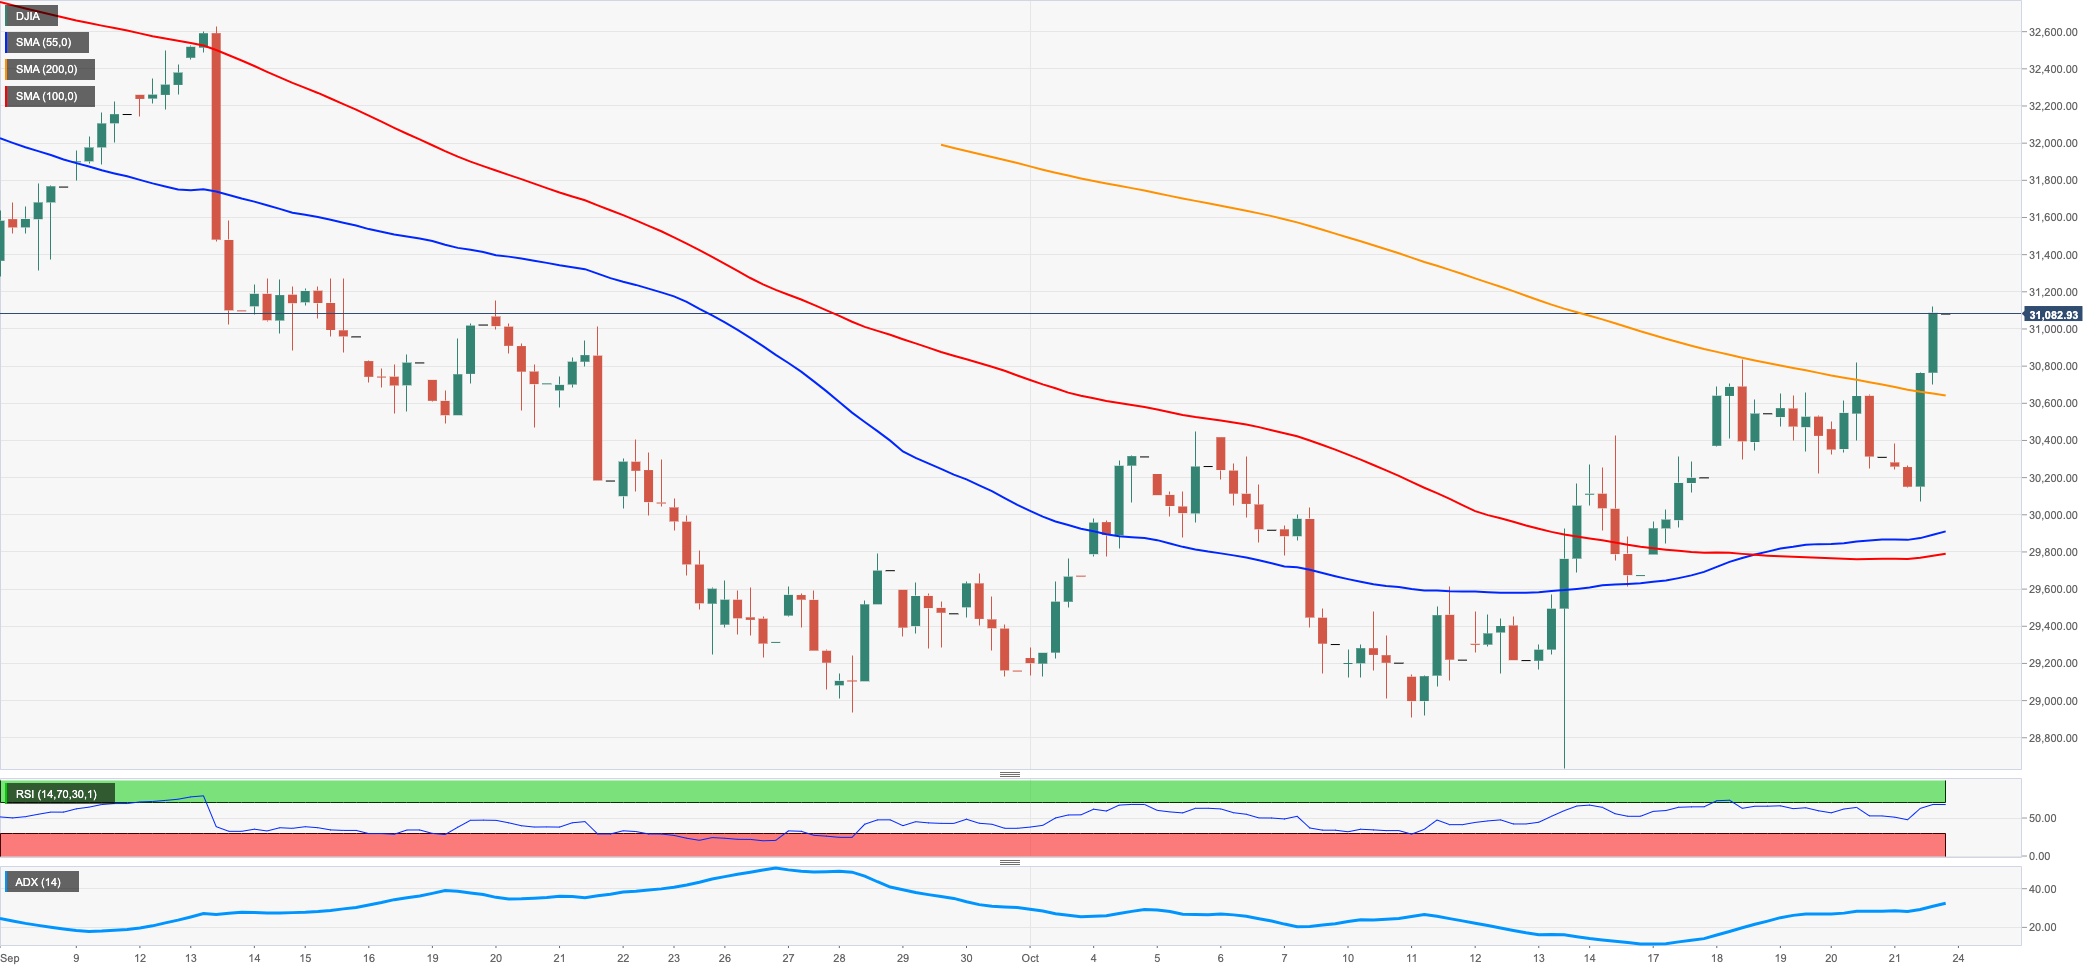
DOW JONES
US equities ended Friday’s session in new 5-week tops when tracked by the three major US stock indices.
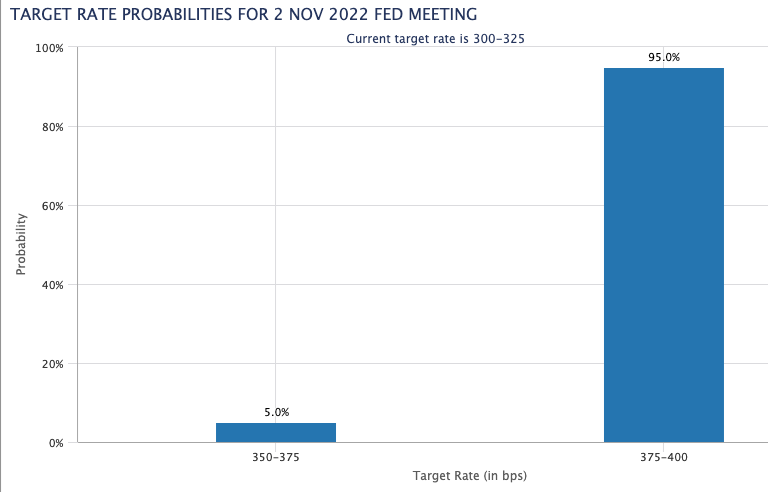
Indeed, the optimism among investors resurged after news cited that the Federal Reserve could start debating a slow pace of its normalization process as soon as at the December meeting, while a 75 bps rate hike in November is practically a done deal.
On the latter, the probability of a ¾ rate hike next month is at 95% according to CME Group’s FedWatch Tool.
Friday’s upside bias was also reinforced by the late strong drop in the dollar and losses in the 2-year and 10-year note yields.
All in all, the Dow Jones rose 2.47% to 31,082, the S&P500 gained 2.37% to 3,752 and the tech-benchmark Nasdaq Composite advanced 2.31% to 10,859.
Further upside in the Dow Jones now needs to clear the October high at 31,119 (October 21) to allow for the continuation of the recovery to the September top at 32,504 (September 12) ahead of the key 200-day SMA at 32,748 and the 33,364 level (August 26). On the contrary, the next support of relevance emerges at the 2022 low at 28,660 (October 13) before the October 2020 low at 26,143 (October 30). The daily RSI leapt beyond the 58 mark.
Top Performers: Caterpillar, JPMorgan, Goldman Sachs
Worst Performers: Verizon, American Express, IBM
Resistance levels: 31,119 31,434 32,504 (4H chart)
Support levels: 30,206 29,614 28,660 (4H chart)
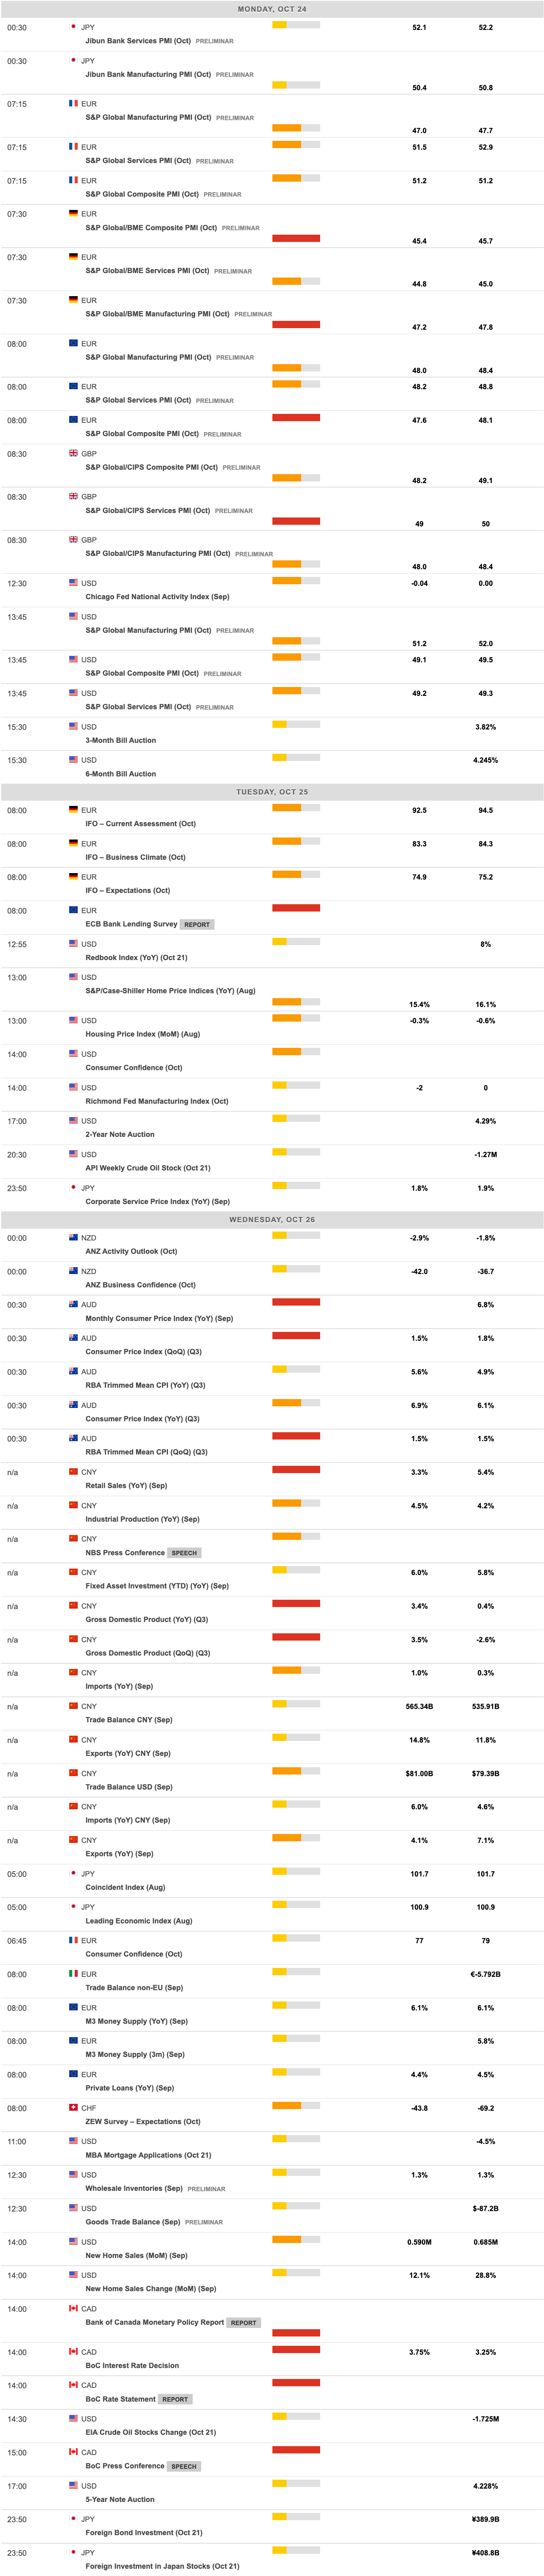
MACROECONOMIC EVENTS
All Information & Updates provided by:

All information relating to the financial markets available on this page has been prepared and issued by FXStreet (Forexstreet SL, Spain, Reg: B62498233) on the basis of publicly available information and all information believed to be reliable and does not conflict with Kuwaiti local laws, and all necessary care has been taken to before the company to ensure that the facts mentioned are correct from the source.
NCM Investment nor any of its directors or employees shall in any way be held responsible for the contents of this news, and the information contained on this page is intended only to provide clients with publicly available information and should not be construed as investment advice, report or analysis and/or constitute an offer or invitation to buy or sell financial instruments of any kind.
RISK WARNING: Forex and CFDs are highly risky leveraged products, as losses can exceed deposits. Please ensure you understand all the risks and take independent advice if necessary. NCM will segregate the clients based on the criteria of the regulator and its bylaws. NCM does not provide any advisory service; the material published does not constitute advice or a recommendation for a transaction in any financial instrument. NCM accepts no responsibility for any use of the content presented and any consequences of that use. Anyone acting on the information provided does so at their own risk.