
- Contact Us:
-

-

-

-


Daily Market Updates
25 Oct 2022
EURUSD
After faltering just ahead of the 0.9900 mark at the beginning of the week, EUR/USD sparked a corrective downside to the boundaries of the 0.9800 neighbourhood, where sellers seem to have met quite decent resistance for the time being. The pair, however, managed to stage a moderate comeback following the PMI-led corrective decline in the buck, revisiting the 0.9870/80 band.
The greenback, on the opposite side of the road, started the week in a positive fashion and left behind the pessimism seen in the second half of the last week, managing to reclaim the area beyond the 112.00 mark when tracked by the USD Index (DXY).
The resumption of the buying interest in the greenback came on the back of a small advance in US yields, while the German 10-year benchmark yields dropped for the second session in a row.
EUR/USD, in the meantime, is expected to face some volatile hours ahead of the ECB event on October 27, where consensus among investors remains largely tilted towards a ¾ point rate raise.
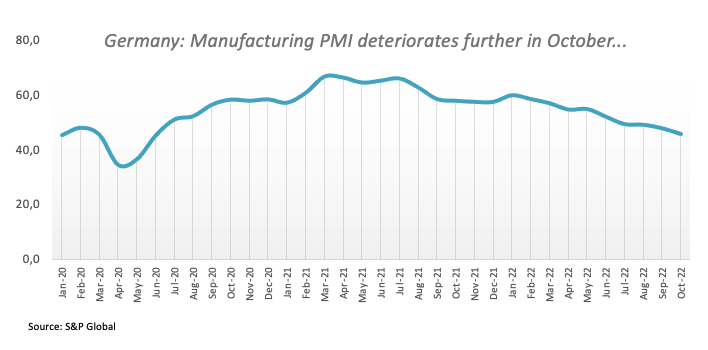
In the domestic docket, flash Manufacturing PMIs are expected to remain in the contraction territory in October, as per readings from France (47.4), Germany (45.7) and the broader Euroland (46.6).
In the US data sphere, the advanced Manufacturing PMI is seen at 49.9 in October and 46.6 when it comes to the Services gauge. In addition, the Chicago Fed National Activity Index held steady at 0.1 in September.
The surpass of the weekly top at 0.9899 (October 24) should prompt EUR/USD to retarget the 55-day SMA at 0.9928 ahead of the 8-month resistance line in the 0.9950/45 band. Once cleared, the pair could then attempt a move to the October high at 0.9999 (October 4) prior to the weekly top at 1.0050 (September 20). North from here emerges the temporary 100-day SMA at 1.0106 ahead of the September top at 1.0197 (September 12). On the flip side, initial contention appears at the weekly low at 0.9704 (October 21) ahead of the October low at 0.9631 (October 13). The breakdown of the latter could open the door to the 2022 low at 0.9535 (September 28) ahead of the round level at 0.9500 and the weekly low at 0.9411 (June 17 2002). The daily RSI gained ground and surpassed the 52 level.
Resistance levels: 0.9899 0.9926 0.9999 (4H chart)
Support levels: 0.9806 0.9704 0.9631 (4H chart)
-638022334903229210.png)
USDJPY
USD/JPY managed to reverse the earlier drop to the mid-145.00s and later embarked on a strong recovery that revisited levels well north of the 149.00 barrier on Monday.
Indeed, spot resumed the rally on the back of the tepid recovery in the dollar and the resumption of the upside pressure in US yields across the curve, while market participants appear to have already digested Friday’s second round of the joint FX intervention by the BoJ/MoF.
In Japan, flash readings saw the Jibun Bank Manufacturing PMI at 50.7 in October (from 50.8) and the Jibun Bank Services PMI at 53.0 (from 52.2).
The resumption of the uptrend in USD/JPY is expected to keep the focus on the 2022 top at 151.94 (October 21) prior to the June 1990 peak at 155.80 (June 25). By contrast, the weekly low at 145.48 (October 24) should offer initial support prior to the October low at 143.52 (October 5) and the weekly low at 140.34 (September 22). Further losses could retest the 100-day SMA at 139.13 ahead of the weekly low at 135.80 (August 23) and another weekly low at 131.73 (August 11). The daily RSI ticked higher and broke above 65.
Resistance levels: 149.71 151.94 155.80 (4H chart)
Support levels: 145.4 143.52 140.34 (4H chart)
-638022335722056623.png)
GBPUSD
GBP/USD alternated gains with losses around the 1.1300 region following an unsuccessful attempt to sustain the move further north of the 1.1400 barrier earlier in the session on Monday.
The better tone in the sterling came despite the rebound in the dollar and followed renewed optimism among investors sparked after former Chancellor R.Sunak will be the next UK Primer Minister. Sunak got public endorsements from more than half of the Tory party members.
In the UK calendar, preliminary figures see the Services PMI at 47.5 in October and the Manufacturing PMI at 45.8.
GBP/USD poked once again with the area of recent peaks and further gains could revisit the weekly high at 1.1439 (October 17) prior to the 55-day SMA at 1.1476 and just ahead of the October top at 1.1495 (October 5). Further north emerges the September peak at 1.1738 (September 13) before the 100-day SMA at 1.1768 and the weekly high at 1.1900 (August 26). Beyond the latter, a probable test of the psychological 1.2000 mark could start shaping up. On the contrary, the weekly low at 1.1059 (October 21) should hold the initial bearish attempt seconded by the October low at 1.0923 (October 12). South from here appears the 1.0538 level (September 28) followed by the all-time low at 1.0356 (September 26). The daily RSI eased marginally to the vicinity of 50.
Resistance levels: 1.1407 1.1439 1.1495 (4H chart)
Support levels: 1.1059 1.0923 1.0761 (4H chart)
-638022335343344961.png)
AUDUSD
AUD/USD tumbled strongly despite the dollar gave away all its gains at the beginning of the week.
Indeed, the offered stance in the Aussie dollar picked up pace following mixed results from the Chinese calendar, while below-expectations results from Australian PMIs also collaborated with the selling mood around spot.
Additionally, the mixed performance of the commodity space did not help the AUD either, with copper prices dropping modestly and iron ore prices extending the lacklustre price action.
Back to the Aussie docket, preliminary readings saw the Manufacturing PMI easing to 52.8 in October and the Services PMI entering the contraction territory at 49.
AUD/USD now faces the next up barrier at the weekly peak at 0.6411 (October 24) prior to the October high at 0.6547 (October 3) and the 55- and 100-day SMAs at 0.6662 and 0.6778, respectively. If the pair clears this region, it could then put the September top at 0.6916 (September 13) back on the investors’ radar ahead of the psychological 0.7000 mark. On the flip side, the breach of the 2022 low at 0.6169 (October 13) could pave the way for a move to the psychological 0.6000 level prior to the April 2020 low at 0.5980 (April 3). The daily RSI shed ground and dropped below the 41 yardstick.
Resistance levels: 0.6411 0.6432 0.6540 (4H chart)
Support levels: 0.6272 0.6210 0.6194 (4H chart)
-638022336039671541.png)
GOLD
The resumption of the bid bias in the greenback in combination with higher US yields across the curve put the yellow metal under pressure and forced it to abandon the area of early peaks around $1,670 per ounce troy.
In fact, bullion partially trimmed Friday’s strong corrective upside, as the greenback recouped ground lost in the wake of another coordinated BoJ/MoF intervention in the FX markets.
The so far weekly high at $1,670 (October 24) now appears as the next up barrier of relevance for gold ahead of the minor resistance at $1,682 (October 13). The breakout of this region exposes a move to the temporary 55-day SMA at $1,702 ahead of the September top at $1,735 (September 12) and the 100-day SMA at $1,737. In case bulls push harder, then the $1,765 level (August 25) could emerge on the horizon prior to the critical $1,800 area and the August peak at $1,807 (August 10). In the opposite direction, there are no support levels of significance until the 2022 low at $1,614 (September 28) followed by the round level at $1,600 and ahead of the April 2020 low at $1,572 (April 1).
Resistance levels: $1,670 $1,684 $1,713 (4H chart)
Support levels: $1,644 $1,617 $1,614 (4H chart)
-638022336413233255.png)
CRUDE WTI
Prices of the barrel of the West Texas Intermediate (WTI) charted a directionless session at the beginning of the week.
Indeed, the commodity gyrated around the $85.00 mark per barrel against the backdrop of the stronger dollar, mixed date results from the Chinese docket and demand for crude oil and further loss of momentum in US fundamentals.
On the latter, speculation that the Fed might start mulling the idea of reducing the pace of the interest rate hikes in the next few months appears to have lent some optimism to traders.
WTI seems to have moved into a consolidative phase for the time being. The breakdown of the weekly low at $82.10 (October 18) should leave the commodity vulnerable to a potential test of the key $80.00 mark per barrel before the minor support at $79.16 (September 30). South from here lies the September low at $76.28 (September 26) ahead of the 2022 low at $74.30 (January 3). To the contrary, the October peak at $93.62 (October 10) emerges as the next up barrier of significance prior to the weekly top at $97.65 (August 30). The surpass of this region exposes the key 200-day SMA at $98.27, just before the psychological $100.00 mark.
Resistance levels: $85.88 $87.12 $89.72 (4H chart)
Support levels: $82.62 $82.06 $79.12 (4H chart)
-638022337188945760.png)
DOW JONES
The lower-than-expected results from US flash PMIs reignited investors’ speculation that the Federal Reserve could think twice before implementing extra jumbo rate hikes in the upcoming months, as manufacturing morale/activity seems to be losing further momentum.
That said, equities added to Friday’s gains and started the new trading week in an auspicious note and climbing to fresh multi-week highs when tracked by the three major US stock indices.
Against that, the Dow Jones gained 1.19% to 31,457, the S&P500 advanced 0.95% to 3,788 and the tech-heavy Nasdaq Composite rose 0.37% to 10,900.
Next on the upside for the Dow Jones now emerges the September peak at 32,504 (September 12) prior to the key 200-day SMA at 32,724 and the 33,364 level (August 26). On the downside, the 30,206 level (October 21) should offer initial contention ahead of the 2022 low at 28,660 (October 13) and the October 2020 low at 26,143 (October 30). The daily RSI extend the rebound past 61.
Top Performers: Amgen, Home Depot, Walmart
Worst Performers: Walt Disney, Chevron, Nike
Resistance levels: 31,570 32,504 33,364 (4H chart)
Support levels: 30,206 29,614 28,660 (4H chart)
-638022337523945442.png)
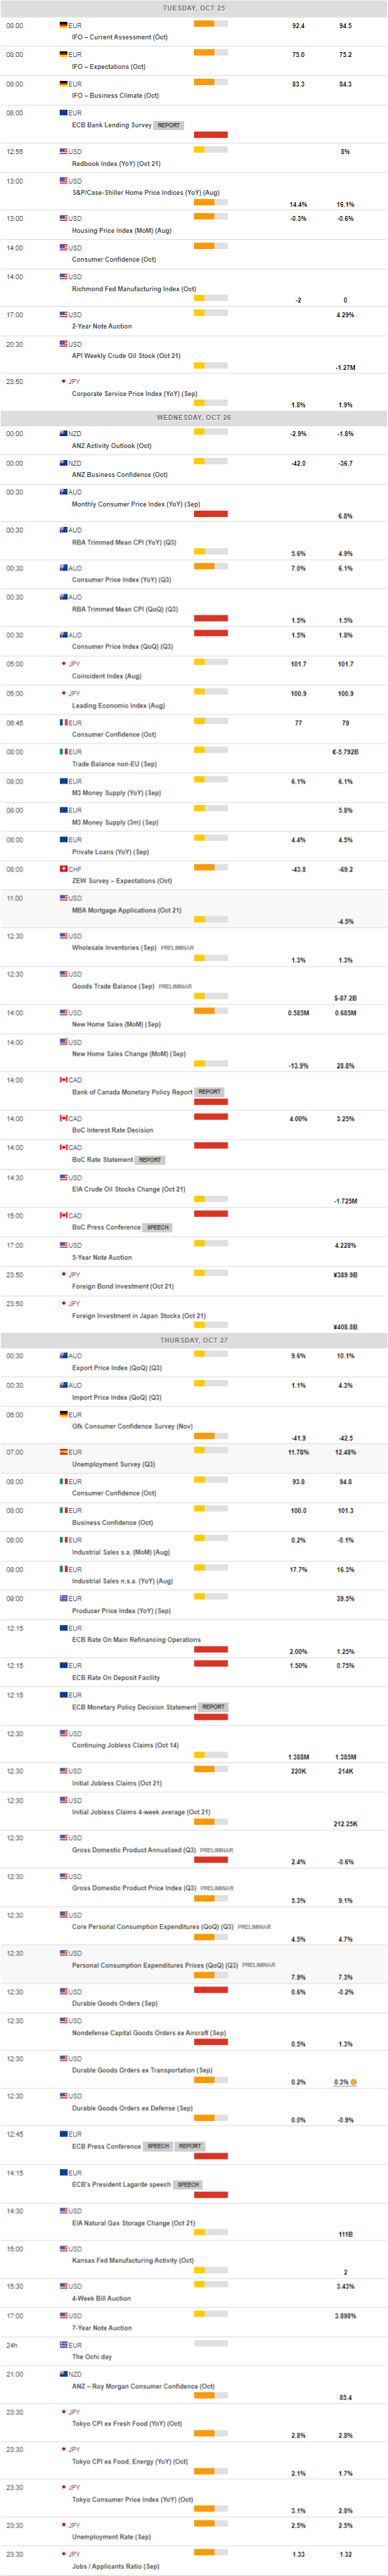
MACROECONOMIC EVENTS
All Information & Updates provided by:

All information relating to the financial markets available on this page has been prepared and issued by FXStreet (Forexstreet SL, Spain, Reg: B62498233) on the basis of publicly available information and all information believed to be reliable and does not conflict with Kuwaiti local laws, and all necessary care has been taken to before the company to ensure that the facts mentioned are correct from the source.
NCM Investment nor any of its directors or employees shall in any way be held responsible for the contents of this news, and the information contained on this page is intended only to provide clients with publicly available information and should not be construed as investment advice, report or analysis and/or constitute an offer or invitation to buy or sell financial instruments of any kind.
RISK WARNING: Forex and CFDs are highly risky leveraged products, as losses can exceed deposits. Please ensure you understand all the risks and take independent advice if necessary. NCM will segregate the clients based on the criteria of the regulator and its bylaws. NCM does not provide any advisory service; the material published does not constitute advice or a recommendation for a transaction in any financial instrument. NCM accepts no responsibility for any use of the content presented and any consequences of that use. Anyone acting on the information provided does so at their own risk.