
- Contact Us:
-

-

-

-


Daily Market Updates
26 Oct 2022
EURUSD
The marked drop in the dollar allowed EUR/USD to quickly leave behind the key hurdle at the 0.9900 barrier with certain conviction on turnaround Tuesday, opening the door at the same time to the continuation of the upside momentum in the short-term horizon as well as a probable test of the psychological parity level.
Indeed, the sell-off in the greenback was accompanied by a marked knee-jerk in US yields, with the short end and the belly of the curve retreating to new multi-session lows around 4.40% and 4.05%, respectively. In fact, markets’ repricing of the potential moves by the Fed regarding rate hikes (pivot?) seems to have weighed on the buck and sponsored the sharp move lower in DXY.
The positive price action encouraged spot to trespass the key 8-month resistance line, which is now expected to alleviate the downside pressure and allow for further gains in the near term.
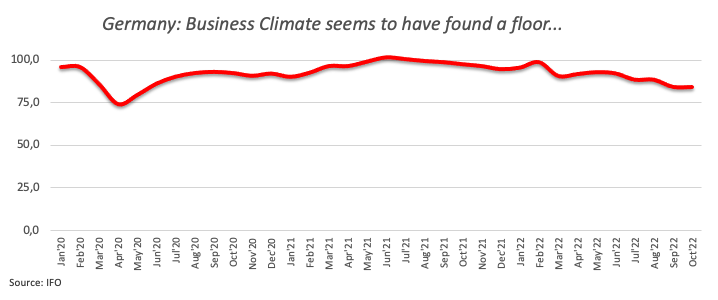
In the domestic calendar, the German Business Climate measured by the IFO institute came almost unchanged at 84.3 for the month of October, although it surpasses initial expectations.
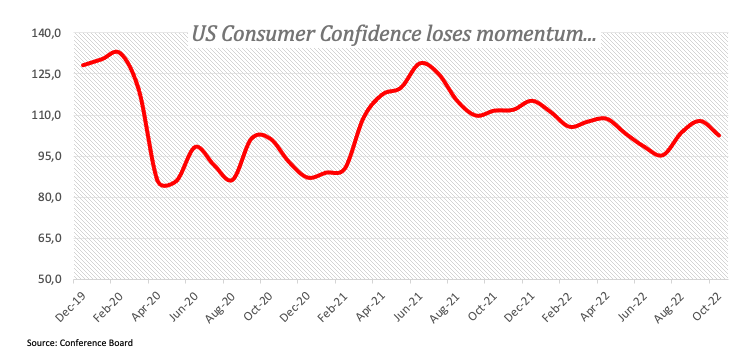
In the US, the FHFA’s House Price Index contracted at a monthly 0.7% in August and the key Consumer Confidence gauged by the Conference Board deflated to 102.5 in October (from 107.8).
EUR/USD trespassed the key 8-month resistance line and by doing so it has opened the door to extra gains in the near term. That said, the next hurdle of note comes at the October top at 0.9999 (October 4) ahead of the weekly peak at 1.0050 (September 20). Beyond the latter lines up the interim 100-day SMA at 1.0099 prior to the September high at 1.0197 (September 12). On the contrary, the weekly low at 0.9704 (October 21) is expected to hold the downside before the October low at 0.9631 (October 13). South from here appears the 2022 low at 0.9535 (September 28) seconded by the round level at 0.9500 and the weekly low at 0.9411 (June 17 2002). The daily RSI climbed to the area above 58.
Resistance levels: 0.9976 0.9999 1.0050 (4H chart)
Support levels: 0.9848 0.9806 0.9704 (4H chart)
-638023189139541735.png)
USDJPY
The corrective move in the dollar and US yields sponsored the daily pullback in USD/JPY to the mid-147.00s, where it seems to have met some initial contention.
Indeed, the greenback gave away further ground as investors continued to assess the possibility that a Fed’s pivot could be shaping up in light of the renewed weakness seen in key US fundamentals as of late (flash PMIs, housing data, consumer confidence).
Noting scheduled data wise in Japan on Tuesday left all the attention to the publication of the final figures of the Coincident Index and the Leading Economic Index for the month of August, both due on Wednesday.
Next on the upside in USD/JPY still emerges the 2022 peak at 151.94 (October 21) ahead of the June 1990 high at 155.80 (June 25). Inversely, there is an initial support at the weekly low at 145.48 (October 24) ahead of the October low at 143.52 (October 5) and another weekly low at 140.34 (September 22). The breach of the latter could open the door to the 100-day SMA at 139.28 before the weekly low at 135.80 (August 23) and another weekly low at 131.73 (August 11). The daily RSI lost momentum and breached the 60 yardstick.
Resistance levels: 149.71 151.94 155.80 (4H chart)
Support levels: 147.52 145.48 143.52 (4H chart)
-638023190186736453.png)
GBPUSD
GBP/USD gathered extra steam and reached fresh 6-week highs in the area just pips shy of 1.1500 the figure on Tuesday.
The sharp retracement in the greenback lent fresh oxygen to the risk complex and boosted the optimism around the sterling, which remained benefited by the respite in the political scenario following the appointment of R.Sunak to UK Prime Minister.
Around the BoE, recent polls suggested a 75 bps rate hike at the November event, while rates could peak around 4.25% at some point in Q1 2023.
There will be no relevant releases in the UK docket this week.
GBP/USD charted a new October peak at 1.1498 earlier in the session. Further up aligns the September high at 1.1738 (September 13) ahead of the 100-day SMA at 1.1757. If cable surpasses the latter, it could put the weekly top at 1.1900 (August 26) back on the investors’ radar before the psychological 1.2000 mark. On the flip side, there is initial contention at the weekly low at 1.1059 (October 21) ahead of the October low at 1.0923 (October 12) and the 1.0538 level (September 28). The daily RSI picked up pace and trespassed 57.
Resistance levels: 1.1498 1.1589 1.1738 (4H chart)
Support levels: 1.1257 1.1059 1.0923 (4H chart)
-638023189873654791.png)
AUDUSD
AUD/USD briefly visited the area just above the 0.6400 hurdle on Tuesday, leaving behind Monday’s downtick and always fuelled by the steep drop in the greenback and the corrective decline in US yields.
The improvement in spot came despite the negative performance in the commodity space, where copper prices extended the bearishness seen on Monday and prices of the iron ore slipped back below the $94.00 mark per tonne.
The positive mood in AUD also came in line with the marked pullback in the 10-year AGB yields, which fell in line with the rest of their global peers.
The next release of note in the Aussie dollar will be Wednesday’s publication of the Inflation Rate in Q3.
Further upside in AUD/USD should meet the next up barrier at the weekly high at 0.6411 (October 24) ahead of the October top at 0.6547 (October 3) and the 55- and 100-day SMAs at 0.6652 and 0.6769, respectively. North from here turns up the September peak at 0.6916 (September 13) prior to the psychological 0.7000 yardstick. On the downside, the breakdown of the 2022 low at 0.6169 (October 13) could prompt the psychological 0.6000 level to emerge on the horizon ahead of the April 2020 low at 0.5980 (April 3). The daily RSI advanced further and flirted with 48.
Resistance levels: 0.6412 0.6493 0.6547 (4H chart)
Support levels: 0.6272 0.6210 0.6194 (4H chart)
-638023190507421221.png)
GOLD
Prices of the ounce troy of the precious metal edged higher and partially regained ground lost at the beginning of the week on the back of the sharp correction lower in the dollar and the pronounced decline in US yields.
Indeed, yields and the greenback suffered the investors’ repricing of the potential pivot in the Fed’s normalization process in response to the loss of momentum in some key US fundamentals.
While a 75 bps rate hike by the Fed appears largely anticipated at the November 2 meeting, the idea that rate-setters could debate the continuation of the current rate path in December seems to have poured cold water over the bullish prospects for the dollar.
Gold faces the immediate up barrier at the so far weekly top at $1,670 (October 24) prior to the minor level at $1,682 (October 13). Further up comes the interim 55-day SMA at $1,699 before the September peak at $1,735 (September 12), an area also coincident with the 100-day SMA. Extra gains from here could see the $1,765 level (August 25) revisited ahead of the critical $1,800 zone and the August high at $1,807 (August 10). Contrarily, the 2022 low at $1,614 (September 28) emerges as the next support of note before the round level at $1,600 and prior to the April 2020 low at $1,572 (April 1).
Resistance levels: $1,670 $1,684 $1,713 (4H chart)
Support levels: $1,638 $1,617 $1,614 (4H chart)
-638023190787546340.png)
CRUDE WTI
WTI prices advanced marginally on Tuesday, although prices remained within the recent multi-session consolidative theme so far capped by the $88.00 mark per barrel.
Supply jitters in combination with the sour sentiment around the greenback this time seem to have done the rounds in the commodity, keeping prices in the positive side of the trade.
However, the likeliness of a global slowdown and its direct impact on the demand for crude oil continues to be the Damocles sword hanging over every serious recovery attempt in prices of the WTI for the time being.
Later in the NA session, the API will publish its weekly report on US crude oil inventories in the week to October 21.
That said, there are no changes to the range bound theme surrounding WTI in the very near term. The next up barrier remains at the October high at $93.62 (October 10) ahead of the weekly top at $97.65 (August 30), while the move beyond the key 200-day SMA at $98.28 exposes a potential visit to the psychological $100.00 mark per barrel. Just the opposite, the loss of the weekly low at $82.10 (October 18) could open the door to the key $80.00 mark per barrel ahead of the minor support at $79.16 (September 30). A move below the latter puts the September low at $76.28 (September 26) back on the radar prior to the 2022 low at $74.30 (January 3).
Resistance levels: $86.01 $87.12 $89.72 (4H chart)
Support levels: $82.62 $82.06 $79.12 (4H chart)
-638023191487842739.png)
DOW JONES
Equities gauged by the three major US stock indices rose further and clinched fresh multi-week peaks on the back of the acute retracement in the dollar and declining US yields across the curve.
Indeed, rising speculation of a potential Fed’s pivot (now) sooner rather than later lent fresh wings to the optimism among market participants and boosted the sentiment in the risk complex on turnaround Tuesday.
That said, the Dow Jones rose 0.80% to 31,749, the S&P500 gained 1.23% to 3,844 and the tech-reference Nasdaq Composite advanced 1.55% to 11,123.
Further recovery in the Dow Jones now looks at a test of the September high at 32,504 (September 12) seconded by the key 200-day SMA at 32,702 and the 33,364 level (August 26). Contrarily, there is an initial contention at the 30,206 level (October 21) before the 2022 low at 28,660 (October 13) and the October 2020 low at 26,143 (October 30). The daily RSI rebounded further to the vicinity of 64.
Top Performers: Nike, American Express, Salesforce Inc
Worst Performers: Travelers, UnitedHealth, 3M
Resistance levels: 31,805 32,504 33,364 (4H chart)
Support levels: 30,206 29,614 28,660 (4H chart)
-638023191839035193.png)
MACROECONOMIC EVENTS

All Information & Updates provided by:

All information relating to the financial markets available on this page has been prepared and issued by FXStreet (Forexstreet SL, Spain, Reg: B62498233) on the basis of publicly available information and all information believed to be reliable and does not conflict with Kuwaiti local laws, and all necessary care has been taken to before the company to ensure that the facts mentioned are correct from the source.
NCM Investment nor any of its directors or employees shall in any way be held responsible for the contents of this news, and the information contained on this page is intended only to provide clients with publicly available information and should not be construed as investment advice, report or analysis and/or constitute an offer or invitation to buy or sell financial instruments of any kind.
RISK WARNING: Forex and CFDs are highly risky leveraged products, as losses can exceed deposits. Please ensure you understand all the risks and take independent advice if necessary. NCM will segregate the clients based on the criteria of the regulator and its bylaws. NCM does not provide any advisory service; the material published does not constitute advice or a recommendation for a transaction in any financial instrument. NCM accepts no responsibility for any use of the content presented and any consequences of that use. Anyone acting on the information provided does so at their own risk.