
- Contact Us:
-

-

-

-


Daily Market Updates
28 Oct 2022
EURUSD
EUR/USD dropped markedly and shed more than a cent soon after hitting fresh tops near 1.0100 on Thursday. Indeed, the perceived dovish hike by the ECB put the European currency under pressure and forced it to give away part of the strong rebound in place since mid-October.
At a glance, the ECB suggested it has “made substantial progress in withdrawing monetary policy accommodation” after it hiked the refi rate by 75 bps to 2.00%, matching the broad consensus. The vote, however, was not unanimous, as three Board members favoured a 50 bps rate rate.
In addition, the Council remained worried over the elevated inflation and left the door open to further interest rate hikes at the upcoming meetings. The size of these expected rate hikes, however, could be smaller (50 bps?).
Still around inflation, Chairwoman Lagarde “blamed” the high energy prices and at some point, the depreciation of the euro, while the ECB now sees the economic activity slowing down in the next periods due to monetary tightening, and this scenario is likely to affect employment.
When it comes to APP and PEPP, all maturing assets are expected to be reinvested until at least the end of 2024. The Council, in the meantime, will start discussing Quantitative Tightening (QT) at the December gathering.
Finally, Lagarde reiterated that any interest rate decision remains data dependent and on a meeting-by-meeting basis.
Following the decline in the euro and the spread to the rest of the risk complex, the greenback staged a noticeable comeback and reclaimed the area well north of the 110.00 mark against the backdrop of another negative performance in US yields across the curve. Still around the money markets, the German 10-year bund yields dropped for the 5th session in a row, this time breaching the key 2.0% mark.
In the domestic calendar, Consumer Confidence in Germany tracked by GfK ticked higher to -41.9 in November (from 42.8).
Across the Atlantic, another revision saw the US GDP Growth Rate at 2.6% YoY in Q3, headline Durable Goods Orders expand 0.4% MoM in September and Initial Jobless Claims rise by 217K in the week to October 22.
In case bulls regain the upper hand, EUR/USD should surpass the October top at 1.0093 (October 27) to allow a potential move to the September peak at 1.0197 (September 12) ahead of the August high at 1.0368 (August 10). On the contrary, the 55-day SMA should offer temporary support at 0.9914 ahead of the weekly low at 0.9704 (October 21). South from here comes the October low at 0.9631 (October 13) prior to the 2022 low at 0.9535 (September 28). The daily RSI corrected further down and approached the 57 level.
Resistance levels: 1.0093 1.0197 1.0368 (4H chart)
Support levels: 0.9970 0.9943 0.9839 (4H chart)
-638024927619479533.png)
USDJPY
USD/JPY dropped for the third session in a row and visited new 3-week lows in the boundaries of 145.00 the figure on the back of the continuation of the downside bias in US yields across the curve.
The prevailing risk-off sentiment, in the meantime, seems to have favoured the demand for the Japanese safe haven, which eventually morphed into extra legs for the pair's downside.
From the MoF, finmin Suzuki announced that a stimulus package will be decided on Friday
In Japan, Foreign Bond Investment came at ¥164.5B in the week to October 22, in what was the sole release in the docket.
It seems that sellers have taken control of the sentiment around USD/JPY. Against that, the weekly low at 145.10 (October 27) appears as the initial support before the October low at 143.52 (October 5) and another weekly low at 140.34 (September 22). Once cleared, the pair could challenge the 100-day SMA at 139.52 ahead of the weekly low at 135.80 (August 23) and another weekly low at 131.73 (August 11). The immediate up barrier, in the meantime, remains at the 2022 top at 151.94 (October 21) before the June 1990 top at 155.80 (June 25). The daily RSI lost further ground and pierced the 50 mark.
Resistance levels: 146.93 148.41 149.45 (4H chart)
Support levels: 145.10 144.63 143.52 (4H chart)
-638024932659464272.png)
GBPUSD
GBP/USD posted humble losses, ending the session in the 1.1600 neighbourhood after bottoming out near 1.1550 earlier in the session on Thursday.
Indeed, the robust performance of the dollar put the recent upside in the pair and the rest of the risky assets to the test, forcing them to give away some of those gains in a context of declining yields on both sides of the ocean.
There were no data releases in the UK calendar on Thursday.
Next on the upside in GBP/USD appears the October top at 1.1645 (October 27) before the September peak at 1.1738 (September 13), a level also coincident with the 100-day SMA. Extra gains from here could revisit the weekly high at 1.1900 (August 26) ahead of the psychological 1.2000 yardstick. By contrast, the weekly low at 1.1059 (October 21) should offer initial contention prior to the October low at 1.0923 (October 12) and the 1.0538 level (September 28). The daily RSI eased a tad to the vicinity of 60.
Resistance levels: 1.1645 1.1738 1.1900 (4H chart)
Support levels: 1.1430 1.1257 1.1059 (4H chart)
-638024928318144979.png)
AUDUSD
Following new 3-week highs in the 0.6520/25 band, AUD/USD sparked a corrective move around a cent lower just to stabilize near 0.6470/80 towards the end of the session.
The strong bounce in the dollar weighed on the recent optimism around the risk complex and put the high-beta currencies as well as the commodity universe under heavy pressure on Thursday.
In line with the bearish note in the Aussie dollar, the 10-year AGB yields retreated for the 4th session in a row to levels last traded back in early October.
In Australia, Export Prices contracted 3.6% QoQ in Q3 and Import Prices rose 3.0% QoQ in the same period.
AUD/USD traded at shouting distance from the October high at 0.6547 (October 3). The surpass of this level should expose a potential test of the 55- and 100-day SMAs at 0.6630 and 0.6756, respectively, prior to the September top at 0.6916 (September 13) and the psychological 0.7000 yardstick. On the flip side, the 2022 low at 0.6169 (October 13) is expected to hold the initial downside test ahead of the psychological 0.6000 level seconded by the April 2020 low at 0.5980 (April 3). The daily RSI reversed course and deflated below 53.
Resistance levels: 0.6522 0.6547 0.6705 (4H chart)
Support levels: 0.6425 0.6372 0.6272 (4H chart)
-638024933054439774.png)
GOLD
The resumption of the bid bias in the greenback encouraged the USD Index (DXY) to return to the area beyond the 110.00 hurdle and forced the yellow metal to give away part of the recent 2-day advance.
Declining US yields, however, appear to have limited the downside of bullion to the area near $1,650 per ounce troy on Thursday.
Also weighing on the precious metal emerged the 75 bps rate hike by the ECB and the pledge to keep hiking until inflation approaches the bank’s 2.0% target. Further downside in gold also came in response to firmer views of a ¾ point rate raise by the Fed early in November.
Immediately to the upside in gold emerges the weekly high at $1,675 (October 26) followed by the minor level at $1,682 (October 13) and the interim 55-day SMA at $1,695. The breakout of this level could put the September top at $1,735 (September 12), back on the radar. The latter remains propped up by the 100-day SMA ahead of the $1,765 level (August 25) and the critical $1,800 mark. The initial down barrier turns up at the 2022 low at $1,614 (September 28) before the round level at $1,600 and prior to the April 2020 low at $1,572 (April 1).
Resistance levels: $1,675 $1,684 $1,714 (4H chart)
Support levels: $1,654 $1,638 $1,617 (4H chart)
-638024933413601891.png)
CRUDE WTI
WTI prices flirted with the key $90.00 mark per barrel on Thursday as optimism among traders persisted in response to the recently published record in US crude oil exports, as per Wednesday’s EIA report.
In addition, positive results of another revision of the US Q3 GDP added to the broad-based upbeat mood and seem to have allayed some recession concerns, collaborating at the same time with the bid bias around the commodity.
The continuation of the weekly rebound in WTI is expected to meet the next hurdle at the weekly high at $89.78 (October 27) ahead of the October top at $93.62 (October 10). Further north aligns the weekly peak at $97.65 (August 30) prior to the key 200-day SMA at $98.30 and the psychological $100.00 mark per barrel. On the other hand, the breach of the weekly low at $82.10 (October 18) could put a potential visit to the key $80.00 mark on the radar ahead of the minor support at $79.16 (September 30). Extra decline could revisit the September low at $76.28 (September 26) prior to the 2022 low at $74.30 (January 3).
Resistance levels: $89.78 $93.62 $97.65 (4H chart)
Support levels: $87.31 $85.25 $82.62 (4H chart
-638024934141934667.png)
DOW JONES
US equities traded on a mixed note amidst the recovery in the dollar, declining US yields and better-than-expected results from US fundamentals.
In addition, the ECB hiked rates by 75 bps – as widely expected – and left the door open to extra rate hikes, although those could be smaller. The decision by the ECB was not unanimous, as some Board members leant towards a half-point rate raise.
In quite a flat session when it came to sentiment, the Dow Jones rose 0.94% to 32,136, the S&P500 shed 0.35% to 3,817 and the tech-reference Nasdaq Composite deflated 1.44% to 10,811.
Dow Jones faces the next resistance at the October top at 32,388 just ahead of the September peak at 32,504 (September 12) and the key 200-day SMA at 32,661. North from here appears the 33,364 level (August 26) prior to the August high at 34,281 (August 16). On the contrary, the 30,206 level (October 21) remains the initial magnet for sellers seconded by the 2022 low at 28,660 (October 13) and the October 2020 low at 26,143 (October 30). The daily RSI ticked higher and approached 67.
Top Performers: Caterpillar, Boeing, Honeywell
Worst Performers: Apple, Intel, Microsoft
Resistance levels: 32,388 32,504 33,364 (4H chart)
Support levels: 31,389 30,206 29,614 (4H chart)
-638024934445773265.png)
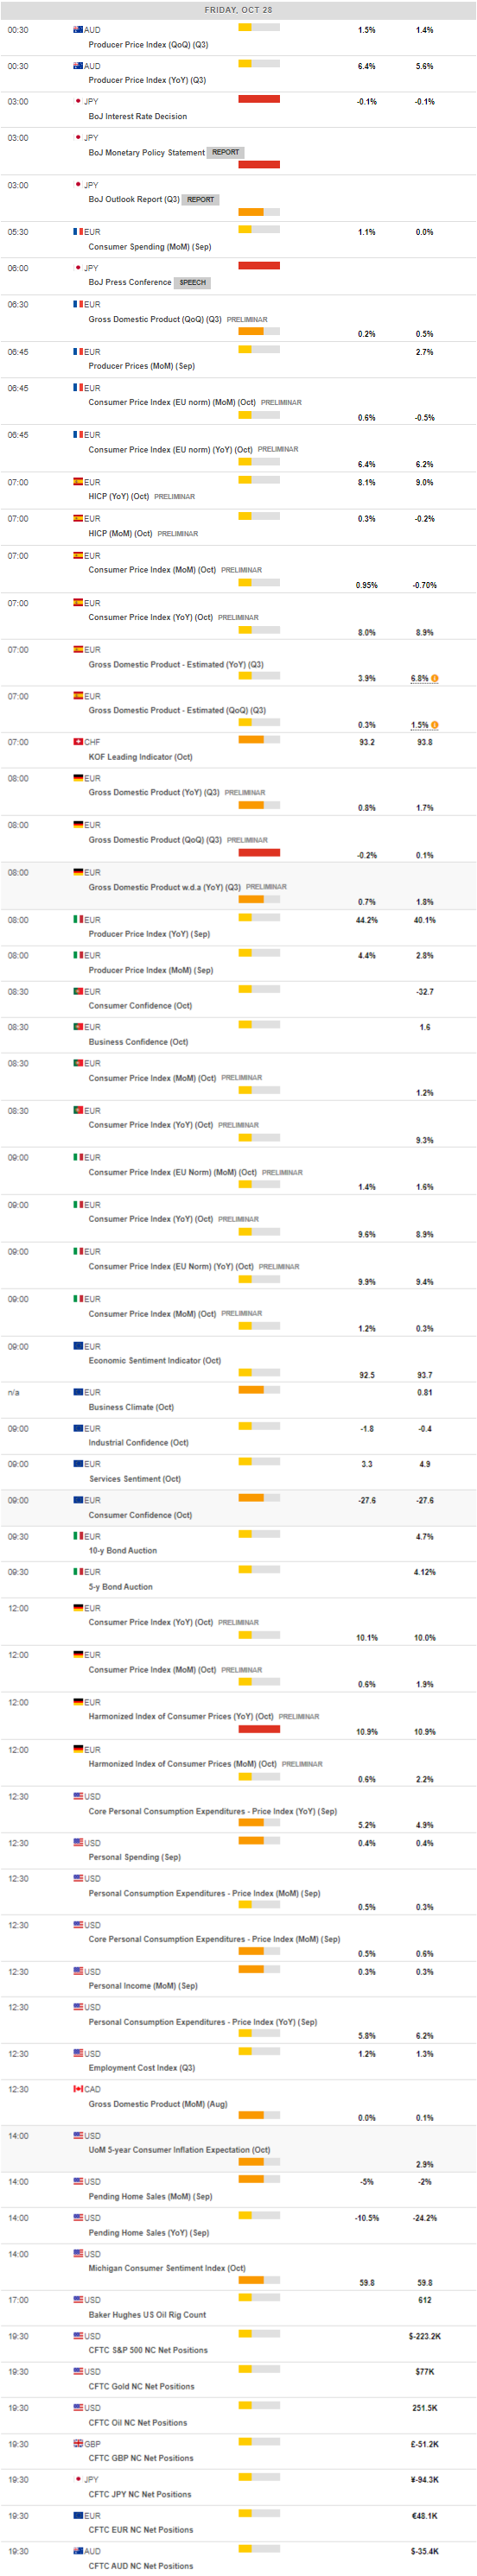
MACROECONOMIC EVENTS
All Information & Updates provided by:

All information relating to the financial markets available on this page has been prepared and issued by FXStreet (Forexstreet SL, Spain, Reg: B62498233) on the basis of publicly available information and all information believed to be reliable and does not conflict with Kuwaiti local laws, and all necessary care has been taken to before the company to ensure that the facts mentioned are correct from the source.
NCM Investment nor any of its directors or employees shall in any way be held responsible for the contents of this news, and the information contained on this page is intended only to provide clients with publicly available information and should not be construed as investment advice, report or analysis and/or constitute an offer or invitation to buy or sell financial instruments of any kind.
RISK WARNING: Forex and CFDs are highly risky leveraged products, as losses can exceed deposits. Please ensure you understand all the risks and take independent advice if necessary. NCM will segregate the clients based on the criteria of the regulator and its bylaws. NCM does not provide any advisory service; the material published does not constitute advice or a recommendation for a transaction in any financial instrument. NCM accepts no responsibility for any use of the content presented and any consequences of that use. Anyone acting on the information provided does so at their own risk.