
- Contact Us:
-

-

-

-


Daily Market Updates
31 Oct 2022
EURUSD
EUR/USD briefly tested the 0.9930/25 band – or 3-day lows - just to bounce later and poke with the parity zone, ending Friday’s session with marginal gains near 0.9970. The pair, therefore, clinched the second week in a row with gains, shedding some ground after hitting new 6-week peaks near 1.0100.
The dollar, in the meantime, remained bid and encouraged the USD Index (DXY) to advance for the second session in a row, managing at the same time to ephemerally trespass the 111.00 barrier.
US yields rose across the curve and trimmed part of the recent corrective decline, while the German 10-year bund yields followed suit and regained the 2.15% level after bottoming out in the sub-2.00% area during the previous session.
In the meantime, market participants continued to adjust to the ECB announcements from its event on Thursday, where the central bank hiked rates by 75 bps amidst a divided vote.
Moving forward, markets’ focus of attention is now expected to gyrate towards the Fed gathering on November 2, where another 75 bps rate hike is almost fully anticipated.
Busy day data wise in the Euroland, as flash inflation figures expect consumer prices to rise more than estimated in France (6.2% YoY), Italy (11.9% YoY) and Germany (10.4% YoY) in October. In addition, the German economy is seen expanding 1.2% YoY in Q3 according to advanced readings. In the broader euro area, final results saw the Consumer Confidence at -27.6, the Economic Sentiment at 92.5 and the Industrial Sentiment at -1.2.
In the US, inflation measured by the headline PCE rose 6.2% in the year to September and 5.1% YoY when it came to the Core print. Further US results for the month of September saw Personal Income expand 0.4% MoM in September, Personal Spending increase at a monthly 0.6%, the final Michigan Consumer Sentiment gauge improve to 59.9 in October and Pending Home Sales contract 10.2% MoM.
The resumption of the bullish sentiment should motivate EUR/USD to challenge the October peak at 1.0093 (October 27) ahead of the September high at 1.0197 (September 12). The surpass of the latter could put a potential test of the August top at 1.0368 (August 10) back on the investors’ radar prior to the critical 200-day SMA, today at 1.0502. By contrast, the former resistance line around 0.9910 seems to have now become quite a solid support. Reinforcing this level, there is an interim support at the 55-day SMA at 0.9909 before the weekly low at 0.9704 (October 21). The loss of this region could open the door to the October low at 0.9631 (October 13) and the 2022 low at 0.9535 (September 28). The daily RSI advanced marginally near 56.
Resistance levels: 1.0093 1.0197 1.0368 (4H chart)
Support levels: 0.9926 0.9835 0.9806 (4H chart)
-638027404395750246.png)
USDJPY
USD/JPY reversed three consecutive daily losses and advanced moderately on Friday, reclaiming at the same time the 147.00 hurdle and above. Looking at the weekly chart, the pair navigated within the 150.00-145.00 range and ended almost unchanged near 147.40.
Indeed, the recovery in the greenback, but mainly the positive performance in US yields across the curve sponsored the resumption of the bid bias in the pair. On the latter, yields reversed several daily pullbacks in response to the resurgence of the selling pressure in bonds.
Also underpinning the upside momentum in spot – and the selling bias in the Japanese currency - the BoJ left unchanged its ultra-accommodative monetary stance at its event on Friday, at the time when Governor Kuroda ruled out any interest rate hike or exit strategy for the time being.
More from the BoJ event, Board members reiterated that short- and long-term policy rates are expected to remain at current or lower levels. As usual, the central bank emphasized its readiness to take additional easing measures, always closely following the impact of the pandemic on the economy.
From the BoJ Quarterly Report, the economy is predicted to recover as the impact of the pandemic and supply disruptions dwindle. In addition, FX movements and commodity prices are considered as price risk factors. The report sees the economy recovering on the back of increasing pent-up demand and expects the core inflation to slow its pace by the middle of next fiscal year.
In the Japanese docket, the Unemployment Rate unexpectedly ticked higher to 2.6% in September (from 2.5%) and the Jobs/Applications Ratio went up to 1.34 in the same month.
The weekly low at 145.10 (October 27) still emerges as the next contention in case bears regain the initiative in the near term. Further south comes the October low at 143.52 (October 5) prior to another weekly low at 140.34 (September 22). The loss of this area could pave the way for the 100-day SMA at 139.65 prior to the weekly low at 135.80 (August 23) and another weekly low at 131.73 (August 11). Occasional bullish attempts, in the meantime, are still expected to test the 2022 high at 151.94 (October 21) before the June 1990 top at 155.80 (June 25). The daily RSI bounced to the boundaries of 56.
Resistance levels: 147.86 148.41 149.45 (4H chart)
Support levels: 145.74 145.10 144.63 (4H chart)
-638027405075944485.png)
GBPUSD
GBP/USD reversed Thursday’s downtick and closed once again above the 1.1600 mark, keeping the trade in the upper end of the recent range around 6-week highs.
The renewed optimism around the British pound motivated cable to rise for the third week in a row and regain the key 1.1600 barrier despite the late bounce in the dollar.
The UK docket remained empty this week, whereas the focus of attention will be on the BoE interest rate decision on November 3, where market participants expect a 75 bps rate hike.
GBP/USD still faces the initial up barrier at the October peak at 1.1645 (October 27) ahead of the September high at 1.1738 (September 13), an area reinforced by the proximity of the 100-day SMA. North from here emerges the weekly top at 1.1900 (August 26), which precedes the psychological 1.2000 mark prior to the August peak at 1.2293 (August 1). On the contrary, there is a temporary support at the 55-day SMA at 1.1433 before the weekly low at 1.1059 (October 21). The loss of this level could open the door to the October low at 1.0923 (October 12) and the 1.0538 level (September 28). The daily RSI picked up pace and surpassed 60.
Resistance levels: 1.1645 1.1738 1.1900 (4H chart)
Support levels: 1.1503 1.1430 1.1257 (4H chart)
-638027404701737907.png)
AUDUSD
AUD/USD added to Thursday’s retracement and closed just above the 0.6400 hurdle not before testing lows in the 0.6390/85 band on Friday. The corrective downside in the pair seen in the second half of the week, however, did not prevent the pair to close the second consecutive week with gains.
Another positive session in the dollar was enough to drag the pair lower at the end of the week along with the generalized bearish performance in the commodity universe. On this, copper prices dropped to 2-day lows and prices of the iron ore retreated to levels last seen in early October.
Data wise Down Under, Producer Prices rose 1.9% QoQ in Q3 and 6.4% YoY.
The surpass of the weekly top at 0.6522 (October 27) should open the door to a rapid test of the October peak at 0.6547 (October 3). North from here turns up the 55- and 100-day SMAs at 0.6616 and 0.6750, respectively, ahead of the September high at 0.6916 (September 13) prior to the psychological 0.7000 mark. Contrarily, there are no support levels of note until the 2022 low at 0.6169 (October 13), which precedes the psychological 0.6000 mark ahead of the April 2020 low at 0.5980 (April 3). The daily RSI tumbled below the 49 level.
Resistance levels: 0.6456 0.6522 0.6547 (4H chart)
Support levels: 0.6389 0.6372 0.6272 (4H chart)
-638027405453295319.png)
GOLD
Gold prices extended the leg lower to the sub-$1,640 region on Friday, clinching the second consecutive daily drop and closing the week in the negative territory. So far, bullion seems to be well supported by the $1,615 region, home of the so far 2022 lows and an area last traded back in April 2020.
The continuation of the bid bias in the greenback coupled with the recovery in US yields added to the pessimism seen around the precious metal in the second half of the week, which saw prices of the ounce troy shed further ground after reaching tops around $1,675 earlier on October 26.
In the meantime, the yellow metal should remain under pressure in the very near term in light of the upcoming FOMC event and the most likely 75 bps rate hike.
A deeper retracement in gold is seen revisiting the 2022 low at $1,614 (September 28) ahead of the round level at $1,600 and before the April 2020 low at $1,572 (April 1). Bouts of strength, in the meantime, should face immediate resistance at the weekly top at $1,675 (October 26) prior to the minor level at $1,682 (October 13) and the interim 55-day SMA at $1,692. If bullion breaks above the latter, it could prompt the September peak at $1,735 (September 12) to re-emerge on the horizon. This level appears bolstered by the 100-day SMA ($1,729) before the $1,765 level (August 25) and the critical $1,800 mark.
Resistance levels: $1,665 $1,675 $1,714 (4H chart)
Support levels: $1,638 $1,617 $1,614 (4H chart)
-638027405970758848.png)
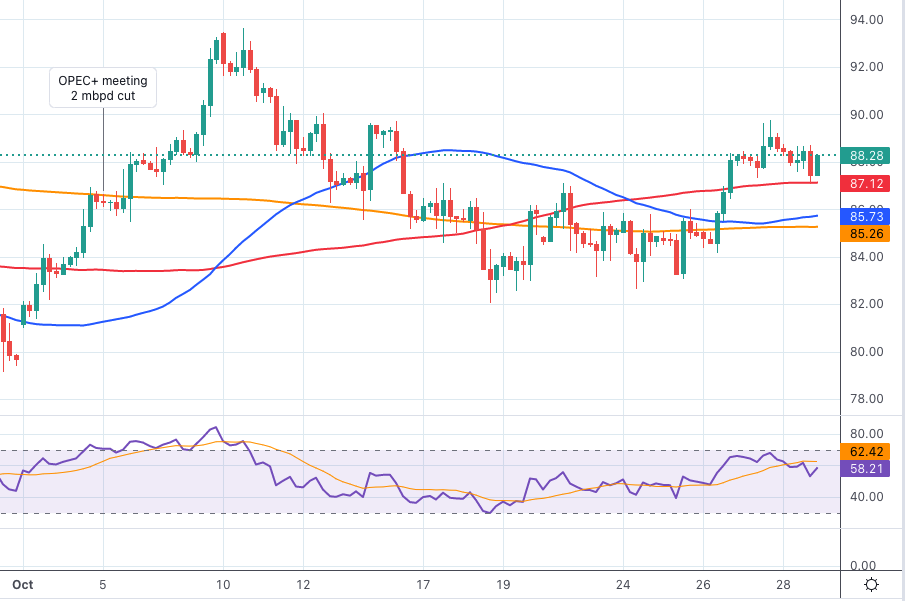
CRUDE WTI
Prices of the American benchmark for the sweet light crude oil dropped marginally on Friday, although they managed to clinch the first weekly gain after two consecutive pullbacks.
In fact, traders’ sentiment soured on Friday after China implemented lockdown measures following the resurgence of COVID cases, which could directly impact on crude oil demand.
However, the upcoming EU ban on Russian oil exports starting in early December coupled with the recently announced oil output cut by the OPEC+ appear to have limited the downside along with positive results from GDP figures in the US and Germany for the July-September period.
In the calendar, US oil rig count went down by 2 in the week to October 28, taking the total US active oil rigs to 610 according to the weekly report on the US drilling activity by Baker Hughes.
The weekly top at $89.78 (October 27) now becomes the initial target for WTI bulls ahead of the October peak at $93.62 (October 10). The breakout of this level could pave the way for a move to the weekly high at $97.65 (August 30) before the key 200-day SMA at $98.32 and the psychological $100.00 mark per barrel. On the contrary, losses are predicted to pick up pace once the weekly low at $82.10 (October 18) is cleared. That said, a potential test of the key $80.00 mark could then re-emerge on the horizon prior to the minor support at $79.16 (September 30). Further down lines up the September low at $76.28 (September 26) seconded by the 2022 low at $74.30 (January 3).
Resistance levels: $89.78 $93.62 $97.65 (4H chart)
Support levels: $87.07 $85.26 $82.62 (4H chart)
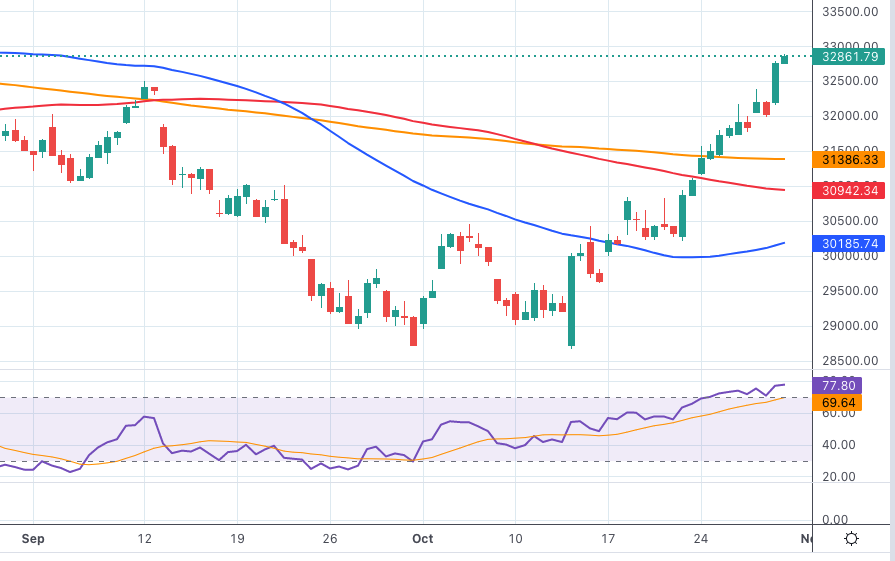
DOW JONES
Equities tracked by the Dow Jones rose to fresh 2-month peaks in the boundaries of the 33,000 hurdle on the back of positive results from US fundamentals and rising speculation that the Federal Reserve could start discussing slowing the pace of its tightening cycle as soon as at the December meeting.
In addition, positive results from megacap Apple boosted the tech sector and also added to the renewed optimism among market participants.
Furthermore, the Dow clinched the 4th consecutive weekly advance and remains well on track to close the first monthly gain after two retracements in a row.
That said, the Dow Jones advanced 2.59% to 32,861, the S&P500 rose 2.46% to 3,901 and the tech-heavy Nasdaq Composite gained 2.87% to 11,102.
The continuation of the recovery in the Dow Jones now targets the minor hurdle at the 33,364 level (August 26) ahead of the August top at 34,281 (August 16) and the April peak at 35,492. Just the opposite, there is initial contention at the 30,206 level (October 21) prior to the 2022 low at 28,660 (October 13) and the October 2020 low at 26,143 (October 30). The daily RSI entered the overbought territory beyond 71 for the first time since mid-August.
Top Performers: Intel, Apple, Honeywell
Worst Performers: Dow, Merck&Co, Chevron
Resistance levels: 32,889 33,364 34,281 (4H chart)
Support levels: 31,386 30,206 29,614 (4H chart)
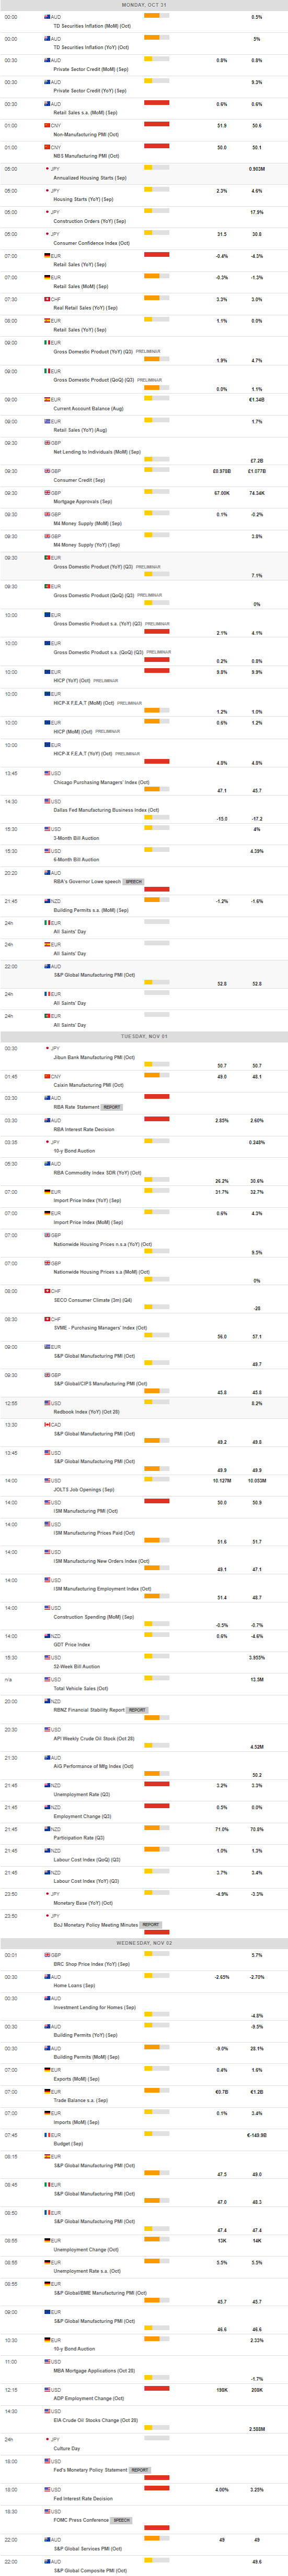
MACROECONOMIC EVENTS
All Information & Updates provided by:

All information relating to the financial markets available on this page has been prepared and issued by FXStreet (Forexstreet SL, Spain, Reg: B62498233) on the basis of publicly available information and all information believed to be reliable and does not conflict with Kuwaiti local laws, and all necessary care has been taken to before the company to ensure that the facts mentioned are correct from the source.
NCM Investment nor any of its directors or employees shall in any way be held responsible for the contents of this news, and the information contained on this page is intended only to provide clients with publicly available information and should not be construed as investment advice, report or analysis and/or constitute an offer or invitation to buy or sell financial instruments of any kind.
RISK WARNING: Forex and CFDs are highly risky leveraged products, as losses can exceed deposits. Please ensure you understand all the risks and take independent advice if necessary. NCM will segregate the clients based on the criteria of the regulator and its bylaws. NCM does not provide any advisory service; the material published does not constitute advice or a recommendation for a transaction in any financial instrument. NCM accepts no responsibility for any use of the content presented and any consequences of that use. Anyone acting on the information provided does so at their own risk.