
- Contact Us:
-

-

-

-


Daily Market Updates
04 Nov 2022
EURUSD
EUR/USD extended the weekly leg lower on Thursday and this time broke below the 0.9800 support with some conviction, probing the area of 2-week lows near 0.9730 on the back of the intense buying pressure in the greenback.
Indeed, the buck saw its upside renovated following the FOMC event on Wednesday – particularly Powell’s press conference – and lifted the USD Index (DXY) back above the 113.00 mark, or 2-week tops.
The marked uptick in the greenback was also accompanied by a noticeable rise in US yields, particularly in the short end of the curve, reaching levels last traded back in May 2006 past the 5.00% yardstick.
In the calendar, the Unemployment Rate in the euro area stayed unchanged at 6.6% in September in what was the only scheduled release on Thursday.
Across the ocean, Initial Jobless Claims rose by 217K in the week to October 27, the final S&P Global Services PMI deflated to 47.9, the trade deficit widened to $73.3B in September, Factory Orders expanded 0.6% MoM in the same period and the key ISM Non-Manufacturing eased a tad to 54.4 in October.
The continuation of the downtrend in EUR/USD now faces immediate contention at the weekly low at 0.9704 (October 21) prior to the October low at 0.9631 (October 13) and the 2022 low at 0.9535 (September 28). Just the opposite, there is a minor hurdle at the weekly peak at 0.9975 (November 2) followed by the 100-day SMA at 1.0055 and the October high at 1.0093 (October 27). The surpass of the latter could put a test of the September top at 1.0197 (September 12) back on the radar before the August peak at 1.0368 (August 10). The daily RSI sank to the vicinity of 43.
Resistance levels: 0.9821 0.9975 0.9998 (4H chart)
Support levels: 0.9730 0.9704 0.9631 (4H chart)
-638031010187337492.png)
USDJPY
Further dollar strength in combination with extra upside in US yields across the curve motivated USD/JPY to chart decent gains and set aside two consecutive daily pullbacks on Thursday.
Indeed, the 2-year note yields climbed to fresh 16-year tops north of the key 5.00% barrier earlier in the session, just to stabilize afterwards around 4.70% in line with multi-session tops in the belly and the long end of the curve.
The Japanese docket was empty on Thursday following the Culture Day holiday.
Further upside momentum in USD/JPY should retarget the minor barrier at the weekly high at 148.84 (October 31) prior to the 2022 top at 151.94 (October 21) and the June 1990 high at 155.80 (June 25). Meanwhile, there is no change to the downside, as the initial support remains at the weekly low at 145.10 (October 27) ahead of the October low at 143.52 (October 5) and seconded by another weekly low at 140.34 (September 22), which still looks underpinned by the 100-day SMA (140.22). South from here emerges the weekly low at 135.80 (August 23) followed by another weekly low at 131.73 (August 11). The daily RSI reversed course and rose past the 57 level.
Resistance levels: 148.44 148.84 149.45 (4H chart)
Support levels: 146.28 145.66 145.10 (4H chart)
-638031011113831989.png)
GBPUSD
GBP/USD plummeted to 2-week lows well south of the 1.1200 barrier in response to the combination of the stronger Dollar and some disappointment from the BoE event on Thursday.
In fact, the Dollar intensified its march north and clinched new highs when measured by the USD Index (DXY) as investors continued to assess the latest FOMC gathering (Wednesday).
From the BoE, the MPC unanimously voted for a raise of the policy rate by 75 bps (the largest incremental hike since 1989), although it signaled that rates could peak at a lower level than markets were currently predicting. Back to the vote, members Dhingra and Tenreyro favoured a 50 bps hike and 25 bps raise, respectively.
In addition, the BoE forecast a 2-year recession, while it sees the CPI at 2.2% by the end of 2024 if rates stay at 3.0%. Furthermore, domestic prices and wages seem to support a higher long-term inflation. Additionally, the GDP is predicted to fall 2.9% over the next eight quarters and inflation is expected to peak around 11% in the last quarter of 2022.
At his press conference, Governor A.Bailey said that rates may have to go further up, but less than previously anticipated. He noted that the labour market could be softening somewhat, although it remains tight. Bailey also suggested that the current downturn dampens domestic inflationary pressure.
In the UK docket, the final S&P Global Services PMI dropped to 48.8 in October (from 50.0).
If sellers push harder, GBP/USD could dispute the weekly low at 1.1059 (October 21) ahead of the October low at 1.0923 (October 12). On the flip side, the October top at 1.1645 (October 27) remains the initial hurdle for bulls ahead of the 100-day SMA at 1.1700 and the September peak at 1.1738 (September 13). If Cable breaks above this level, the door could open to a visit to the weekly high at 1.1900 (August 26) prior to the psychological 1.2000 mark and the August top at 1.2293 (August 1). The daily RSI collapsed to the area near 43.
Resistance levels: 1.1565 1.1623 1.1645 (4H chart)
Support levels: 1.1153 1.1059 1.0947 (4H chart)
-638031010502866188.png)
AUDUSD
The bearishness around AUD/USD extended for the 6th consecutive session on Thursday, this time testing the 0.6275/70 band and poking at the same time with 2-week lows.
Once again, dollar dynamics was behind another negative performance of the Aussie dollar and a generalized move lower in the risk complex. Adding to the sour mood that surrounded the pair on Thursday emerged the weaker print from the Services PMI in the Chinese economy (48.4), which slipped back into the contraction territory in October.
Extra weakness hurting the AUD came from the poor results from the commodity space where both prices of copper and the iron ore extended the decline.
In Oz, the trade surplus widened to A$12.444B in September, with Exports expanding 7% MoM and Imports increasing 0.4%.
Occasional bouts of optimism could propel AUD/USD to test the minor hurdle at the weekly peak at 0.6492 (November 2) soon followed by another weekly high at 0.6522 (October 27) and ahead of the October top at 0.6547 (October 3). The surpass of the latter could expose the interim 55- and 100-day SMAs at 0.6571 and 0.6726, respectively, before the September peak at 0.6916 (September 13) seconded by the psychological 0.7000 level. On the other hand, the 2022 low at 0.6169 (October 13) is expected to come first prior to the psychological 0.6000 mark and the April 2020 low at 0.5980 (April 3). The daily RSI deflated further and approached the 40 region.
Resistance levels: 0.6372 0.6415 0.6492 (4H chart)
Support levels: 0.6272 0.6210 0.6169 (4H chart)
-638031011406996736.png)
GOLD
Prices of the ounce troy of the yellow metal flirted with the YTD lows near $1,615 on Thursday, just to bounce a tad soon afterwards.
The negative tone in bullion came as a result of the intense bounce in the Dollar, which was in turn propped up by the march north in US yields across the board and the omnipresent feeling that the Fed is still far away from pausing its current normalization process.
A breach of the 2022 low at $1,614 (September 28) looms closer. Once cleared, gold could then confront the round level at $1,600 prior to the April 2020 low at $1,572 (April 1). Inversely, the weekly peak at $1,675 (October 26) appears underpinned by the vicinity of the interim 55-day SMA at $1,682. The breakout of this region could open the door to a potential test of the September high at $1,735 (September 12) prior to the $1,765 level (August 25) and the critical $1,800 yardstick.
Resistance levels: $1,669 $1,675 $1,714 (4H chart)
Support levels: $1,614 6 $1,606 $1,572 (4H chart)
-638031011682705496.png)
CRUDE WTI
The latest decision by the Federal Reserve to hike rates and the hawkish tone from Chief Powell reignited recession concerns and hurt the sentiment among traders on Thursday.
In addition, new lockdown measures in China also weighed on prices of the WTI and kept demand concerns well in place for yet another session.
On the flip side, the current tight condition of the oil market – which is seen tighter in the next months – in combination with the lower oil output from the OPEC+ and the upcoming EU sanctions on Russian oil somehow kept the downside limited.
If bulls regain the upper hand, WTI is expected to meet the next barrier at the weekly top at $90.34 (November 2) ahead the October peak at $93.62 (October 10) and the weekly high at $97.65 (August 30). Further gains could pave the way for a move to the key 200-day SMA at $98.37, which anticipates the psychological $100.00 mark per barrel. By contrast, there is initial support at the weekly low at $82.10 (October 18) prior to the key $80.00 mark and the minor support at $79.16 (September 30). Extra weakness could then retest the September low at $76.28 (September 26) ahead of the 2022 low at $74.30 (January 3).
Resistance levels: $90.34 $93.62 $97.65 (4H chart)
Support levels: $85.45 $85.29 $82.62 (4H chart)
-638031012538622481.png)
DOW JONES
The three major US stock indices added to Wednesday’s losses as market participants continued to assess the recent interest rate hike by the Fed and hawkish comments by Chair Powell.
Indeed, traders’ sentiment appeared depressed on Thursday in response to now diminishing bets of a Fed’s pivot in the near term, while recession jitters came to the fore once again.
That said, the Dow Jones retreated 0.14% top 32,104, the S&P500 lost 0.63% to 3.736 and the tech benchmark Nasdaq Composite dropped 1.02% to 10.417.
Next on the downside for the Dow Jones come the interim 100- and 55-day SMAs at 31,407 and 31,094, respectively, prior to the 30,206 level (October 21). The breach of the latter could prompt the 2022 low at 28,660 (October 13) to re-emerge on the horizon before the October 2020 low at 26,143 (October 30). On the upside, the November top at 33,071 (November 2) aligns as the initial hurdle just ahead of the 33,364 level (August 26) and the August peak at 34,281 (August 16). North from here emerges the April high at 35,492. The daily RSI receded a tad to the vicinity of 61.
Top Performers: Boeing, Caterpillar, Honeywell
Worst Performers: Apple, Visa A, Home Depot
Resistance levels: 33,071 33,364 34,281 (4H chart)
Support levels: 31,727 31,410 30,206 (4H chart)
-638031012886054170.png)
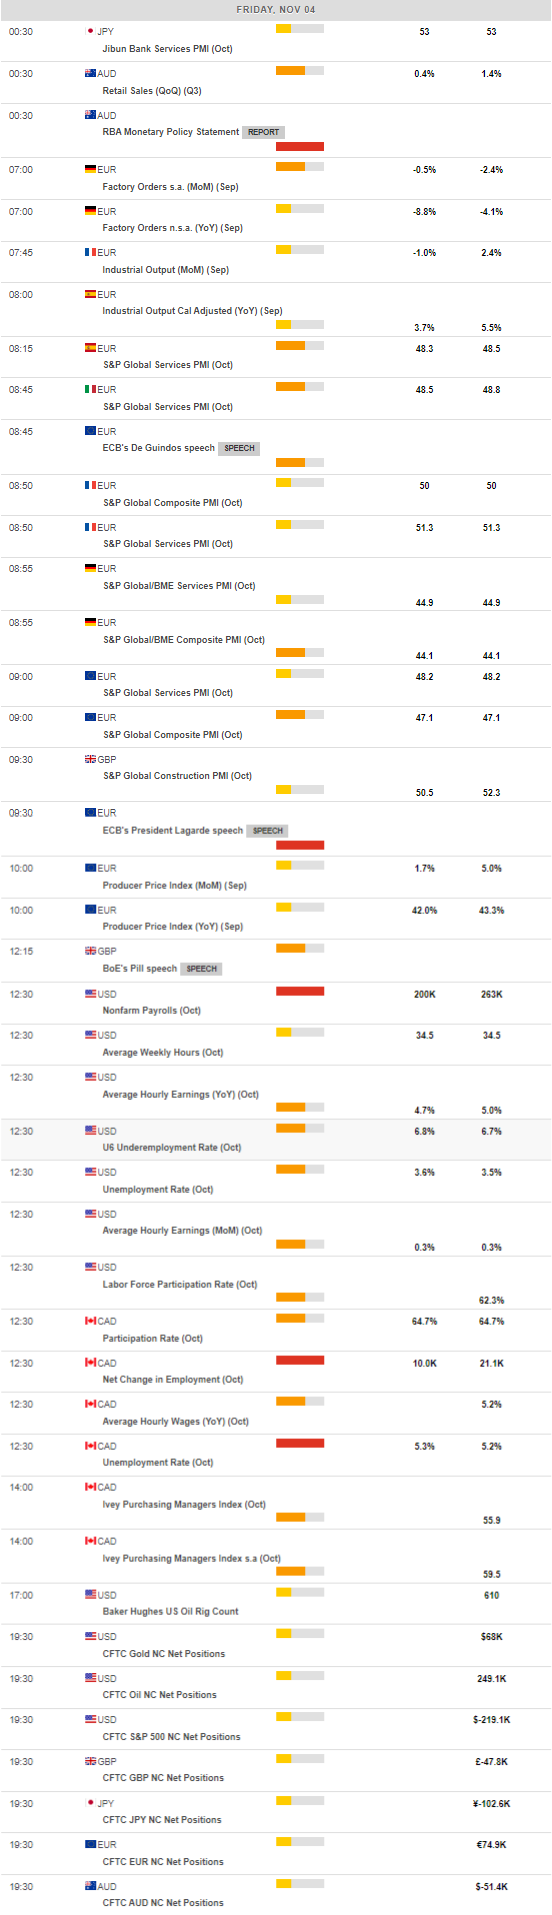
MACROECONOMIC EVENTS
All Information & Updates provided by:

All information relating to the financial markets available on this page has been prepared and issued by FXStreet (Forexstreet SL, Spain, Reg: B62498233) on the basis of publicly available information and all information believed to be reliable and does not conflict with Kuwaiti local laws, and all necessary care has been taken to before the company to ensure that the facts mentioned are correct from the source.
NCM Investment nor any of its directors or employees shall in any way be held responsible for the contents of this news, and the information contained on this page is intended only to provide clients with publicly available information and should not be construed as investment advice, report or analysis and/or constitute an offer or invitation to buy or sell financial instruments of any kind.
RISK WARNING: Forex and CFDs are highly risky leveraged products, as losses can exceed deposits. Please ensure you understand all the risks and take independent advice if necessary. NCM will segregate the clients based on the criteria of the regulator and its bylaws. NCM does not provide any advisory service; the material published does not constitute advice or a recommendation for a transaction in any financial instrument. NCM accepts no responsibility for any use of the content presented and any consequences of that use. Anyone acting on the information provided does so at their own risk.