
- Contact Us:
-

-

-

-


Daily Market Updates
07 Nov 2022
EURUSD
The outstanding performance of the European currency lifted EUR/USD more than 2% and motivated it to flirt with pre-FOMC levels near 0.9970 at the end of the week. Despite Friday’s intense advance, spot closed the week with losses and reversed two consecutive weekly gains.
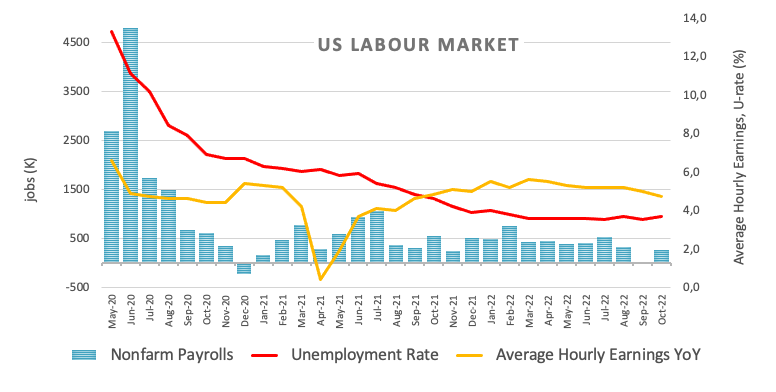
The pair’s violent uptick came in response to the equally strong drop in the greenback, which forced the USD Index (DXY) to recede to 2-day lows and erase at the same time all the gains recorded in the wake of the Fed’s meeting. The sharp decline in the dollar followed mixed results from the Nonfarm Payrolls, where the US economy added 261K jobs in October, although the Unemployment Rate ticked higher to 3.7%.
In addition, many Fed speakers seem to have also favoured a slower rate path in the upcoming meetings: S.Collins (Boston) said it makes sense for the Fed to switch to smaller rate raises, while T.Barkin (Richmond) suggested the Fed might have its foot on the brake already. N.Kashkari (Minneapolis) added that hiring remains healthy following the October’s jobs report and C.Evans (Chicago) noted that inflation readings are expected to remain disappointing and suggested that there is still ample room for tightening even with smaller interest rate hikes.
In the docket, final Germany S&P Global Services PMI improved to 46.5 in October, while it eased little to 48.6 when it came to the broader Euroland.
More from the US Nonfarm Payrolls saw the Average Hourly Earnings expand 0.4% MoM during last month and 4.7% from a year earlier. In addition, the Participation Rate dropped marginally to 62.2% from 62.3%.
EUR/USD ended the week at shouting distance from the weekly high at 0.9975 (November 2). The surpass of this level should expose the 100-day SMA at 1.0050 prior to the October top at 1.0093 (October 27). North from here emerges the September peak at 1.0197 (September 12) ahead of the August high at 1.0368 (August 10). On the flip side, the weekly low at 0.9730 (November 3) is expected to offer initial contention before another weekly low at 0.9704 (October 21). If the pair clears the latter, it could then challenge the October low at 0.9631 (October 13) ahead of the 2022 low at 0.9535 (September 28). The daily RSI leapt to the 55 region.
Resistance levels: 0.9975 0.9998 1.0093 (4H chart)
Support levels: 0.9815 0.9730 0.9704 (4H chart)
-638032900571598217.png)
USDJPY
USD/JPY plummeted to 2-day lows and revisited the 146.50 region in response to the acute sell-off in the Dollar and the mixed performance of US yields at the end of the week. Looking at the weekly chart, the pair clinched its third consecutive decline so far.
In fact, investors dumped the greenback following inconclusive results from the October’s Nonfarm Payrolls coupled with Fedspeak supporting the idea that the Federal Reserve could keep its tightening cycle unchanged for the time being, although at a slower pace.
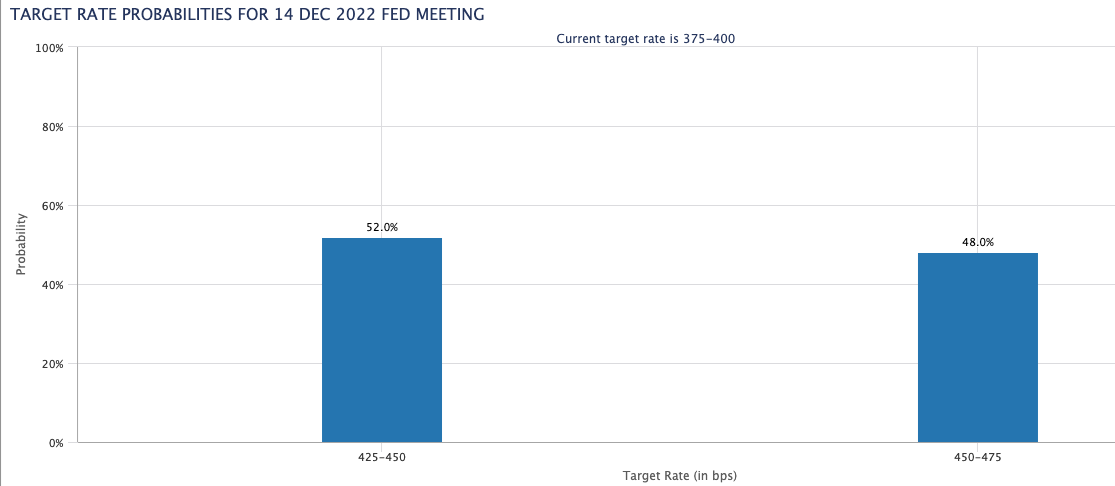
On the latter, CME Group’s FedWatch Tool sees a 50 bps rate hike at the December 14 meeting slightly favoured vs. a 75 bps raise.
In Japan, Foreign Bond Investment shrank to ¥1172.5B in the week to October 29.
Occasional bullish attempts in USD/JPY continue to target the weekly top at 148.84 (October 31). Once cleared, there are no hurdles of relevance until the 2022 peak at 151.94 (October 21) followed by the June 1990 top at 155.80 (June 25). Just the opposite, there is a minor support at the November low at 145.66 (November 2), which precedes the weekly low at 145.10 (October 27) prior to the October low at 143.52 (October 5) and another weekly low at 140.34 (September 22). The daily RSI plummeted to the sub-50 area.
Resistance levels: 148.44 148.84 149.45 (4H chart)
Support levels: 146.41 145.66 145.10 (4H chart)
-638032901521458967.png)
GBPUSD
In line with the rest of the risk-associated space, the British Pound gathered strong upside traction and advanced nearly 2.0% to the 1.1380/85 band on Monday, always against the backdrop of the collapse in the greenback. Cable, however, could not prevent halting a 3-week positive streak.
Indeed, the dollar quickly faded the post-Payrolls advance and accelerated its losses to the area well south of the 111.00 support when tracked by the USD Index (DXY), or 2-day lows.
Additionally, BoE Chief Economist H.Pill was once again on the wires and reiterated that markets seem to be challenging the central bank’s view on rates and therefore favour higher rates. He left the door open to further rate raises in the future, nonetheless.
In the UK calendar, the final S&P Global Construction PMI improved a tad to 53.2 in October (from 52.3).
Friday’s bounce in GBP/USD now opens the door to the recovery to confront the October peak at 1.1645 (October 27) closely followed by the 100-day SMA at 1.1691 and the September high at 1.1738 (September 13). The breakout of the latter could pave the way to a test of the weekly top at 1.1900 (August 26) before the psychological 1.2000 level and the August peak at 1.2293 (August 1). In the opposite direction, the resumption of the selling bias should put the so far November low at 1.1142 (November 4) back on the radar prior to the weekly low at 1.1059 (October 21) and the October low at 1.0923 (October 12). The daily RSI bounced past the 50 level.
Resistance levels: 1.1381 1.1565 1.1623 (4H chart)
Support levels: 1.1232 1.1142 1.1059 (4H chart)
-638032901163685378.png)
AUDUSD
AUD/USD jumped nearly 3% helped by the intense sell-off in the Dollar and the generalized upbeat sentiment in the risk-linked galaxy on Friday.
Indeed, the greenback quickly faded a post-NFP uptick and collapsed to 2-day lows pari passu with investors’ repricing of a potential Fed’s pivot in the now relatively short-term horizon.
In addition, the weaker dollar lent fresh legs to copper prices and the iron ore. The latter rose for the 5th consecutive session and flirted with the $88.00 mark per tonne.
Data wise Down Under, the RBA published its Statement on Monetary Policy (SoMP) and now sees inflation at 4.75% in December 2023 (vs. 4.25 prev.) and the GDP slowing to 3.0% by year-end down to 1.5% in December 2023 and 2024. The bank’s forecasts are based on the OCR rising to 3.5% in 2023.
Friday’s price action leaves AUD/USD exposed to further gains in the near term, with the immediate hurdle at the so far November high at 0.6492 (November 2) before the weekly top at 0.6522 (October 27) and prior to the October peak at 0.6547 (October 3). North from here comes the interim 55- and 100-day SMAs at 0.6564 and 0.6721, respectively, ahead of the September high at 0.6916 (September 13) and just before the psychological 0.7000 level. By contrast, the 2022 low at 0.6169 (October 13) emerges as the initial magnet for AUD bears ahead of the psychological 0.6000 mark and the April 2020 low at 0.5980 (April 3). The daily RSI jumped past the 53 yardstick.
Resistance levels: 0.6492 0.6522 0.6547 (4H chart)
Support levels: 0.6405 0.6272 0.6210 (4H chart)
-638032902367529451.png)
GOLD
Gold prices rose to new 3-week peaks around $1,680 per ounce troy at the end of the week.
The sudden rebound in the precious metal not only left behind two sessions in a row with losses but also revisited the 55-day SMA and approached the key 200-week SMA around $1,690. In addition, bullion started the first month with gains after seven months in a row posting losses.
The surprising steep pullback in the dollar in combination with mixed activity in US yields and rising speculation that the Fed could slow the pace of future interest rate hike have all collaborated with the marked bounce in the yellow metal.
Next on the upside for gold comes the 200-wee SMA at $1,690 ahead of the September top at $1,735 (September 12) and the $1,765 level (August 25). Extra advance could see the critical $1,800 region revisited just followed by the August peak at $1,807 (August 10). The latter is underpinned by the proximity of the 200-day SMA at $1,805. Contrarily, a drop below the 2022 low at $1,614 (September 28) could prompt the round level at $1,600 to re-emerge on the horizon ahead of the April 2020 low at $1,572 (April 1).
Resistance levels: $1,681 $1,714 $1,729 (4H chart)
Support levels: $1,660 $1,641 6 $1,614 (4H chart)
-638032902713269004.png)
CRUDE WTI
Prices of the barrel of the American benchmark for the sweet light crude oil advanced more than 5% on Friday and clinched fresh 3-week peaks near the $93.00 mark. Following the recent price action, WTI ended the second week in a row in the positive territory.
The weaker tone in the greenback coupled with somewhat alleviated recession concerns – provided that the Fed will slow down the pace of its normalization process – and expectations that China could ease its COVID-zero policy in the short term also bolstered the upbeat mood in the commodity.
Also supporting the bullish performance of the WTI emerged the upcoming kick start of the EU ban on Russian crude oil (December 5).
In the calendar, driller Baker Hughes reported US oil rig count went up by 3 in the week to November 4, taking the total US active oil rigs to 613.
Immediately to the upside in WTI now appears the October high at $93.62 (October 10) followed by the weekly top at $97.65 (August 30). The trespass of the latter is expected to put the key 200-day SMA at $98.40 back on the traders’ radar prior to the psychological $100.00 mark per barrel. On the downside, interim support emerges at the 55-day SMA at $86.85 ahead of the weekly low at $82.10 (October 18) and the key $80.00 mark. The loss of this level could allow for losses to accelerate to the minor support at $79.16 (September 30) prior to the September low at $76.28 (September 26) and the 2022 low at $74.30 (January 3).
Resistance levels: $92.82 $93.62 $97.65 (4H chart)
Support levels: $87.58 $85.63 $84.14 (4H chart)
-638032903360427092.png)
DOW JONES
Equities gauged by the three major US stock indices advanced for the first time in the week on Friday.
Indeed, mixed results from the October Payrolls (+261K jobs), the deep retracement in the greenback and Fedspeak somehow leaning towards an impasse in the Fed’s hiking cycle in the not-so-distant future seem to have been enough to reignite the optimism among market participants and lift stocks at the end of the week.
All in all, the Dow Jones advanced 1.26% top 32,403, the S&P500 gained 1.36% to 3,770 and the tech-heavy Nasdaq Composite rose 1.28% to 10,475.
Dow Jones now faces the next up barrier at the 200-day SMA at 32,567 just ahead of the November peak at 33,071 (November 2). Further north turns up the 33,364 level (August 26) prior to the August peak at 34,281 (August 16) and the April high at 35,492. Alternatively, the November low at 31,727 (November 3) should offer initial support in case bears regain the upper hand ahead of the temporary 100- and 55-day SMAs at 31,426 and 31,062, respectively. A deeper decline could pave the way to a visit to the 30,206 level (October 21) ahead of the 2022 low at 28,660 (October 13). The daily RSI edged higher and surpassed 62.
Top Performers: Nike, Dow, Intel
Worst Performers: Salesforce Inc, UnitedHealth, Apple
Resistance levels: 33,071 33,364 34,281 (4H chart)
Support levels: 31,727 31,427 30,206 (4H chart)
-638032903739983132.png)
MACROECONOMIC EVENTS
All Information & Updates provided by:

All information relating to the financial markets available on this page has been prepared and issued by FXStreet (Forexstreet SL, Spain, Reg: B62498233) on the basis of publicly available information and all information believed to be reliable and does not conflict with Kuwaiti local laws, and all necessary care has been taken to before the company to ensure that the facts mentioned are correct from the source.
NCM Investment nor any of its directors or employees shall in any way be held responsible for the contents of this news, and the information contained on this page is intended only to provide clients with publicly available information and should not be construed as investment advice, report or analysis and/or constitute an offer or invitation to buy or sell financial instruments of any kind.
RISK WARNING: Forex and CFDs are highly risky leveraged products, as losses can exceed deposits. Please ensure you understand all the risks and take independent advice if necessary. NCM will segregate the clients based on the criteria of the regulator and its bylaws. NCM does not provide any advisory service; the material published does not constitute advice or a recommendation for a transaction in any financial instrument. NCM accepts no responsibility for any use of the content presented and any consequences of that use. Anyone acting on the information provided does so at their own risk.