
- Contact Us:
-

-

-

-


Daily Market Updates
08 Nov 2022
EURUSD
The continuation of the sell-off in the dollar helped EUR/USD clinch the second straight session with gains on Monday, this time trespassing the key parity level to print new multi-day peaks near 1.0030.
Indeed, the greenback remained entrenched in the negative territory, as market participants continued to adjust to the latest mixed results from US Payrolls (+261K jobs) as well as the probability of a Fed’s pivot in its monetary policy in the next months. Investors’ perception regarding the latter was also reinforced by recent Fedspeak (Barkin, Kashkari, Evans, Collins).
Monday’s strong advance in spot was also accompanied by mild gains in US yields across the curve and the German 10-year bund yields.
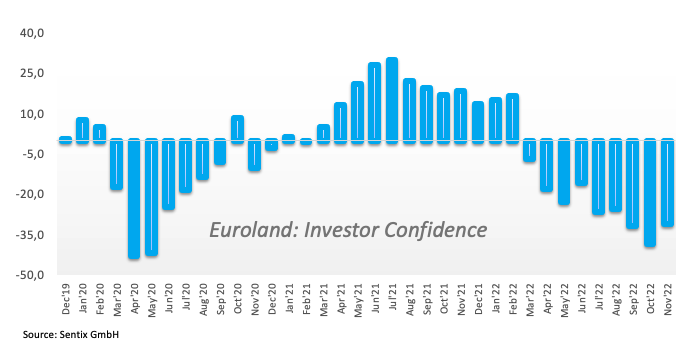
Looking at the calendar in the euro area, Germany’s Construction PMI rose to 43.8 in October (from 41.8) and the Sentix index in the broader euro bloc – which gauges the Investor Confidence – “improved” to -30.9 in November.
EUR/USD now needs to quickly leave behind the so far November top 1.0007 (November 7) to allow for a probable visit to the interim 100-day SMA at 1.0045 ahead of the October peak at 1.0093 (October 27). The surpass of this region could open the door to the September high at 1.0197 (September 12) prior to the August top at 1.0368 (August 10). By contrast, there is an immediate contention at the weekly low at 0.9730 (November 3) just ahead of another weekly low at 0.9704 (October 21). Down from here turns up the October low at 0.9631 (October 13) seconded by the 2022 low at 0.9535 (September 28). The daily RSI improved past the 56 yardstick.
Resistance levels: 1.0029 1.0093 1.0197 (4H chart)
Support levels: 0.9900 0.9815 0.9730 (4H chart)
-638034448455328330.png)
USDJPY
USD/JPY lost further ground and recorded new 3-day lows in the vicinity of the 146.00 neighbourhood on Monday, where the bearish move appears to have met some initial support.
Following the poor performance, the pair started its 4th consecutive week with losses, this time in line with further weakness in the dollar and despite a mild rebound in US yields across the curve.
The Japanese calendar was empty on Monday, leaving the attention to Tuesday’s Household Spending results and the BoJ Summary of Opinions.
A deeper pullback in USD/JPY is expected to revisit the weekly low at 145.10 (October 27) ahead of the October low at 143.52 (October 5) and another weekly low at 140.34 (September 22). In case bulls reinstate their case, there is an initial hurdle at the weekly peak at 148.84 (October 31) prior to the 2022 high at 151.94 (October 21) and the June 1990 peak at 155.80 (June 25). The daily RSI lost further ground and breached 50.
Resistance levels: 148.44 148.84 149.45 (4H chart)
Support levels: 146.41 145.66 145.10 (4H chart)
-638034449289246309.png)
GBPUSD
Monday’s session was dominated by the investors’ preference for the riskier assets, and in such a scenario the British pound managed to clinch its second daily advance vs. the greenback and propelled GBP/USD to 3-day highs north of the 1.1500 hurdle.
In fact, the greenback extended the deep retracement to the area of multi-session lows when measured by the USD Index (DXY) pari passu with rising speculation that the Federal Reserve might slow the pace of the upcoming rate hikes.
However, it is worth recalling that the recent upside momentum in Cable has been exclusively supported by dollar weakness and some relief in the UK political arena following the resignation of former PM L.Truss. The deteriorating economic outlook, upcoming recession and the divergence between markets and the BoE regarding the hiking cycle are expected to remain strong headwinds for the sterling for the time being.
In the UK, the Halifax House Price Index contracted 0.4% MoM in October and rose 8.3% over the last twelve months.
Extra upside in GBP/USD now targets the October high at 1.1645 (October 27) prior to the 100-day SMA at 1.1683 and the September top at 1.1738 (September 13). Once cleared, the pair could confront the weekly peak at 1.1900 (August 26) ahead of the psychological 1.2000 mark and the August high at 1.2293 (August 1). On the contrary, the so far November low at 1.1142 (November 4) should hold the initial bearish attempts before the weekly low at 1.1059 (October 21) and the October low at 1.0923 (October 12). The daily RSI rebounded beyond the 55 mark.
Resistance levels: 1.1541 1.1565 1.1623 (4H chart)
Support levels: 1.1290 1.1233 1.1142 (4H chart)
-638034448939231600.png)
AUDUSD
AUD/USD added to the optimism seen at the end of last week and advanced to 3-day highs to the area just pips away from the key 0.6500 the figure on Monday.
Following another negative session in the dollar, spot rose for the second session in a row despite the daily knee-jerk in copper prices and further side-lined trading in prices of the tonne of the iron ore.
There were no scheduled releases in Oz on Monday, although the Westpac Consumer Confidence Index will take centre stage on Tuesday.
Bulls in AUD/USD should still meet the immediate resistance at the weekly peak at 0.6522 (October 27) just followed by the October high at 0.6547 (October 3). If the pair breaks above the latter, it could pave the way for a test of the temporary 55- and 100-day SMAs at 0.6556 and 0.6716, respectively, prior to the September top at 0.6916 (September 13) and ahead of the psychological 0.7000 mark. On the flip side, there is an initial support at the 2022 low at 0.6169 (October 13) before the psychological 0.6000 level and prior to the April 2020 low at 0.5980 (April 3). The daily RSI dropped below the 53 level.
Resistance levels: 0.6492 0.6522 0.6547 (4H chart)
Support levels: 0.6399 0.6272 0.6210 (4H chart)
-638034449602092000.png)
GOLD
Prices of the ounce troy of the precious metal gave away part of Friday’s intense rebound and receded to the vicinity of $1,665 at the beginning of the week.
Another deep drop in the dollar failed to lend extra legs to the recent advance in the yellow metal, while the small improvement in US yields across the curve also collaborated with the daily retracement.
Moving forward, bullion is expected to remain wary in light of the release of US inflation figures measured by the CPI later in the week (Thursday) and its direct implication on the prospects for the Fed’s tightening cycle.
The so far November top at $1,681 (November 4,7) emerges as the next hurdle for gold ahead of the 200-week SMA at $1,692 and the September peak at $1,735 (September 12). Further north aligns the $1,765 level (August 25) prior to the critical $1,800 region and the August high at $1,807 (August 10), which appears bolstered by the proximity of the 200-day SMA at $1,804. Inversely, there is initial support at the 2022 low at $1,614 (September 28) followed by the round level at $1,600 and the April 2020 low at $1,572 (April 1).
Resistance levels: $1,681 $1,714 $1,729 (4H chart)
Support levels: $1,666 $1,641 6 $1,614 (4H chart)
-638034449946359308.png)
CRUDE WTI
Prices of the WTI rose to fresh 3-month highs around $93.70 per barrel at the beginning of the week. The bullish move, however, lacked follow through and triggered a mild correction soon afterwards.
Prices of the commodity wobbled around news regarding a potential re-opening of the Chinese economy in tandem with some easing of the current COVID-zero policy, which should see some renewed support for the demand of crude oil.
On the other hand, the omnipresent tight supply conditions of the market continued to limit occasional bearish moves along with the upcoming EU ban on Russian oil (December 5).
Later in the week, the API and the EIA will report on the weekly US crude oil supplies in the week to November 4 on Tuesday and Wednesday, respectively.
Prices of the WTI recorded a new monthly high at $93.73 (November 7). The breakout of this level could pave the way for a visit to the October top at $93.62 (October 10) ahead of the weekly peak at $97.65 (August 30). Above this level emerges the key 200-day SMA at $98.42 before the psychological $100.00 mark per barrel. Inversely, the 55-day SMA at $86.88 is expected to offer initial contention prior to the weekly low at $82.10 (October 18) and seconded by the key $80.00 mark. Below the latter comes the minor support at $79.16 (September 30) followed by the September low at $76.28 (September 26) and the 2022 low at $74.30 (January 3).
Resistance levels: $93.73 $97.65 $101.87 (4H chart)
Support levels: $90.39 $87.58 $85.82 (4H chart)
-638034450820119488.png)
DOW JONES
US stocks started the week in a positive foot and printed decent gains, as investors digested Friday’s Nonfarm Payrolls (+261K) against renewed prudence ahead of Tuesday’s midterm elections and the upcoming release of US inflation figures (Thursday).
The weaker dollar and the persevering risk-on trade also collaborated with the upbeat tone among investors on Monday.
That said, the Dow Jones gained 0.88% top 32,688, the S&P500 rose 0.32% to 3,782 and the tech-benchmark Nasdaq Composite advanced 0.08% to 10,483.
Immediately to the upside for Dow Jones remains the November high at 33,071 (November 2) followed by the 33,364 level (August 26). Extra gains from here could see the August high at 34,281 (August 16) revisited before the April top at 35,492. Contrarily, sellers face the initial barrier at the November low at 31,727 (November 3) prior to the interim 100- and 55-day SMAs at 31,446 and 31,044, respectively. The breach of the latter exposes the 30,206 level (October 21) prior to the 2022 low at 28,660 (October 13). The daily RSI advanced further and poked with 65.
Top Performers: Walgreen Boots, Boeing, Amgen
Worst Performers: Nike, Apple, Intel
Resistance levels: 33,071 33,364 34,281 (4H chart)
Support levels: 31,727 31,448 30,206 (4H chart)
-638034451189144980.png)
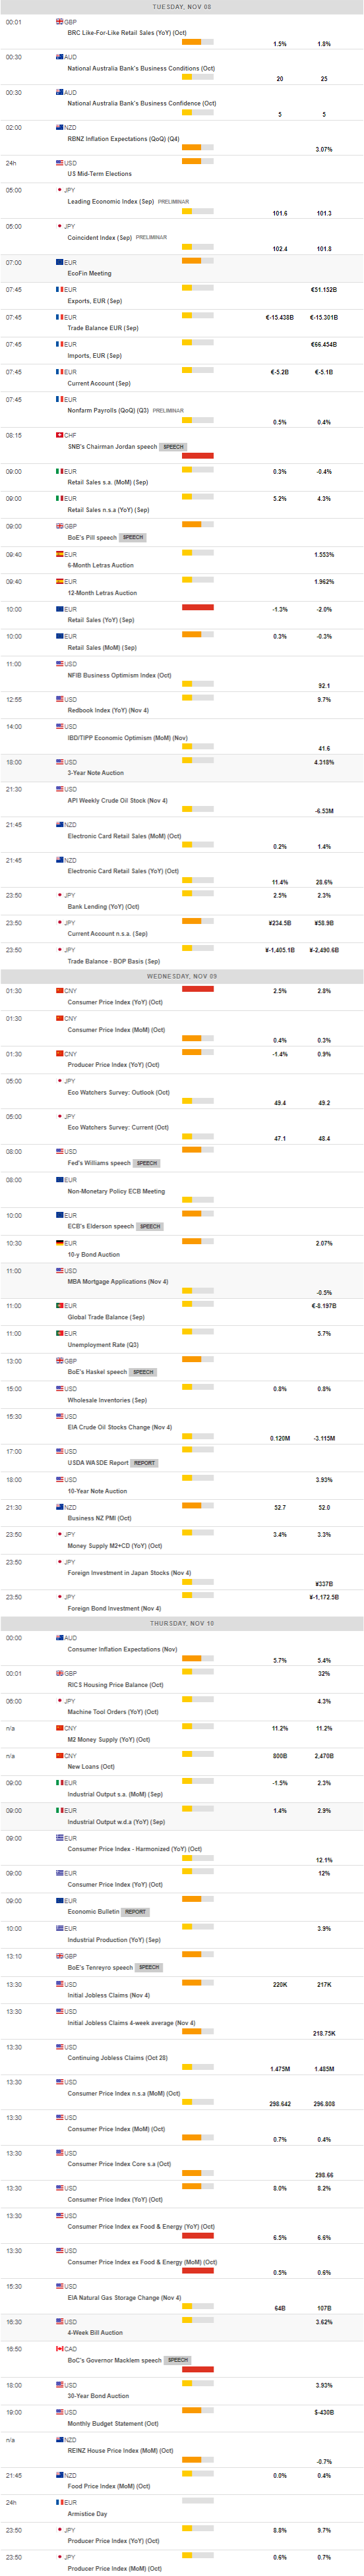
MACROECONOMIC EVENTS
All Information & Updates provided by:

All information relating to the financial markets available on this page has been prepared and issued by FXStreet (Forexstreet SL, Spain, Reg: B62498233) on the basis of publicly available information and all information believed to be reliable and does not conflict with Kuwaiti local laws, and all necessary care has been taken to before the company to ensure that the facts mentioned are correct from the source.
NCM Investment nor any of its directors or employees shall in any way be held responsible for the contents of this news, and the information contained on this page is intended only to provide clients with publicly available information and should not be construed as investment advice, report or analysis and/or constitute an offer or invitation to buy or sell financial instruments of any kind.
RISK WARNING: Forex and CFDs are highly risky leveraged products, as losses can exceed deposits. Please ensure you understand all the risks and take independent advice if necessary. NCM will segregate the clients based on the criteria of the regulator and its bylaws. NCM does not provide any advisory service; the material published does not constitute advice or a recommendation for a transaction in any financial instrument. NCM accepts no responsibility for any use of the content presented and any consequences of that use. Anyone acting on the information provided does so at their own risk.