
- Contact Us:
-

-

-

-


Daily Market Updates
09 Nov 2022
EURUSD
The greenback saw its decline intensify and dropped to levels last seen in mid-September around 109.30 when gauged by the USD Index (DXY).
Indeed, another negative session in the dollar lent extra legs to the risk complex and lifted EUR/USD to levels just below the 1.0100 region, poking at the same time with the October high.
No changes to the macro scenario, as investors were closely watching the developments from the US midterm elections amidst the sharp repricing of a potential Fed’s pivot emerging in the short-term horizon.
The third consecutive session with gains in the pair came along declining yields on both sides of the Atlantic, with the US 10-year benchmark retreating below 4.15% and the 10-year bund easing to 2.25%.
Supporting the sentiment surrounding the European currency, ECB Vice-President Luis de Guindos suggested that both headline and core inflation are expected to remain elevated, although he expects that inflation could start losing traction at some point by half 2023. In addition, he opened the door to a drop in economic activity in Q4 2022 followed by another negative GDP reading early in the next year. De Guindos stressed that quantitative tightening (QT) will surely start at some point in 2023. His colleague from the Bundesbank J.Nagel sees the German economy contracting in Q422/Q123 and favoured the continuation of rate hikes to tame inflation.
In the euro docket, Retail Sales in the broader Euroland contracted 0.6% YoY in September. In the US, the NFIB Business Optimism Index deteriorated a little to 91.3 in October (from 92.1) and the IBD/TIPP Economic Optimism deflated to 40.4 in November (from 41.6).
EUR/USD cleared the October high near 1.0100 and in doing so it has opened the door to a probable visit to the September top at 1.0197 (September 12) ahead of the August peak at 1.0368 (August 10), which precedes the critical 200-day SMA, today at 1.0456. On the downside, the 55-day SMA at 0.9888 offers interim contention ahead of the weekly low at 0.9730 (November 3) and another weekly low at 0.9704 (October 21). The loss of the latter exposes the October low at 0.9631 (October 13) before the 2022 low at 0.9535 (September 28). The daily RSI climbed further and trespassed 60.
Resistance levels: 1.0094 1.0197 1.0368 (4H chart)
Support levels: 0.9971 0.9820 0.9730 (4H chart)
-638035317732678259.png)
USDJPY
Further weakness in the greenback saw USD/JPY clinch the third consecutive session with losses, this time breaking below the 146.00 support with enough conviction.
The pair, in the meantime, navigates the fourth straight week in the negative territory and with risks clearly tilted to the downside against the current backdrop of fresh and strong dollar weakness.
Adding to the pair’s decline, US yields partially reversed the recent multi-session upside across the curve.
In Japan, the BoJ Summary of Opinions noted that there is no need to change the monetary course for the time being, although it warned against consequences of that policy stance. As per the report, inflation is likely to remain relatively high.
In the docket, Household Spending expanded 2.3% in the year to September and preliminary figures saw the Coincident Index at 101.1 in September and the Leading Economic Index at 97.4.
Further decline in USD/JPY is expected to challenge the weekly low at 145.10 (October 27) prior to the October low at 143.52 (October 5) and another weekly low at 140.34 (September 22). Occasional bullish attempts, in the meantime, could revisit the weekly high at 148.84 (October 31) seconded by the 2022 top at 151.94 (October 21) and the June 1990 high at 155.80 (June 25). The daily RSI deteriorated to the vicinity of 44.
Resistance levels: 146.58 146.93 147.56 (4H chart)
Support levels: 145.31 145.10 144.63 (4H chart)
-638035318370649950.png)
GBPUSD
GBP/USD knocked on the doors of the 1.1600 mark on turnaround Tuesday, flirting at the same time with 2-week highs, always on the back of further deterioration in the dollar’s price action.
On the latter, the greenback plummeted well south of the 110.00 mark when tracked by the USD Index (DXY), or multi-week lows amidst lower US yields and further speculation that the Fed could slow the pace of its rate hikes in the next months.
Once again, the BoE Chief Economist H.Pill was on the wires. This time he advocated for a tighter monetary policy at a time when he suggested that the economic outlook will determine the next decision on rates. Pill also said that the UK labour market remains tight while he expects headline inflation to lose traction in 2023. In general, he said, inflation risks remain tilted to the upside.
Data wise in the UK, the BEC Retail Sales Monitor rose 1.2% in the year to October in what was the only release of note on Tuesday.
GBP/USD trades at shouting distance from the October top at 1.1645 (October 27). The breakout of this level could see the 100-day SMA at 1.1677 revisited ahead of the September peak at 1.1738 (September 13). The surpass of the latter could put a test of the weekly high at 1.1900 (August 26) back on the investors’ radar prior to the psychological 1.2000 level and the August top at 1.2293 (August 1). On the flip side, sellers should meet initial support at the so far November low at 1.1142 (November 4) ahead of the weekly low at 1.1059 (October 21) and the October low at 1.0923 (October 12). The daily RSI bounced further and approached 57.
Resistance levels: 1.1599 1.1623 1.1645 (4H chart)
Support levels: 1.1429 1.1290 1.1239 (4H chart)
-638035318047910476.png)
AUDUSD
AUD/USD rose for the third session in a row and recorded new 2-month peaks well north of 0.6500 the figure on Tuesday.
The intense sell-off in the dollar coupled with diminishing yields lent much needed oxygen to the Aussie dollar and pushed spot to multi-week highs.
The weaker dollar also favoured the commodity complex and the generalized upbeat note in the latter underpinned further another positive day in the pair. Indeed, copper prices flirted with the key $3.70 mark and prices of the iron ore extended the gradual recovery for yet another session.
In Oz, the always key Consumer Confidence Index measured by Westpac worsened to 78 for the current month (from 83.7).
AUD/USD’s daily upside coincides with the 55-day SMA near 0.6550. North from here comes the temporary 100-day SMA at 0.6712 ahead of the September peak at 0.6916 (September 13) and prior to the psychological 0.7000 mark. By contrast, the November low at 0.6272 (November 3) should turn up as the next contention level of note seconded by the 2022 low at 0.6169 (October 13) and the psychological 0.6000 level. South from here emerges the April 2020 low at 0.5980 (April 3). The daily RSI moved higher past the 57 yardstick.
Resistance levels: 0.6551 0.6705 0.6747 (4H chart)
Support levels: 0.6444 0.6394 0.6272 (4H chart)
-638035318729781053.png)
GOLD
The intense selling pressure in the greenback allowed the yellow metal to climb to fresh multi-week highs past the $1,700 mark per ounce troy on turnaround Tuesday, an area last seen around a month ago.
Coupled with the exacerbated offered stance in the dollar appeared the corrective decline in US yields across the curve, which sustained further the upbeat mood in the precious metals’ galaxy and the dollar-denominated assets.
Moving forward, bullion faces the next risk event on Thursday, when the US inflation figures for the month of October are due.
Further upside in gold now retargets the October peak at $1,729 (October 4) just followed by the September high at $1,735 (September 12). The surpass of the latter could lead up to a potential visit to the $1,765 level (August 25) ahead of the critical $1,800 zone and the August top at $1,807 (August 10), which remains propped up by the 200-day SMA, today at $1,804. On the contrary, there are no support levels of note until the 2022 low at $1,614 (September 28) before the round level at $1,600 and the April 2020 low at $1,572 (April 1).
Resistance levels: $1,716 $1,729 $1,765 (4H chart)
Support levels: $1,661 $1,641 6 $1,614 (4H chart)
-638035319055151728.png)
CRUDE WTI
Prices of the barrel of the West Texas Intermediate (WTI) added to Monday’s decline and dropped to 2-day lows south of the key $90.00 mark on heightened concerns over rising COVID cases in China, practically ignoring another negative performance in the dollar.
Indeed, further restrictions in big Chinese cities undermined the weekly price action in crude oil and clouded hopes that the country could start easing the COVID-zero policy at some point in the next months (March 2023 likely).
Further prudence among traders came ahead of the release of US inflation figures measured by the CPI on Thursday, as persistent elevated inflation should underpin the Fed’s tightening bias and thus leave the possibility of a recession well in place.
Later on Tuesday, the API will report on the US crude oil stockpiles in the week to November 4 ahead of the EIA’s report on Wednesday.
The continuation of the corrective downside in prices of the WTI should see the next support at the 55-day SMA at $86.80 ahead of the weekly low at $82.10 (October 18) and the key $80.00 mark per barrel. If the latter is cleared, then the minor support at $79.16 (September 30) could emerge on the horizon prior to the September low at $76.28 (September 26) and the 2022 low at $74.30 (January 3). Contrarily, the November peak at $93.73 (November 7) is expected to offer initial resistance before the weekly high at $97.65 (August 30). North from here comes the key 200-day SMA at $98.43 ahead of the psychological $100.00 mark.
Resistance levels: $93.73 $97.65 $101.87 (4H chart)
Support levels: $89.28 $87.58 $86.07 (4H chart)
-638035319728161930.png)
DOW JONES
Equities tracked by the Dow Jones climbed to fresh 3-month highs past the 33,000 mark on Tuesday helped by the firmer optimism among investors and the broad-based risk-on sentiment.
In addition, the broader weakness hurt the dollar once again and lent extra legs to the risk complex amidst increasing cautiousness ahead of the results from the US midterm elections.
All in all, the Dow Jones gained 0.67% to 33,053, the S&P500 advanced 0.29% to 3,818 and the tech-heavy Nasdaq Composite rose 0.66% to 10,634.
Dow Jones advanced further and poked with the 33,364 level (August 26). If the index breaks above this level it could then challenge the August top at 34,281 (August 16) ahead of the April peak at 35,492. On the other hand, the November low at 31,727 (November 3) is expected to hold the initial bearish attempt prior to 100- and 55-day SMAs at 31,478 and 31,046, respectively. Extra losses could see the 30,206 level (October 21) revisited before the 2022 low at 28,660 (October 13). The daily RSI improved beyond the 67 level.
Top Performers: Amgen, Salesforce Inc, American Express
Worst Performers: Walgreen Boots, Walt Disney, Chevron
Resistance levels: 33,355 34,281 35,492 (4H chart)
Support levels: 31,727 31,480 30,206 (4H chart)
-638035320068766255.png)
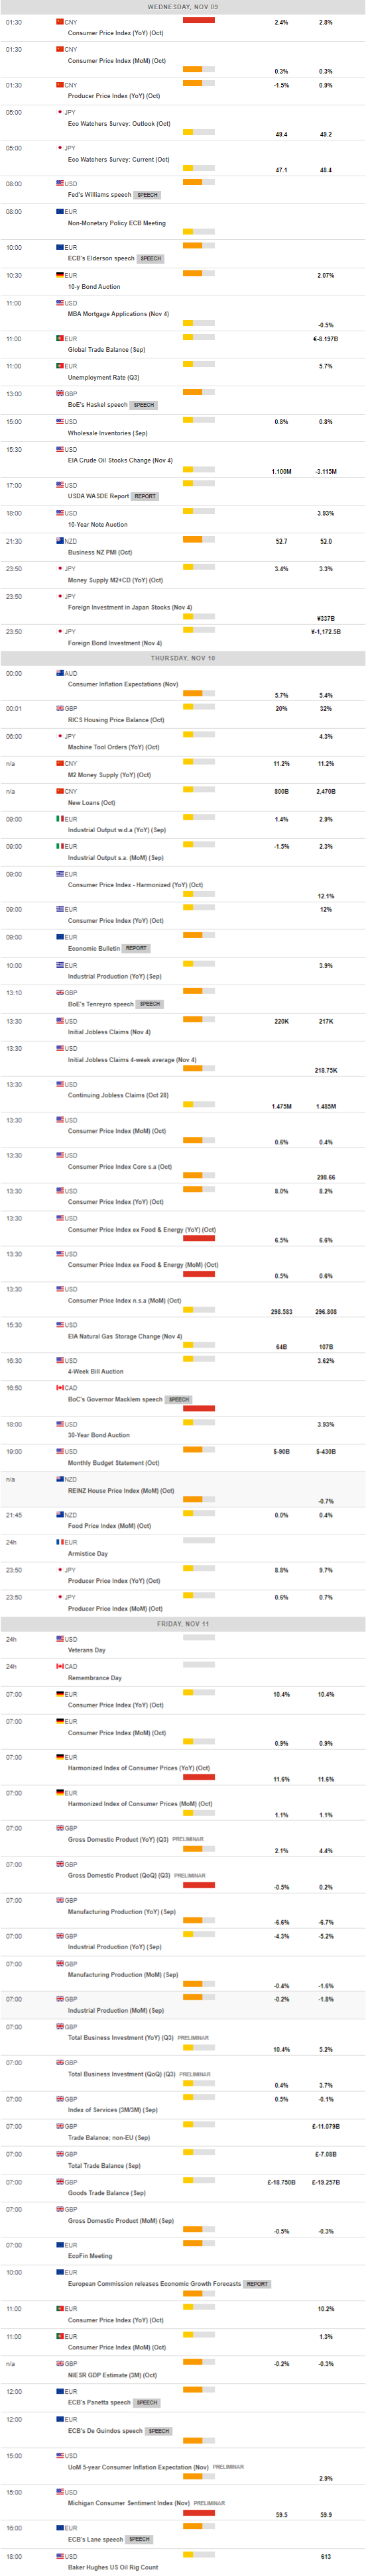
MACROECONOMIC EVENTS
All Information & Updates provided by:

All information relating to the financial markets available on this page has been prepared and issued by FXStreet (Forexstreet SL, Spain, Reg: B62498233) on the basis of publicly available information and all information believed to be reliable and does not conflict with Kuwaiti local laws, and all necessary care has been taken to before the company to ensure that the facts mentioned are correct from the source.
NCM Investment nor any of its directors or employees shall in any way be held responsible for the contents of this news, and the information contained on this page is intended only to provide clients with publicly available information and should not be construed as investment advice, report or analysis and/or constitute an offer or invitation to buy or sell financial instruments of any kind.
RISK WARNING: Forex and CFDs are highly risky leveraged products, as losses can exceed deposits. Please ensure you understand all the risks and take independent advice if necessary. NCM will segregate the clients based on the criteria of the regulator and its bylaws. NCM does not provide any advisory service; the material published does not constitute advice or a recommendation for a transaction in any financial instrument. NCM accepts no responsibility for any use of the content presented and any consequences of that use. Anyone acting on the information provided does so at their own risk.