
- Contact Us:
-

-

-

-


Daily Market Updates
10 Nov 2022
EURUSD
The inability of bulls to push EUR/USD beyond the 1.0100 region seems to have lured sellers in and forced the pair to surrender part of the recent 3-day strong advance on Wednesday, revisiting the key parity zone once again.
By the same token, the greenback managed to leave behind some of the recent pessimism and encouraged the USD Index (DXY) to reclaim the area above the 110.00 mark amidst the absence of traction in US yields across the curve and persistent uncertainty in the global markets.
Furthermore, prudence prevailed among market participants as the results from the US midterm elections were slowly arriving, all ahead of Thursday’s release of US inflation figures tracked by the CPI for the month of October.
In the euro docket, a German 10-year bund auction came at 2.25% in what was the sole scheduled release midweek. Across the pond, MBA Mortgage Applications contracted 0.1% in the week to November 4 and Wholesale Inventories expanded at a monthly 0.6% in September.
The continuation of the upside bias in EUR/USD now targets the September peak at 1.0197 (September 12) prior to the August high at 1.0368 (August 10) and the critical 200-day SMA, today at 1.0449. By contrast, there is a temporary support at the 55-day SMA at 0.9888 followed by the weekly low at 0.9730 (November 3) and another weekly low at 0.9704 (October 21). The breach of this level could put a test of the October low at 0.9631 (October 13) back on the investors’ radar ahead of the 2022 low at 0.9535 (September 28). The daily RSI dropped to the vicinity of 57.
Resistance levels: 1.0094 1.0197 1.0368 (4H chart)
Support levels: 0.9971 0.9827 0.9730 (4H chart)
-638036182100688727.png)
USDJPY
The recovery in the dollar coupled with the small advance in US yields across the curve seems to have been enough to motivate USD/JPY to reverse course and leave behind three consecutive sessions with losses on Wednesday.
Indeed, uncertainty ahead of the results from the US midterm elections and rising prudence among investors ahead of the release of US inflation figures measured by the CPI (Thursday) sparked fresh demand for the greenback and encouraged the USD Index (DXY) to reclaim the 110.00 mark and above midweek.
In Japan, the Reuters Tankan Index eased to 2 in November (from 5) and the Bank Lending expanded 2.7% in the year to October. In addition, the Eco Watchers Survey Current improved a tad to 49.9 in October (from 48.4) and the Eco Watchers Survey Outlook deflated to 46.4 (from 49.2).
In case sellers regain the initiative, USD/JPY could retest the weekly low at 145.10 (October 27) ahead of the 55-day SMA at 144.62. South from here emerges the October low at 143.52 (October 5) before another weekly low at 140.34 (September 22). Contrarily, there is an initial hurdle at the weekly top at 148.84 (October 31) prior to the 2022 peak at 151.94 (October 21) and the June 1990 high at 155.80 (June 25). The daily RSI leapt closer to the 50 region.
Resistance levels: 146.67 146.93 147.56 (4H chart)
Support levels: 145.17 145.10 144.63 (4H chart)
-638036182887665221.png)
GBPUSD
The marked rebound in the dollar weighed on the risk complex and put the recent upside momentum in the riskier assets to the test on Wednesday.
Furthermore, the British pound was no exception and GBP/USD shed nearly 2% and dropped to levels well south of the 1.1400 yardstick, recording at the same time 2-day lows and halting a 3-session positive streak.
There were no data releases in the UK calendar on Wednesday.
A deeper retracement could see GBP/USD revisiting the November low at 1.1142 (November 4) prior to the weekly low at 1.1059 (October 21) and the October low at 1.0923 (October 12). On the other hand, the October peak at 1.1645 (October 27) precedes the interim 100-day SMA at 1.1668, all before the September high at 1.1738 (September 13) and the weekly top at 1.1900 (August 26). The surpass of the latter could prompt the psychological 1.2000 mark to re-emerge on the horizon ahead of the August peak at 1.2293 (August 1). The daily RSI tumbled below the 49 yardstick.
Resistance levels: 1.1599 1.1623 1.1645 (4H chart)
Support levels: 1.1333 1.1290 1.1246 (4H chart)
-638036182455652492.png)
AUDUSD
Following three daily gains in a row, AUD/USD came under pressure on Wednesday on the back of the marked rebound in the greenback and declining US yields. Spot, therefore, shed more than a cent since Tuesday’s tops near 0.6550 to Wednesday’s lows near 0.6430.
Indeed, the cautious tone among market participants grew bigger amidst uncertainty surrounding the results from US midterm elections as well as the imminent release of US October’s CPI on Thursday, all morphing into extra support for the buck.
Also weighing on the Aussie dollar appeared the erratic performance of the commodity space (copper prices declined and iron ore prices stayed mostly unchanged) in combination with fresh lockdown measures in the Chinese economy in response to surging COVID cases.
Data wise Down Under, final figures saw Building Permits contract 5.8% MoM in September.
Extra recovery in AUD/USD faces an immediate barrier at the November peak at 0.6551 (November 8) prior to the interim 100-day SMA at 0.6707. The trespass of this level could open the door to the September high at 0.6916 (September 13) and before the psychological 0.7000 level. Just the opposite, there is an immediate support at the November low at 0.6272 (November 3) followed by the 2022 low at 0.6169 (October 13) and the psychological 0.6000 level. The daily RSI slipped back to the proximity of 50.
Resistance levels: 0.6551 0.6705 0.6747 (4H chart)
Support levels: 0.6424 0.6390 0.6272 (4H chart)
-638036183256840473.png)
GOLD
Quite a volatile session for the yellow metal, which ultimately dropped modestly to the boundaries of the key $1,700 mark per ounce troy.
The solid bounce in the dollar, flat-lined US yields across the curve, US midterm elections and upcoming US inflation figures all underpinned the directionless performance in the precious metal on Wednesday.
Furthermore, bullion is expected to closely follow the US CPI results on Thursday. If inflation pressures allayed somewhat in October, as consensus contemplates, then speculation of a Fed’s pivot could see its strength reinvigorated and thus lend further legs to bullion.
The October high at $1,729 (October 4) emerges as the immediate hurdle for gold bulls in the near term. The breakout of this region could motivate a visit to the September top at $1,735 (September 12) to start shaping up ahead of the $1,765 level (August 25) and the critical $1,800 zone. The August peak at $1,807 (August 10) is expected to come next prior to the 200-day SMA, today at $1,804. On the contrary, the big magnet for gold bears aligns at the 2022 low at $1,614 (September 28) ahead of the round level at $1,600 and the April 2020 low at $1,572 (April 1).
Resistance levels: $1,722 $1,729 $1,765 (4H chart)
Support levels: $1,664 $1,641 6 $1,614 (4H chart)
-638036183557745459.png)
CRUDE WTI
WTI prices dropped to multi-session lows near the $86.00 mark per barrel on Wednesday, clinching at the same time the third consecutive daily decline and almost fully fading the auspicious start of the month.
In fact, sentiment around crude oil deteriorated midweek in response to soaring COVID cases in China, which sparked a new round of lockdowns on Wednesday. In addition, the rebound in the dollar put the USD-denominated assets under stress while the unexpected build in weekly US crude oil inventories also collaborated with the daily retracement.
On the latter, the EIA reported that US crude oil inventories increased by 3.925M barrels in the week to November 4, while supplies at Cushing shrank by 0.923M barrels, distillates stocks dropped by 0.521M barrels and gasoline stockpiles went down by 0.899M barrels.
A deeper correction in the WTI should revisit the weekly low at $82.10 (October 18) ahead of the key $80.00 mark per barrel. Below this region emerges the minor support at $79.16 (September 30) before the September low at $76.28 (September 26) and the 2022 low at $74.30 (January 3). Bouts of strength, in the meantime, should initially target the November high at $93.73 (November 7) ahead of the weekly top at $97.65 (August 30). If the WTI clears this region, then a test of the key 200-day SMA at $98.41 could resurface on the horizon prior to the psychological $100.00 mark.
Resistance levels: $93.73 $97.65 $101.87 (4H chart)
Support levels: $86.23 $85.29 $82.62 (4H chart)
-638036184171611163.png)
DOW JONES
Uncertainty surrounding the final outcome of the US midterm elections weighed on investors’ sentiment and forced equites to shed further ground on Wednesday.
Additionally, rising prudence ahead of the release of the October’s US inflation figures also kept buyers at bay and helped in the corrective downside from Tuesday’s multi-week tops.
That said, the Dow Jones retreated 1.52% to 32,657, the S&P500 dropped 1.61% to 3,766 and the tech-benchmark Nasdaq Composite deflated 1.50% to 10,455.
The knee-jerk in the Dow Jones flirts with the 200-day SMA at 32,546. The loss of this key level could put a visit to the November low at 31,727 (November 3) back on the traders’ radar closely followed by the 100- and 55-day SMAs at 31,507 and 31,044, respectively. A deeper decline could target the 30,206 level (October 21) prior to the 2022 low at 28,660 (October 13). Inversely, the initial up barrier comes at the November top at 33,355 (November 8) just ahead of the 33,364 level (August 26) and prior to the August peak at 34,281 (August 16). The surpass of this level exposes a move to the April high at 35,492. The daily RSI dropped below the 62 level.
Top Performers: Merck&Co, Procter&Gamble, J&J
Worst Performers: Walt Disney, Dow, Visa A
Resistance levels: 33,355 34,281 35,492 (4H chart)
Support levels: 31,727 31,494 30,206 (4H chart)
-638036184460299122.png)
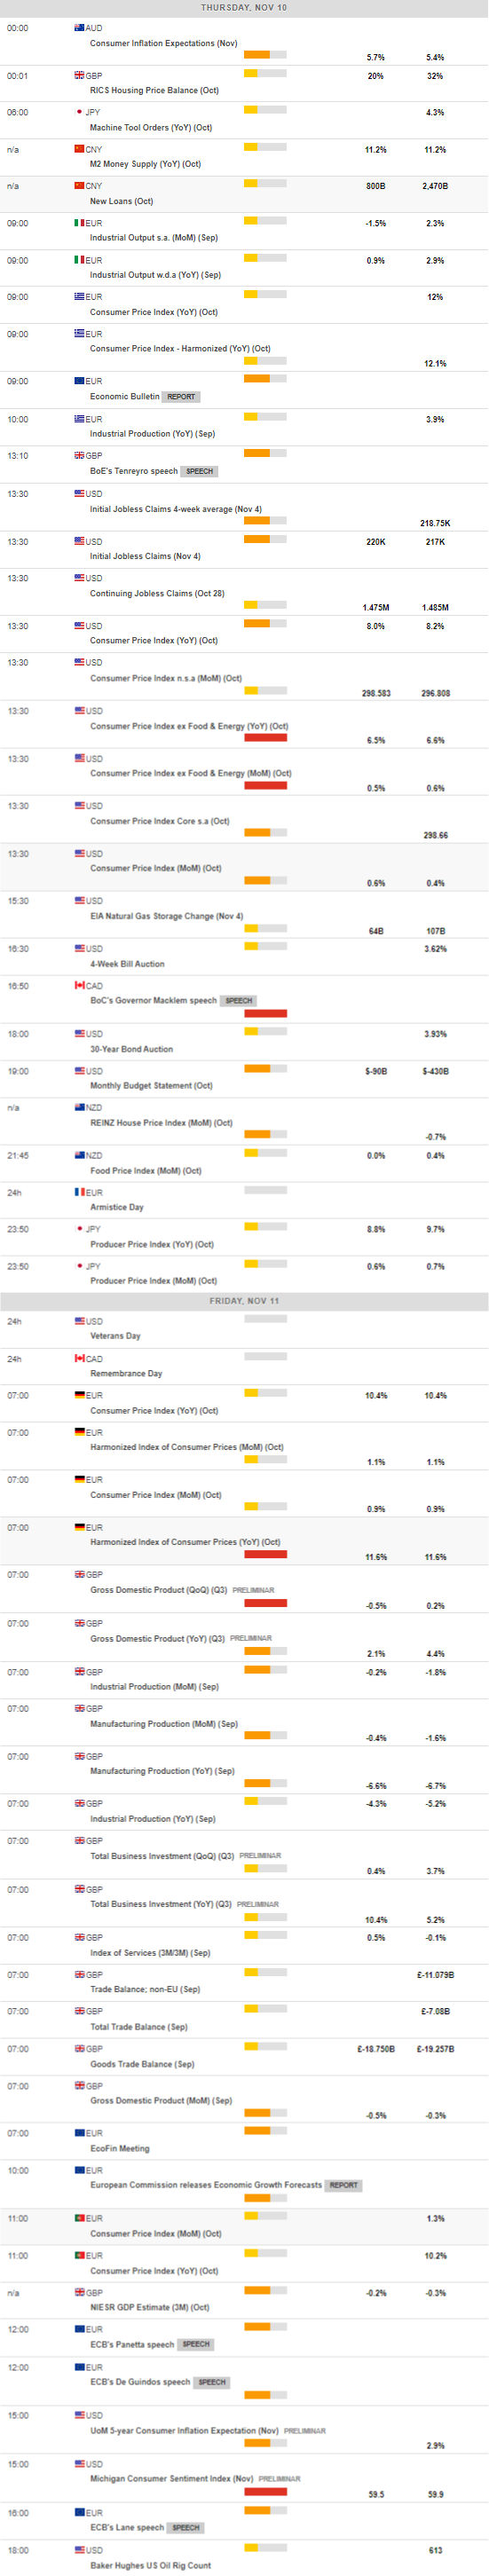
MACROECONOMIC EVENTS
All Information & Updates provided by:

All information relating to the financial markets available on this page has been prepared and issued by FXStreet (Forexstreet SL, Spain, Reg: B62498233) on the basis of publicly available information and all information believed to be reliable and does not conflict with Kuwaiti local laws, and all necessary care has been taken to before the company to ensure that the facts mentioned are correct from the source.
NCM Investment nor any of its directors or employees shall in any way be held responsible for the contents of this news, and the information contained on this page is intended only to provide clients with publicly available information and should not be construed as investment advice, report or analysis and/or constitute an offer or invitation to buy or sell financial instruments of any kind.
RISK WARNING: Forex and CFDs are highly risky leveraged products, as losses can exceed deposits. Please ensure you understand all the risks and take independent advice if necessary. NCM will segregate the clients based on the criteria of the regulator and its bylaws. NCM does not provide any advisory service; the material published does not constitute advice or a recommendation for a transaction in any financial instrument. NCM accepts no responsibility for any use of the content presented and any consequences of that use. Anyone acting on the information provided does so at their own risk.