
- Contact Us:
-

-

-

-


Daily Market Updates
11 Nov 2022
EURUSD
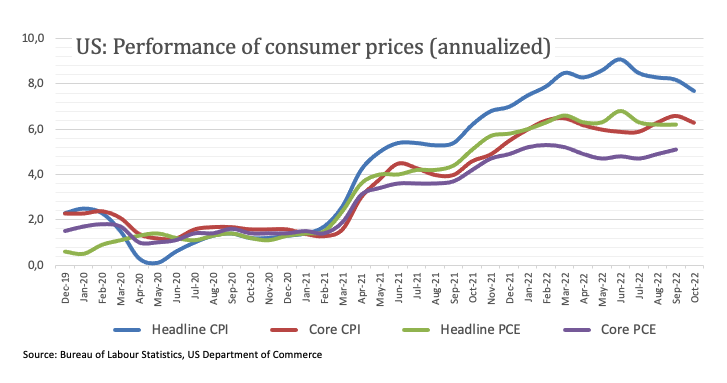
EUR/USD gathered unexpected upside traction and climbed to fresh multi-week highs past 1.0180 in response to the acute sell-off in the greenback, particularly exacerbated after US inflation figures tracked by the CPI came in lower than estimated in October.
On the latter, the headline CPI rose at an annualized 7.7% in October and 0.4% vs. the previous month. The Core CPI – which excludes Food and Energy costs – also surprised to the downside after climbing 6.3% over the last twelve months.
US yields went down and the dollar plummeted to new 8-week lows in the area last seen back in mid-September near 108.20 in tandem with rising speculation that the Federal Reserve might slow the pace of the rate path in the near term, the so-called pivot.
Additional data in the US docket saw Initial Jobless Claims rise by 225K in the week to November 5 and the Monthly Budget Statement shrank to $88B in October.
Data wise on this side of the Atlantic, Industrial Production in Italy contracted at a monthly 1.8% in September and 0.5% vs. the same month in 2021.
Immediately to the upside in EUR/USD now emerges the September top at 1.0197 (September 12). Once cleared, the August peak at 1.0368 (August 10) could re-emerge on the horizon prior to the critical 200-day SMA, today at 1.0442. On the flip side, the 55-day SMA at 0.9888 is expected to offer interim contention ahead of the weekly low at 0.9730 (November 3) and another weekly low at 0.9704 (October 21). South from here aligns the October low at 0.9631 (October 13) seconded by the 2022 low at 0.9535 (September 28). The daily RSI picked up pace and surpassed the 62 level.
Resistance levels: 1.0185 1.0197 1.0368 (4H chart)
Support levels: 0.9935 0.9835 0.9730 (4H chart)
-638037047467217706.png)
USDJPY
USD/JPY collapsed more than 3% to the 141.50 region, or 7-week lows, on Thursday in response to the sharp sell-off in the dollar and declining US yields across the curve.
Indeed, yields rapidly dropped to multi-session lows after the US CPI rose less than expected in October, opening the door at the same time to a potential Fed’s pivot in its rate path in the next months.
From the BoJ, Governor H.Kuroda suggested that a rate increase woul be detrimental to the economy and added that negative rates could be reduced if needed, at the time when he said that the bank is not at a point where the details of an exit strategy could be debated. Kuroda also noted that the 2% inflation target could be achieved, although it may take some time (like… forever?). Back to the issue of normalizing its monetary conditions, the discussion could begin once inflation hits the bank’s goal along with wage increases.
In the Japanese calendar, Foreign Bond Investment shrank to ¥581.8B in the week to November 5.
The sharp decline in USD/JPY now opens the door to a probable visit to the weekly low at 140.34 (September 22). The loss of the latter leaves the pair vulnerable to extra downside to, initially, the key 200-day SMA at 132.60 ahead of the August low at 130.39 (August 2). By contrast, the weekly peak at 148.84 (October 31) offers initial resistance prior to the 2022 high at 151.94 (October 21) and the June 1990 high at 155.80 (June 25). The daily RSI plummeted to the sub-34 region.
Resistance levels: 146.79 147.56 148.44 (4H chart)
Support levels: 141.46 140.34 138.05 (4H chart)
-638037048154566146.png)
GBPUSD
Once again, another negative session in the dollar sponsored a fresh wave of buying pressure in the risk complex and catapulted GBP/USD to fresh 2-month highs just below 1.1700 the figure on Thursday.
In fact, the weak tone in the greenback seems to have consolidated after US inflation figures rose less than initially estimated during October, sparking at the same time fresh speculation of a Fed’s pivot in its current normalization of its monetary conditions.
The UK calendar only showed the RICS House Price Balance contract 2.0% in October.
Extra strength in GBP/USD could now visit the September top at 1.1738 (September 13) prior to the weekly peak at 1.1900 (August 26). If Cable surpasses this region, it could then confront the psychological 1.2000 mark before the August high at 1.2293 (August 1). On the other hand, further downside could see the November low at 1.1142 (November 4) retested, while a breach of this level could put the weekly low at 1.1059 (October 21) back on the investors’ radar prior to the October low at 1.0923 (October 12). The daily RSI edged improved further and poked with the 58 yardstick
Resistance levels: 1.1686 1.1738 1.1900 (4H chart)
Support levels: 1.1333 1.1267 1.1142 (4H chart)
-638037047880493918.png)
AUDUSD
Accompanying the generalized optimism in the risk-associated universe, AUD/USD accelerated its gains and climbed to new 2-month highs in the proximity of the 0.6600 hurdle on Thursday.
The steep retracement in the dollar following disappointing US inflation figures lent much needed legs to the appetite for the riskier assets and underpinned the strong rebound in the Aussie dollar, which also derived further support from the upbeat tone in the commodity complex.
In the Australian calendar, Consumer Inflation Expectations rose to 6.0% in November (from 5.4%).
Next on the upside for AUD/USD comes the temporary 100-day SMA at 0.6703 ahead of the more relevant September top at 0.6916 (September 13), which precedes the psychological 0.7000 mark. On the contrary, the November low at 0.6272 (November 3) remains the initial magnet for bears seconded by the 2022 low at 0.6169 (October 13) and the psychological 0.6000 level. The daily RSI gathered extra pace and flirted with the 59 level.
Resistance levels: 0.6597 0.6705 0.6747 (4H chart)
Support levels: 0.6388 0.6272 0.6210 (4H chart)
-638037048463847487.png)
GOLD
Gold prices quickly left behind Wednesday’s daily drop and advanced markedly to the $1,750 region per ounce troy, an area last traded back in late August.
The collapse in the dollar following another drop in US inflation figures lent extra oxygen to the yellow metal and its USD-denominated peers on Thursday, all accompanied at the same time by the sharp correction in US yields.
Moving forward, the likelihood of a Fed’s pivot could begin to be discussed as soon as at the Fed’s December event and this is expected to keep weighing on the dollar, and therefore remaining a key driver supporting further gains in bullion for the time being.
Immediately to the upside in gold now aligns the $1,765 level (August 25) prior to the critical $1,800 zone, which precedes the August high at $1,807 (August 10). This region also appears bolstered by the proximity of the 200-day SMA, today at $1,803. Just the opposite, there is an interim support at the 55-day SMA at $1,678 ahead of the 2022 low at $1,614 (September 28). South from here comes the round level at $1,600 before the April 2020 low at $1,572 (April 1).
Resistance levels: $1,753 $1,765 $1,807 (4H chart)
Support levels: $1,702 $1,664 $1,616 6 (4H chart)
-638037048761188906.png)
CRUDE WTI
Prices of the barrel of the WTI posted decent gains and briefly surpassed the $87.00 mark on Thursday, managing at the same time to reverse three consecutive daily drops in a row.
The intense sell-off in the greenback somewhat eclipsed persistent demand concerns exclusively stemming from recent lockdown measures in China, all in response to the late surge in COVID cases.
The recent weakness in the commodity was also exacerbated after US crude oil supplies unexpectedly rose by nearly 4M barrels in the week to November 4, as per the latest report by the EIA published earlier in the week.
Prices of the WTI remain under pressure and could extend the retracement to the weekly low at $82.10 (October 18) prior to the key $80.00 mark per barrel. The loss of this level could prompt the minor support at $79.16 (September 30) to emerge on the horizon ahead of the September low at $76.28 (September 26) followed by the 2022 low at $74.30 (January 3). On the contrary, the November top at $93.73 (November 7) turns up as the initial up barrier before the weekly peak at $97.65 (August 30). North from here aligns the key 200-day SMA at $98.40 ahead of the psychological $100.00 mark.
Resistance levels: $87.31 $93.73 $97.65 (4H chart)
Support levels: $84.70 $82.62 $82.06 (4H chart)
-638037049452266557.png)
DOW JONES
Shrinking inflation pressure boosted the sentiment among market participants and motivated equities to advance strongly on Thursday. That said, the Dow Jones climbed to 3-month highs, while the S&P500 rose to 8-week peaks and the Nasdaq flirted with monthly tops.
The abrupt move higher in the three major US stock indices came in response to lower-than-expected US inflation figures during October, which in turn propped up speculation that the Fed might start debating the size of the next interest rate hikes.
From the tech sector, positive news from online giant Amazon also lent extra legs to the Nasdaq and collaborated with broader optimism.
All in all, the Dow Jones advanced 3.09% to 33,525, the S&P500 rose 4.67% to 3,923 and the tech-reference Nasdaq Composite gained 6.13% to 10,986.
Dow Jones charted a new 3-month peak at 33,549 and further strength now looks at a test of the August high at 34,281 (August 16) prior to the April top at 35,492. In the opposite direction, the key 200-day SMA at 32,541 is seen offering initial contention before the November low at 31,727 (November 3) and the 100- and 55-day SMAs at 31,535 and 31,049, respectively. A deeper drop could see the 30,206 level (October 21) revisited ahead of the 2022 low at 28,660 (October 13). The daily RSI confirmed the uptick in the index and advanced to the 67 area.
Top Performers: Salesforce Inc, Home Depot, Microsoft
Worst Performers: McDonald’s, Amgen, Merck&Co
Resistance levels: 33,549 34,281 35,492 (4H chart)
Support levels: 31,727 31,522 30,206 (4H chart)
-638037049827989557.png)
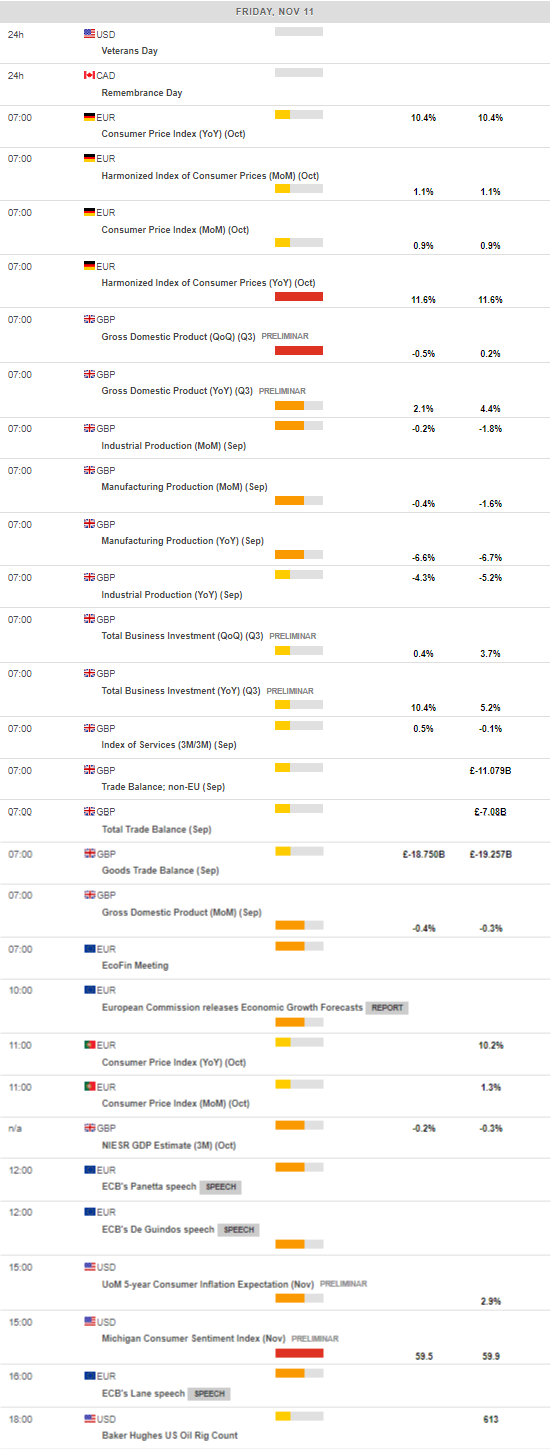
MACROECONOMIC EVENTS
All Information & Updates provided by:

All information relating to the financial markets available on this page has been prepared and issued by FXStreet (Forexstreet SL, Spain, Reg: B62498233) on the basis of publicly available information and all information believed to be reliable and does not conflict with Kuwaiti local laws, and all necessary care has been taken to before the company to ensure that the facts mentioned are correct from the source.
NCM Investment nor any of its directors or employees shall in any way be held responsible for the contents of this news, and the information contained on this page is intended only to provide clients with publicly available information and should not be construed as investment advice, report or analysis and/or constitute an offer or invitation to buy or sell financial instruments of any kind.
RISK WARNING: Forex and CFDs are highly risky leveraged products, as losses can exceed deposits. Please ensure you understand all the risks and take independent advice if necessary. NCM will segregate the clients based on the criteria of the regulator and its bylaws. NCM does not provide any advisory service; the material published does not constitute advice or a recommendation for a transaction in any financial instrument. NCM accepts no responsibility for any use of the content presented and any consequences of that use. Anyone acting on the information provided does so at their own risk.