
- Contact Us:
-

-

-

-


Daily Market Updates
16 Nov 2022
EURUSD
Sudden geopolitical concerns emerged after news cited stray Russian missiles landed in Poland, near the Ukraine border. The news sparked a massive U-turn in the global markets and shifted the sentiment towards risk aversion.
Indeed, the news motivated EUR/USD to quickly return to the negative territory and below the 1.0300 mark after climbing as high as the 1.0480 region earlier in Monday's session.
The dollar managed to trim most of the initial sharp pullback soon after the news hit the markets, encouraging the USD Index (DXY) to regain the upper 106.00s after bottoming out in the 105.35/30 band for the first time since early August.
The pullback in the greenback also came along with another daily drop in US yields across the curve, while investors continued to reprice the likeliness of a Fed’s pivot in the short-term horizon.
It is worth noting that the latter scenario was also underpinned by Monday’s comments from Vice Chair L.Brainard at her discussion on the “Economic Outlook”, where she deemed appropriate to slow the pace of the current rate path.
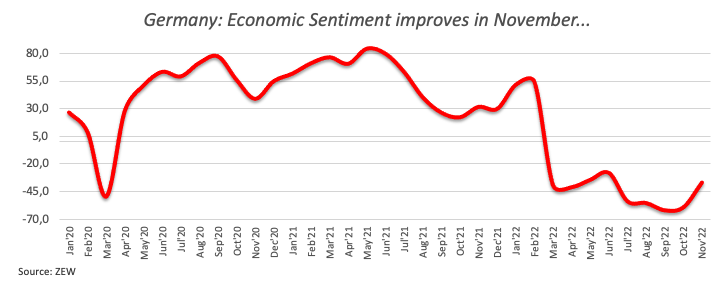
Initial extra legs for the European currency also came from the improvement in the Economic Sentiment measured by the ZEW Institute to -36.7 and -38.7 in both Germany and the Euroland, respectively, for the current month. Still in the euro area, another revision expects the GDP to have expanded 0.2% QoQ in Q3 and 2.1% over the last twelve months. In addition, the trade deficit in the region shrank to €34.4B in September.
In the US data space, Producer Prices rose less than estimated 0.2% MoM in October and 8% from a year earlier and the NY Empire State Manufacturing Index ticked higher to 4.5 in November (from 9.1).
In light of the current price action, a close above the key 200-day SMA at 1.0427 should shift the outlook for EUR/USD to the bullish side. That said, there are no relevant resistance levels before the weekly high at 1.0614 (June 27) followed by the June top at 1.0773 (June 9) and the May peak at 1.0786 (May 30). By contrast, the temporary 100- and 55-day SMAs at 1.0026 and 0.9912, respectively, should offer initial support ahead of the weekly low at 0.9730 (November 3) and another weekly low at 0.9704 (October 21). The daily RSI receded to the vicinity of the 65 region.
Resistance levels: 1.0480 1.0614 1.0773 (4H chart)
Support levels: 1.0271 0.9935 0.9879 (4H chart)
-638041373787947324.png)
USDJPY
Declining US yields across the curve along with the initial drop in the greenback depressed USD/JPY to levels last traded in late August near 137.60 on Tuesday, although it regained some ground on the back of the late bounce in the dollar.
In fact, dovish Fedspeak (Brainard, Waller) and lower-than-expected US Producer Prices propped up further the already rising speculation that the Fed could slow the pace of its future interest rate hikes, which eventually hurt the buck and sponsored fresh lows in the pair.
Quite an interesting day in the Japanese docket after flash Q3 GDP figures showed the economy is now expected to contract 0.3% QoQ and 1.2% on a yearly basis. In addition, final prints saw Industrial Production expand 9.6% in September vs. the same month of 2021.
Further weakness in USD/JPY should breach the November low at 137.65 (November 15) to accelerate losses to the weekly low at 135.80 (August 23) and the key 200-day SMA at 132.95. If spot drops below this region, it could prompt the August low at 130.39 (August 2) to re-emerge on the horizon. On the contrary, the 55-day SMA at 144.85 is predicted to offer initial support ahead of the weekly peak at 148.84 (October 31) and the 2022 high at 151.94 (October 21). The daily RSI flirted once again with the oversold territory near 30.
Resistance levels: 140.79 142.48 146.31 (4H chart)
Support levels: 137.66 136.9 135.80 (4H chart)
-638041375198154333.png)
GBPUSD
The abrupt retracement in the dollar once again sponsored another equally strong uptick in GBP/USD, this time to levels beyond the psychological 1.2000 mark on Tuesday. Cable, however, gave away much of that initial advance in response to the recovery in the dollar following the resumption of the risk aversion after news of Russian missiles hit Polish soil.
Further repricing of the Fed’s potential shift to a more dovish approach of its normalization process initially depressed the dollar and dragged the USD Index (DXY) to multi-month lows, bolstering at the same time the optimism in the risk complex.
In the meantime, the pair managed well to weather a disappointing UK’s labour market report after the Employment Change shrank by 52K persons in August and the Unemployment Rate rose a tad to 3.6% in September. Further results saw Average Earnings inc. Bonus expanded 6% YoY in the three months to September and the Claimant Count Change rose by 3.3K people in October.
The surpass of the November top at 1.2028 (November 15) should motivate GBP/USD to confront the August peak at 1.2293 (August 1) ahead of the weekly high at 1.2405 (June 16). On the flip side, the initial support emerges at the 100-day SMA at 1.1649 followed by the 55-day SMA at 1.1364 and the November low at 1.1142 (November 4). South from here appears the weekly low at 1.1059 (October 21) before the October low at 1.0923 (October 12). The daily RSI edged higher past the 60 yardstick.
Resistance levels: 1.2028 1.2142 1.2276 (4H chart)
Support levels: 1.1709 1.1359 1.1333 (4H chart)
-638041374583380014.png)
AUDUSD
AUD/USD revisited the boundaries of 0.6800 the figure on Tuesday, an area last seen back in mid-September.
Indeed, spot extended the upbeat tone and continued to navigate the 5th consecutive week with gains, always on the back of the renewed and acute pullback in the dollar and persistent speculation of some easing in the Chinese COVID-zero policy.
Extra gains in the Aussie dollar came despite copper prices remained on the defensive so far this week, while prices of the iron ore extended the snail-pace uptick for yet another session.
In Oz, the RBA Minutes showed the bank’s decisions on the OCR remain data dependent, while there was quite an intense discussion about a 25 bps or 50 bps increase. In addition, members did not rule out an impasse in the hiking cycle to assess the state of the economy going forward. The Minutes also noted that the Board expects further rate raises in the future, although these are not on a pre-set path.
Still around the RBA, the review of forward guidance suggested that this will not always be provided. In addition, and while the bank will continue to publish its forecasts of the economic outlook, it will not intend to report projections of the expected rate path.
Once the November high at 0.6797 (November 15) is cleared, then AUD/USD could challenge the September high at 0.6916 (September 13) ahead of the 200-day SMA at 0.6952 and the psychological 0.7000 level. Contrarily, the 55-day SMA is predicted to offer interim contention at 0.6525 ahead of the weekly low at 0.6386 (November 10) and the November low at 0.6272 (November 3). The loss of this level exposes the 2022 low at 0.6169 (October 13) prior to the psychological 0.6000 level. The daily RSI picked up pace and approached the 66 mark.
Resistance levels: 0.6797 0.6916 0.6956 (4H chart)
Support levels: 0.6663 0.6409 0.6386 (4H chart)
-638041375770238289.png)
GOLD
Gold prices managed to surpass the $1,780 level per ounce troy on Tuesday, although the move lacked support and eventually forced the yellow metal to give away part of those gains and return to the area of Monday’s close near $1,770.
The precious metal failed to capitalize on another decline in the dollar and a tepid pullback in US yields across the curve, leaving the weekly performance flat so far and down around 3% since January.
The renewed offered stance in the greenback this time followed dovish Fedspeak after FOMC’s Waller (over the weekend) and Brainard (on Monday) advocated for a slower pace of future interest rate raises.
The new November peak at $1,786 (November 15) now emerges as the initial hurdle for Gold bulls ahead of the critical $1,800 zone, which remains underpinned by the key 200-day SMA at $1,803. An advance beyond the latter should put a test of the August high at $1,807 (August 10) back on the radar in the near term. Just the opposite, the 55- and 100-day SMAs at $1,714 and $1,681, respectively, are expected to offer initial support prior to the 2022 low at $1,614 (September 28) and the round level at $1,600.
Resistance levels: $1,786 $1,807 $1,814 (4H chart)
Support levels: $1,753 $1,702 $1,676 (4H chart)
-638041376403348113.png)
CRUDE WTI
WTI prices advanced markedly after bottoming out in the vicinity of the $84.00 mark per barrel on Tuesday, or 3-week lows.
As usual, demand concerns exclusively stemming from China and the recent surge of COVID cases weighed once again on traders’ sentiment, while the omnipresent tight supply condition of the market appears to have lent some support to crude oil prices.
Also supporting the uptick in prices of the commodity appeared the geopolitical factor, this time following news of Russian missiles landing in Poland.
Later in the NA session, the American Petroleum Institute will report on US crude oil inventories in the week to November 11.
Prices of the WTI now faces the immediate support at the November low at $84.07 (November 15). A deeper drop could see the weekly low at $82.10 (October 18) retested ahead of the key $80.00 mark. Further decline could revisit the minor support at $79.16 (September 30) before the September low at $76.28 (September 26) and prior to the 2022 low at $74.30 (January 3). There are no changes to the topside, as the November high at $93.73 aligns as the initial hurdle ahead of the weekly peak at $97.65 (August 30). The surpass of the latter could open the door to the key 200-day SMA at $98.33 just before the psychological $100.00 mark per barrel.
Resistance levels: $88.65 $90.08 $93.73 (4H chart)
Support levels: $84.04 $82.62 $82.06 (4H chart)
-638041377187936970.png)
DOW JONES
US stocks tracked by the three major indices edged higher on Tuesday and managed to regain composure following renewed geopolitical jitters that prompte an initial knee-jerk in equities.
The move higher in stocks came on the back of firmer conviction that the Federal Reserve could slow the pace of future interest rate hikes under the current normalization of its monetary conditions.
Indeed, the above was further underpinned by lower-than-expected US Producer Prices during October, which added to the view that inflation is losing traction, as per last week’s CPI results.
In addition, investors continued to assess Monday’s dovish comments from Vice Chair L.Brainard, who defended a more cautious stance and therefore put the dollar under extra pressure once again on turnaround Tuesday.
All in all, the Dow Jones gained 0.09% to 33,563, the S&P500 advanced 0.80% to 3,989 and the tech-heavy Nasdaq Composite rose 0.66% to 11,271.
Dow Jones approached the 34,000 hurdle. There is an initial barrier at the November peak at 33,987 (November 15) ahead of the August high at 34,281 (August 16) and the April top at 35,492. Bears, in the meantime, should look at the key 200-day SMA at 32,528 as the initial contention prior to the November low at 31,727 (November 3) and the 100- and 55-day SMAs at 31,621 and 31,115, respectively. If the index breaches this zone, it could then prompt the 30,206 level (October 21) to emerge on the horizon before the 2022 low at 28,660 (October 13). The daily RSI hovered around the 67 mark.
Top Performers: Walmart, Salesforce Inc, Nike
Worst Performers: UnitedHealth, McDonald’s, Travelers
Resistance levels: 33,987 34,281 35,492 (4H chart)
Support levels: 32,478 31,727 31,613 (4H chart)
-638041377509134007.png)
MACROECONOMIC EVENTS
All Information & Updates provided by:

All information relating to the financial markets available on this page has been prepared and issued by FXStreet (Forexstreet SL, Spain, Reg: B62498233) on the basis of publicly available information and all information believed to be reliable and does not conflict with Kuwaiti local laws, and all necessary care has been taken to before the company to ensure that the facts mentioned are correct from the source.
NCM Investment nor any of its directors or employees shall in any way be held responsible for the contents of this news, and the information contained on this page is intended only to provide clients with publicly available information and should not be construed as investment advice, report or analysis and/or constitute an offer or invitation to buy or sell financial instruments of any kind.
RISK WARNING: Forex and CFDs are highly risky leveraged products, as losses can exceed deposits. Please ensure you understand all the risks and take independent advice if necessary. NCM will segregate the clients based on the criteria of the regulator and its bylaws. NCM does not provide any advisory service; the material published does not constitute advice or a recommendation for a transaction in any financial instrument. NCM accepts no responsibility for any use of the content presented and any consequences of that use. Anyone acting on the information provided does so at their own risk.