
- Contact Us:
-

-

-

-


Daily Market Updates
17 Nov 2022
EURUSD
EUR/USD added to Tuesday’s decent advance and once again surpassed the 1.0400 barrier, although this time seemed a more convincing breakout so far amidst the firmer tone in the risk complex.
In the meantime, persevering weakness continued to hurt the buck and forced the USD Index (DXY) to revisit the sub-106.00 region, or multi-month lows, amidst erratic performance in US yields across the curve.
In the domestic calendar, final inflation figures in Italy saw the CPI rise 11.8% YoY in October. Additionally, the ECB published its Financial Stability Review and it sees financial stability risks on the rise, while interest rate hikes are weighing more heavily on public finances. In addition, the review noted that real-estate markets could be at a turning point at the time when some asset prices still appear stretched.
In the US, another interesting session saw MBA Mortgage Applications expand 2.7% in the week to November 11. In addition, Retail Sales expanded at a monthly 1.3% in October and Industrial Production contracted 0.1% MoM in the same month. Further results showed Business Inventories expanded 0.4% MoM in September and the NAHB Index deteriorated to 33 in November.
If EUR/USD closes above the key 200-day SMA at 1.0422, it could allow for the continuation of the uptrend to, initially, the November high at 1.0481 (November 15) prior to the round level at 1.0500. The surpass of the latter should pave the way for a visit to the weekly top at 1.0614 (June 27) before the June peak at 1.0773 (June 9) and the May high at 1.0786 (May 30). On the flip side, there is an interim contention at the 100-day SMA at 1.0026 just followed by the 0.9935 level (November 10) and the 55-day SMA at 0.9918. South from here comes the November low at 0.9730 (November 3). The daily RSI flirted with the overbought territory near 69.
Resistance levels: 1.0481 1.0614 1.0773 (4H chart)
Support levels: 1.0279 1.0116 0.9935 (4H chart)
-638042241328285484.png)
USDJPY
USD/JPY navigated a volatile session on Friday and eventually ended the day with modest gains on the back of another negative performance in the dollar and further decline in the belly and the long end of the US yield curve.
In addition, the sustained risk-on mood coupled with unabated repricing of the Fed’s pivot in its policy kept the dollar well under pressure and favoured the offered stance in the pair.
In Japan, Machinery Orders expanded at an annualized 2.9% in September and the Tertiary Industry Index dropped 0.4% MoM also in September.
The November low at 137.65 (November 15) is expected to hold the downside in case sellers push harder. Below this level, USD/JPY could dispute the weekly low at 135.80 (August 23) prior to the key 200-day SMA at 133.07 and the August low at 130.39 (August 2). Contrarily, the 100- and 55-day SMAs at 140.85 and 144.86, respectively, are seen emerging as the initial resistance levels before the weekly high at 148.84 (October 31) and the 2022 top at 151.94 (October 21). The daily RSI remained close to the oversold territory around 31.
Resistance levels: 140.79 142.48 146.31 (4H chart)
Support levels: 137.65 136.9 135.80 (4H chart)
-638042241987887786.png)
GBPUSD
GBP/USD extended the weekly leg higher and regained the area beyond 1.1900 the figure on Wednesday.
Once again, the continuation of the upbeat tone in the risk-linked galaxy sustained the second consecutive daily advance in the Sterling against the backdrop of the somewhat unabated decline in the dollar.
The British pound saw its mood improve after UK inflation figures gauged by the headline CPI surprised markets to the upside, rising to fresh 41-year high at 11.1% in the year to October and 6.5% over the last twelve months when it came to the Core CPI. On a monthly view, prices went up by 2.0%.
GBP/USD faces the immediate up barrier at the November peak at 1.2028 (November 15). Above this level there are no hurdles of relevance until the August high at 1.2293 (August 1) prior to the weekly top at 1.2405 (June 16). Just the opposite, the 100-day SMA at 1.1647 offers temporary contention prior to the 55-day SMA at 1.1368 and the November low at 1.1142 (November 4). The loss of the latter could pave the way for a visit to the weekly low at 1.1059 (October 21) seconded by the October low at 1.0923 (October 12). The daily RSI improved to the proximity of 62.
Resistance levels: 1.2028 1.2142 1.2276 (4H chart)
Support levels: 1.1709 1.1380 1.1333 (4H chart)
-638042241672643277.png)
AUDUSD
AUD/USD faltered once again just ahead of the key hurdle at the 0.6800 mark on Wednesday, despite another moderate retracement in the greenback and the prevailing risk-on mood among market participants.
The broad-based poor performance in the commodity space also prevented the Aussie dollar from gathering extra steam. On this copper prices extended the corrective decline for the third session in a row and the iron ore dropped marginally to the $93.00 area per tonne.
In the Australian docket, the Westpac Leading Index contracted at a monthly 0.1% in October and the Wage Price Index expanded 3.1% YoY during the July-September period.
Immediately to the upside in AUD/USD comes the November top at 0.6797 (November 15) prior to the September peak at 0.6916 (September 13) and the 200-day SMA at 0.6949. North from here emerges the psychological 0.7000 level. In the opposite direction, the 55-day SMA comes first at 0.6523 seconded by the weekly low at 0.6386 (November 10) and the November low at 0.6272 (November 3). A drop below this level could open the door to a move to the 2022 low at 0.6169 (October 13) ahead of the psychological 0.6000 level. The daily RSI eased some ground and approached 64.
Resistance levels: 0.6797 0.6916 0.6956 (4H chart)
Support levels: 0.6663 0.6409 0.6386 (4H chart)
-638042242290074759.png)
GOLD
The late rebound in the dollar from daily lows when tracked by the USD Index (DXY) put the recent upside momentum in the yellow metal to the test and forced the ounce troy to halt four consecutive daily advances on Wednesday.
Indeed, bullion poked with Tuesday’s monthly tops around $1,785, although a break above this zone remained elusive despite the offered greenback and mixed activity in US yields.
It seemed that some profit taking mood also weighed on the precious metal, which somewhat ignored the recent bout of geopolitical effervescence and appears to have already digested a potential Fed’s pivot in its policy.
Further gains in gold need to surpass the November high at $1,786 (November 15) to allow for a probable challenge of the critical $1,800 zone, just followed by the key 200-day SMA, today at $1,802. Once cleared, the August top at $1,807 (August 10) is expected to resurface on the horizon prior to the June peak at $1,879 (June 13). On the contrary, the 100- and 55-day SMAs at $1,713 and $1,682, respectively, turn up as temporary contention ahead of the 2022 low at $1,614 (September 28) and the round level at $1,600.
Resistance levels: $1,786 $1,807 $1,814 (4H chart)
Support levels: $1,753 $1,702 $1,676 (4H chart)
-638042242602015997.png)
CRUDE WTI
Prices of the WTI resumed the downside and flirted with 3-week lows in the vicinity of the $84.00 mark per barrel on Wednesday
The sour sentiment in the commodity worsened after Hungarian officials said the supply of Russian crude oil to the country via the Druzhba pipeline was re-established following a temporary technical issue.
Also collaborating with the selling pressure in crude oil emerged demand concerns in China in response to the recent pick-up in COVID cases.
In the meantime, the WTI gave away initial gains following an attack to a tanker off the coast of Oman, presumably by an Iranian drone.
The WTI failed to capitalize on another negative session in the dollar and a larger-than-expected drop in US crude oil supplies, as per the EIA’s weekly report. On this, crude oil inventories dropped by 5.400M barrels in the week to November 11, while supplies at Cushing shrank by 1.624M barrels, distillate stocks rose by 1.120M barrels and gasoline stockpiles increased by 2.207M barrels.
A deeper decline in prices of the WTI could now revisit the weekly low at $82.10 (October 18) just before the key $80.00 mark. South from here turns up the minor support at $79.16 (September 30) ahead of the September low at $76.28 (September 26) and the 2022 low at $74.30 (January 3). Inversely, the initial up barrier remains at the November top at $93.73 prior to the weekly high at $97.65 (August 30). Beyond this region, the commodity could confront the key 200-day SMA at $98.31 ahead of the psychological $100.00 mark per barrel.
Resistance levels: $88.65 $90.08 $93.73 (4H chart)
Support levels: $84.04 $82.62 $82.06 (4H chart)
-638042243228796425.png)
DOW JONES
Equities traded on the defensive on Wednesday, as the poor performance from Target Corp and bad news from chip-maker Micron dented the sentiment and offset current repricing of a Fed’s pivot in the next months.
The dollar’s recovery weighed on the risk complex and put stocks under pressure as well against the backdrop of the mixed performance of the US debt market.
That said, the Dow Jones retreated 0.10% to 33,563, the S&P500 dropped 0.76% to 3,961 and the tech-benchmark Nasdaq Composite lost 1.35% to 11,202.
In case bulls regain the upper hand, the Dow Jones faces the immediate hurdle at the November high at 33,987 (November 15) prior to the August top at 34,281 (August 16) and before the April peak at 35,492. In opposition, the key 200-day SMA at 32,518 is expected to hold the initial test ahead of the November low at 31,727 (November 3) and the 100- and 55-day SMAs at 31,641 and 31,145, respectively. The loss of this area could put a potential test of the 30,206 level (October 21) back on the radar ahead of the 2022 low at 28,660 (October 13). The daily RSI remained stable near 65.
Top Performers: McDonald’s, UnitedHealth, Travelers
Worst Performers: Salesforce Inc, Intel, Dow
Resistance levels: 33,987 34,281 35,492 (4H chart)
Support levels: 33,320 32,478 31,727 (4H chart)
-638042243570127533.png)
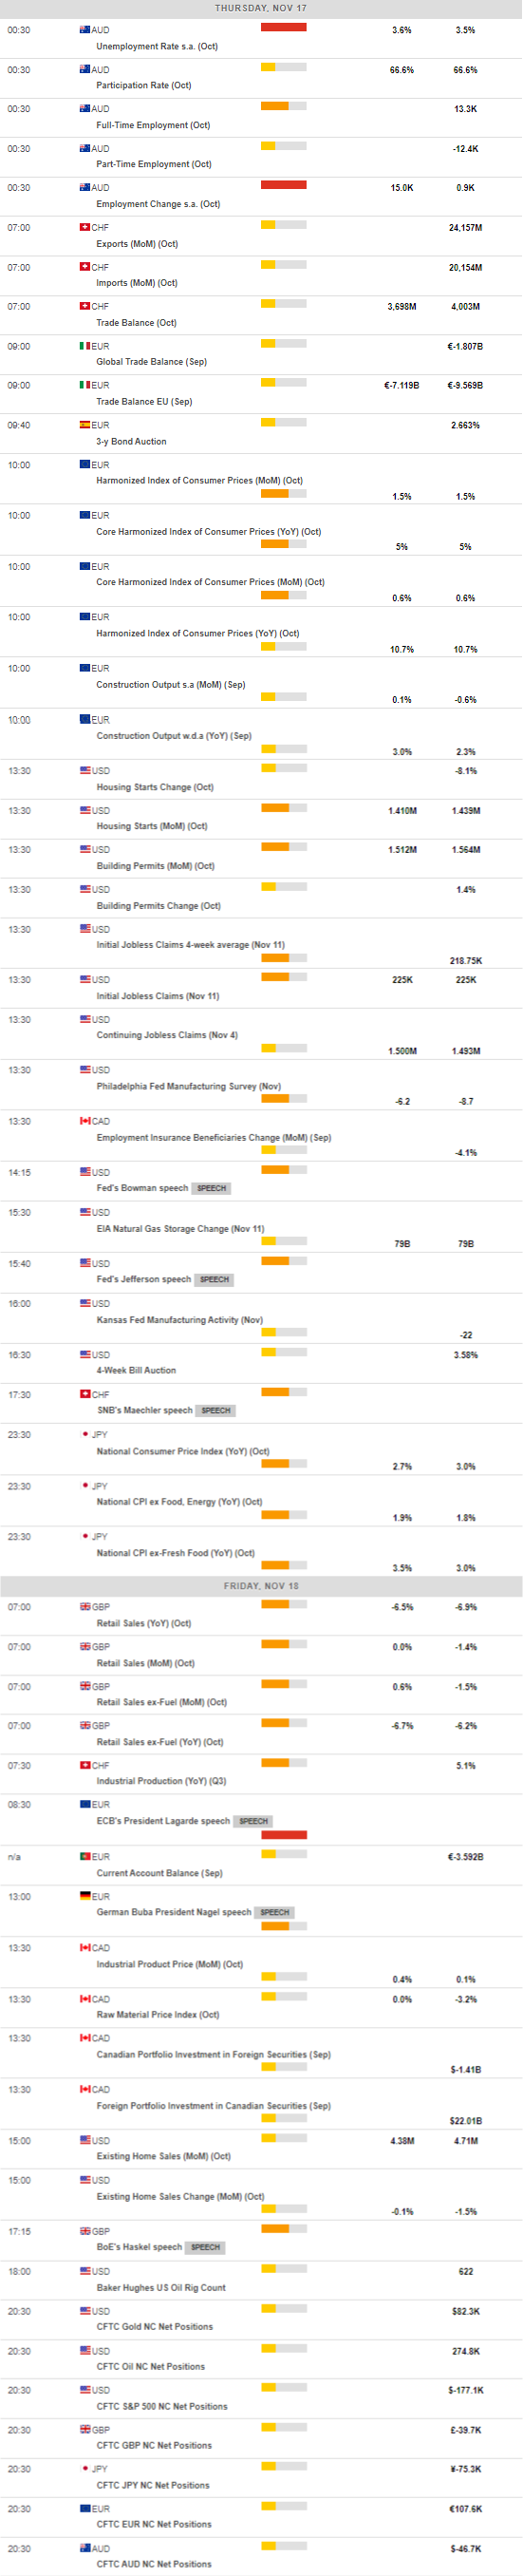
MACROECONOMIC EVENTS
All Information & Updates provided by:

All information relating to the financial markets available on this page has been prepared and issued by FXStreet (Forexstreet SL, Spain, Reg: B62498233) on the basis of publicly available information and all information believed to be reliable and does not conflict with Kuwaiti local laws, and all necessary care has been taken to before the company to ensure that the facts mentioned are correct from the source.
NCM Investment nor any of its directors or employees shall in any way be held responsible for the contents of this news, and the information contained on this page is intended only to provide clients with publicly available information and should not be construed as investment advice, report or analysis and/or constitute an offer or invitation to buy or sell financial instruments of any kind.
RISK WARNING: Forex and CFDs are highly risky leveraged products, as losses can exceed deposits. Please ensure you understand all the risks and take independent advice if necessary. NCM will segregate the clients based on the criteria of the regulator and its bylaws. NCM does not provide any advisory service; the material published does not constitute advice or a recommendation for a transaction in any financial instrument. NCM accepts no responsibility for any use of the content presented and any consequences of that use. Anyone acting on the information provided does so at their own risk.