
- Contact Us:
-

-

-

-


Daily Market Updates
18 Nov 2022
EURUSD
Following two consecutive daily advances, EUR/USD returned to the area below the key 1.0400 barrier amidst marked losses on Thursday.
Indeed, the daily retracement in spot came in response to a strong rebound in the greenback, this time accompanied by an equally firm uptick in US yields across the curve and all framed within the renewed weakness in the risk complex.
In the meantime, it seems market participants have already priced in a potential pivot in the Fed’s monetary policy that could well be debated at the December meeting, giving way to some stabilization in the FX universe.
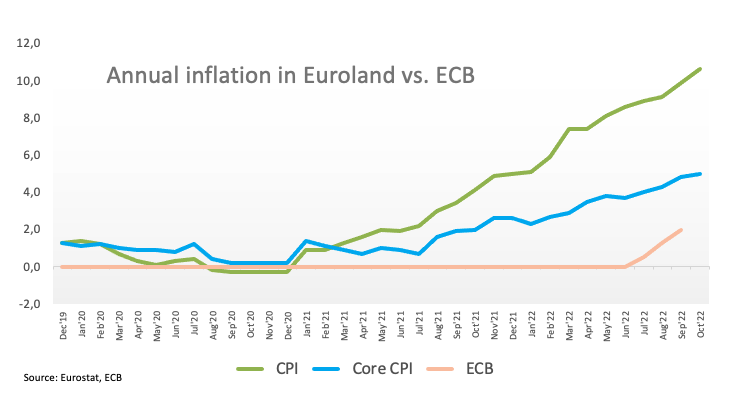
In the euro docket, New Car Registrations in the European Union expanded 12.2% in the year to October, while final inflation figures in the euro zone showed the CPI rose 10.7% YoY in October and 5% when it comes to the Core CPI.
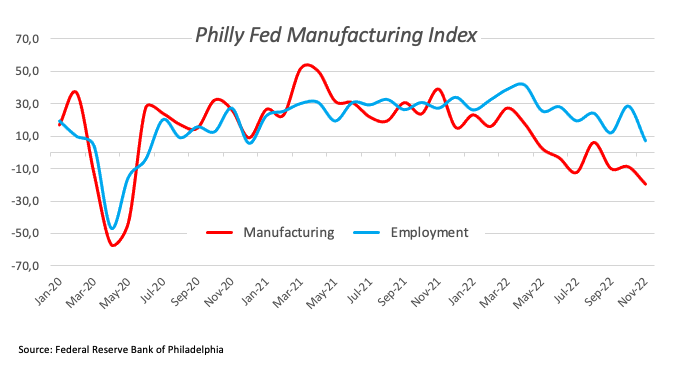
In the US, preliminary readings saw Building Permits contract 2.4% during last month, or 1.526M units, and Housing Starts dropped 4.2%, or 1.425M units. In addition, Initial Jobless Claims rose by 222K in the week to November 12 and the Philly Fed Manufacturing Index deteriorated to -19.4 in November.
A close above the 200-day SMA at 1.0416 remains elusive for EUR/USD for the time being. A move above this key region should allow for further gains to revisit the November top at 1.0481 (November 15) in the relatively short term ahead of the round level at 1.0500. North from here aligns the weekly peak at 1.0614 (June 27) ahead of the June high at 1.0773 (June 9) and the May top at 1.0786 (May 30). Just the opposite, the 100-day SMA at 1.0024 emerges as initial support prior to the 0.9935 level (November 10) and the 55-day SMA at 0.9925. The loss of this zone exposes the November low at 0.9730 (November 3). The daily RSI eased a tad and tested the 67 area.
Resistance levels: 1.0481 1.0614 1.0773 (4H chart)
Support levels: 1.0305 1.0279 1.0200 (4H chart)
-638043098115407629.png)
USDJPY
USD/JPY added to Wednesday’s uptick and extended further the consolidative range, although this time looking to surpass the key 140.00 barrier in a more convincing fashion.
The strong rebound in the dollar in combination with decent gains in US yields across the curve and the impasse in the recent strong momentum in the risk complex all fuelled the second session in a row with gains in the pair.
From the BoJ, member Uchida suggested it is still premature to discuss an exit strategy from the stimulus programme. In addition, Governor Kuroda expects the CPI to fall below 2% in the next fiscal year as cost-push factors subside and added that the central bank will work closely with the government to implement an appropriate policy.
In the Japanese calendar, Foreign Bond Investment shrank to ¥123.9B in the week to November 12 and the trade deficit widened to ¥2162.3B in October.
In case the march higher in USD/JPY gathers extra pace, the 100-day SMA at 140.89 should offer an initial interim barrier ahead of the 55-day SMA at 144.87. North from here comes the weekly top at 148.84 (October 31) prior to the 2022 peak at 151.94 (October 21). On the contrary, the November low at 137.65 (November 15) emerges as the initial contention before the weekly low at 135.80 (August 23). The loss of this level could pave the way for another test of the key 200-day SMA at 133.19 followed by the August low at 130.39 (August 2). The daily RSI bounced further and surpassed 35.
Resistance levels: 140.73 142.80 145.98 (4H chart)
Support levels: 138.87 137.65 136.9 (4H chart)
-638043099602033290.png)
GBPUSD
GBP/USD dropped markedly and set aside two daily advances in a row on Thursday, all after probing once again the area beyond 1.1900 the figure.
The move lower in Cable came in response to a positive performance in the greenback, which managed to climb above the 107.00 barrier when tracked by the USD Index (DXY), regaining the smile at the same time following two sessions in the red.
In the UK, the focus of attention was on the Autumn Statement. Chancellor Hunt, stressed that the BoE’s remit will remain unchanged, adding that the Office for Budget Responsibility (OBR) now sees the CPI at 7.4% in 2023 and the jobless rate climbing to 4.9% in 2024. In addition, the OBR sees the economy contracting 1.3% in 2023 and judged the economy is now in recession, while its forecasts showed a budget deficit of 7.1% of GDP in 2022/23 (from 3.9% in March). Hunt also suggested that any windfall tax should be temporary and not deter investment, while he confirmed an extension of the Energy Price Guarantee (EPG) beyond 30 March 2023. Chancellor Hunt also unveiled two new fiscal rules, namely, to have a debt/GDP dropping by the end of the 5-year forecast as well as borrowing below the 3% of GDP in the same period.
The November high at 1.2028 (November 15) remains the initial up barrier for GBP/USD for the time being. The breakout of this level could put a potential test of the August top at 1.2293 (August 1) back on the investors’ radar ahead of the weekly peak at 1.2405 (June 16). By contrast, the 100- and 55-day SMAs at 1.1645 and 1.1376, respectively, emerge as initial support levels before the November low at 1.1142 (November 4) and the weekly low at 1.1059 (October 21). A drop below the latter could open the door to the October low at 1.0923 (October 12). The daily RSI grinded lower and flirted with the 60 yardstick.
Resistance levels: 1.2028 1.2142 1.2276 (4H chart)
Support levels: 1.1762 1.1709 1.1408 (4H chart)
-638043099183914682.png)
AUDUSD
The strong recovery in the dollar forced AUD/USD to shed further ground and drop to weekly lows near 0.6630 on Thursday.
The selling mood in the Aussie dollar also derived strength from the broad-based negative performance in the commodity complex, where copper prices dropped for the fourth session in a row and the iron ore navigated without direction.
Not even better-than-expected results in the domestic calendar helped the AUD, after the labour market report showed the Employment Change increased by 32.2K people and the Unemployment Rate ticked lower to 3.4% (from 3.5%).
If losses in AUD/USD accelerate, then the next support should emerge at the 55-day SMA at 0.6521 ahead of the weekly low at 0.6386 (November 10) and the November low at 0.6272 (November 3). Down from here comes the 2022 low at 0.6169 (October 13), which precedes the psychological 0.6000 level. On the other hand, a break above the November peak at 0.6797 (November 15) could prompt the September high at 0.6916 (September 13) to emerge on the horizon prior to the 200-day SMA at 0.6947 and the psychological 0.7000 mark. The daily RSI deflated and flirted with the 61 zone.
Resistance levels: 0.6797 0.6916 0.6956 (4H chart)
Support levels: 0.6634 0.6409 0.6386 (4H chart)
-638043100008620632.png)
GOLD
The solid rebound in the dollar along with a decent recovery in US yields across the curve undermined the recent upside momentum in the precious metal and forced the ounce troy to drop to multi-session lows near $1,750.
Indeed, as the firm sentiment in the risk complex took a breather, the dollar managed to regain upside traction and lifted the USD Index (DXY) back above the 107.00 mark on Thursday, flirting at the same time with weekly peaks.
As gold returns from the overbought territory, it faces the next contention at the 100- and 55-day SMAs at $1,713 and $1,683, respectively, prior to the 2022 low at $1,614 (September 28) and the round level at $1,600. In the opposite direction, if bullion leaves behind the November top at $1,786 (November 15) it could then confront the critical $1,800 area, which also appears bolstered by the key 200-day SMA ($1,802). North from here turns up the August peak at $1,807 (August 10) ahead of the June high at $1,879 (June 13).
Resistance levels: $1,786 $1,807 $1,814 (4H chart)
Support levels: $1,753 $1,702 $1,682 (4H chart)
-638043100308328052.png)
CRUDE WTI
Prices of the barrel of the American benchmark for the sweet light crude oil dropped around 4% and approached the $81.00 mark on Thursday, or 6-week lows, as China-induced demand concerns weighed heavily on traders’ sentiment.
Indeed, COVID cases in China remained on the rise and reached levels last seen a few months ago amidst mounting jitters that the situation could become out of control sooner rather than later.
Also adding to the sour mood around the commodity, recession fears seem to have re-emerged after a key manufacturing gauge tracked by the Philadelphia Fed worsened to levels last seen back in May 2020 in November (-19.4).
If sellers push harder, then prices of the WTI are expected to dispute the critical $80.00 mark per barrel. The breach of this level could open the door to a test of the minor support at $79.16 (September 30) prior to the September low at $76.28 (September 26) and the 2022 low at $74.30 (January 3). On the contrary, there are no up barriers of relevance until the November peak at $93.73 ahead of the weekly high at $97.65 (August 30). If surpassed, crude oil could then revisit the key 200-day SMA at $98.27 before the psychological $100.00 mark per barrel.
Resistance levels: $87.36 $88.65 $90.08 (4H chart)
Support levels: $81.42 $79.12 $76.54 (4H chart)
-638043101201807796.png)
DOW JONES
US stocks traded in a mixed note on Thursday following hawkish comments from St. Louis Fed J,Bullard, who suggested a minimum on rates of 5.0%-5.25% and somewhat talked down the latest loss of upside traction in the inflation. Bullard estimated that disinflation could turn up in 2023.
Also adding to now speculation that a Fed’s pivot could have to wait longer, weekly Claims surprised to the upside, showing that any weakness in the labour market is yet to be seen.
All in all, the Dow Jones dropped 0.05% to 33,535, the S&P500 retreated 0.35% to 3,945 and the tech-heavy Nasdaq Composite rose 0.11% to 11,195.
Extra decline in the Dow Jones should meet the next support at the key 200-day SMA at 32,507 prior to the November low at 31,727 (November 3) and the 100- and 55-day SMAs at 31,667 and 31,181, respectively. Down from here turns up the 30,206 level (October 21) before the 2022 low at 28,660 (October 13). On the upside, the November top at 33,987 (November 15) emerges as the initial hurdle seconded by the August peak at 34,281 (August 16) and the April high at 35,492. The daily RSI deflated a tad to the 65 region.
Top Performers: Cisco, UnitedHealth, Merck&Co
Worst Performers: Salesforce Inc, Walt Disney, Caterpillar
Resistance levels: 33,987 34,281 35,492 (4H chart)
Support levels: 33,239 32,478 31,727 (4H chart)
-638043101497099070.png)
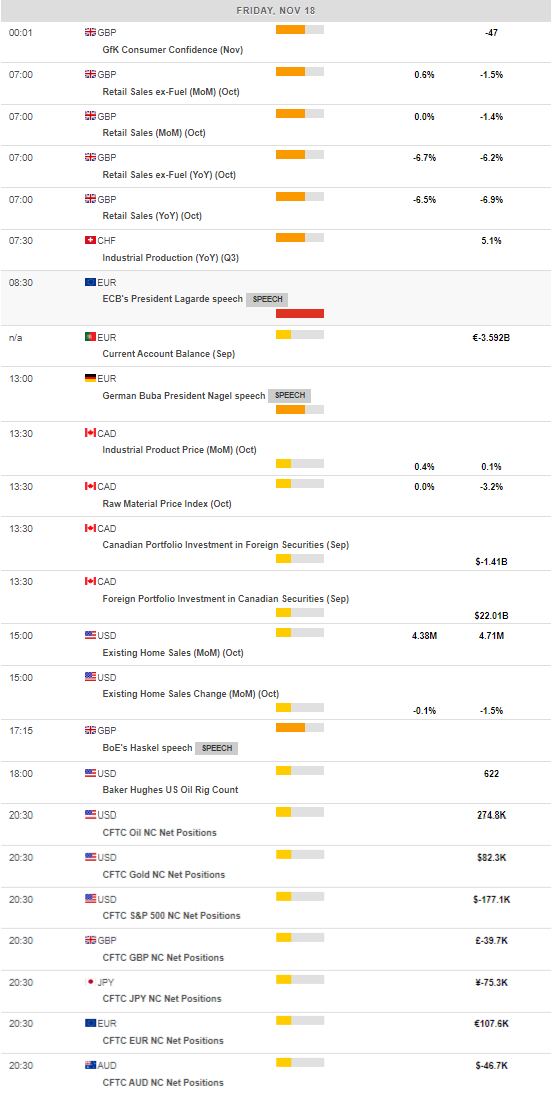
MACROECONOMIC EVENTS
All Information & Updates provided by:

All information relating to the financial markets available on this page has been prepared and issued by FXStreet (Forexstreet SL, Spain, Reg: B62498233) on the basis of publicly available information and all information believed to be reliable and does not conflict with Kuwaiti local laws, and all necessary care has been taken to before the company to ensure that the facts mentioned are correct from the source.
NCM Investment nor any of its directors or employees shall in any way be held responsible for the contents of this news, and the information contained on this page is intended only to provide clients with publicly available information and should not be construed as investment advice, report or analysis and/or constitute an offer or invitation to buy or sell financial instruments of any kind.
RISK WARNING: Forex and CFDs are highly risky leveraged products, as losses can exceed deposits. Please ensure you understand all the risks and take independent advice if necessary. NCM will segregate the clients based on the criteria of the regulator and its bylaws. NCM does not provide any advisory service; the material published does not constitute advice or a recommendation for a transaction in any financial instrument. NCM accepts no responsibility for any use of the content presented and any consequences of that use. Anyone acting on the information provided does so at their own risk.