
- Contact Us:
-

-

-

-


Daily Market Updates
21 Nov 2022
EURUSD
EUR/USD came under extra downside pressure and added to the pessimism seen in the second half of the week, retreating and finding initial contention in the 1.0315/10 band so far on Friday.
The sentiment around the European currency and the rest of the risk complex soured in response to hawkish comments from voting member J.Bullard (St. Louis Fed), who warned against reading too much into October's lower-than-expected US inflation figures. Bullard also advocated for a more restrictive policy and citing this level around the 5%-7%.
Bullard’s comments raised some eyebrows and poured cold water over the potential discussion of a Fed’s pivot at the December event, all rendering fresh oxygen to the dollar and underpinning the corrective decline in EUR/USD. Bullard’s opinion was reinforced later on Friday by Boston Fed S.Collins, who did not rule out another 75 bps rate hike in December.
The downtick in the pair followed another (very) positive session in both US and German yields, which climbed for the second session in a row when it came to the 10-year benchmark notes.
Nothing new, in the meantime, from Chair Lagarde at her speech, where she reiterated that extra rate hikes are coming, at the time when she added that recession risks are increasing. She suggested that a recession scenario is unlikely to bring down inflation significantly.
Still around the ECB, Board member Nagel advocated for the start of quantitative tightening (QT) early in 2023, adding that the bank’s policy must move into the restrictive territory. His colleague Knot suggested that an early start of QT reduces the peak inflation as well as the terminal rate and expects the rate to hit the neutral level in December.
The euro docket was empty on Friday, whereas the US calendar showed the CB Leading Index contracting 0.8% MoM in October and Existing Home Sales dropping 5.9% vs. the previous month, or 4.43M units.
Immediately to the upside in EUR/USD turns up the 200-day SMA at 1.0411. Beyond this region the pair should challenge the November peak at 1.0481 (November 15) prior to the round level at 1.0500. Once cleared, a probable test of the weekly high at 1.0614 (June 27) could return to the investors’ radar before the June top at 1.0773 (June 9) and the May peak at 1.0786 (May 30). By contrast, there is an interim support level at the 100-day SMA at 1.0023 closely followed by the 0.9935 level (November 10), which is in turn underpinned by the 55-day SMA at 0.9932. A deeper drop could see the November low at 0.9730 (November 3) revisited. The daily RSI dropped further and breached 65.
Resistance levels: 1.0438 1.0481 1.0614 (4H chart)
Support levels: 1.0305 1.0279 1.0200 (4H chart)
-638044638316759396.png)
USDJPY
The positive performance of the greenback helped USD/JPY adding. to the ongoing recovery and post gains for the third session in a row at the end of the week, this time closing above the key 140.00 mark.
The uptick in spot came in line with a firm uptick in US yields across the curve, which added to the upside witnessed in the previous session.
Earlier in the Asian session and at his semi-annual testimony before the parliament, BoJ Governor H.Kuroda defended once again the bank’s ultra-accommodative stance and talked down the possibility of an exit strategy (via raising rates). Kuroda also suggested that wages must rise around 3% to hit the bank’s inflation target in a sustainable way, while he expects recent inflation pressure to subside in the next fiscal year.
In the Japanese calendar, the Inflation Rate rose 3.7% in the year to October and 3.6% YoY when it came to the Core Inflation Rate. Further results saw the Inflation Rate Ex-Food and Energy rise 2.5% from a year earlier.
Bears in USD/JPY continue to target the November low at 137.65 (November 15) ahead of the weekly low at 135.80 (August 23). If the pair breaches this region, it could put a probable visit to the key 200-day SMA at 133.31 back on the investors’ radar prior to the August low at 130.39 (August 2). In the opposite direction, there is a temporary hurdle at the 100-day SMA at 140.94 before the 55-day SMA at 144.86. The move beyond the latter could pave the way for a challenge of the weekly peak at 148.84 (October 31) ahead of the 2022 high at 151.94 (October 21). The daily RSI inched higher and trespassed the 36 level.
Resistance levels: 140.74 142.80 145.87 (4H chart)
Support levels: 138.87 137.65 136.9 (4H chart)
-638044640287240929.png)
GBPUSD
GBP/USD set aside Thursday’s decline and posted decent gains near the 1.1900 mark at the end of the week. Cable, therefore, rose for the second consecutive week and closed with gains in six out of the last eight weeks (since the all-time low near 1.0350 on September 26).
The daily improvement in Cable came despite the solid bounce in the greenback and prompted Sterling to keep the bid bias unchanged so far and extend an early attempt of consolidation in the upper end of the recent range.
The quid also derived further strength from better-than-expected results from the UK calendar on Friday after Retail Sales contracted less than estimated at an annualized 6.1% in October. In addition, sales excluding Fuel also contracted 6.7% from a year earlier, while sales expanded at a monthly 0.6% and 0.3%, respectively. Additionally, the Consumer Confidence tracked by GfK “improved” to -44 in November (from -47).
Immediately to the upside in GBP/USD comes the November top at 1.2028 (November 15). North from here turns up the August peak at 1.2293 (August 1) followed by the weekly high at 1.2405 (June 16). On the flip side, interim contention aligns at the 100- and 55-day SMAs at 1.1642 and 1.1382, respectively, ahead of the November low at 1.1142 (November 4) and the weekly low at 1.1059 (October 21). The daily RSI edged marginally higher and poked with 62.
Resistance levels: 1.1957 1.2028 1.2142 (4H chart)
Support levels: 1.1762 1.1709 1.1420 (4H chart)
-638044638849154738.png)
AUDUSD
Another positive session in the greenback kept the rebound in the risk complex and the high beta currencies at bay on Friday. Against that, AUD/USD clinched the third consecutive daily pullback at the end of the week in levels south of the 0.6700 mark.
In addition, the generalized selling pressure in the commodity space saw copper prices extend the decline for yet another session as well as the persistent lack of direction in the iron ore.
The Australian docket was empty on Friday, leaving all the attention to the speech by RBA Governor P.Lowe on November 22.
The continuation of the downtrend in AUD/USD should meet the next support at the weekly low at 0.6633 (November 17) ahead of the temporary contention at the 55-day SMA at 0.6519. The loss of the latter could open the door to a test of the weekly low at 0.6386 (November 10) seconded by the November low at 0.6272 (November 3). South from here turns up the 2022 low at 0.6169 (October 13) closely followed by the psychological 0.6000 level. On the contrary, the pair needs to clear the November high at 0.6797 (November 15) to allow for a visit to the September top at 0.6916 (September 13) before the 200-day SMA at 0.6947 and the psychological 0.7000 mark. The daily RSI grinded lower and breached the 60 zone.
Resistance levels: 0.6730 0.6797 0.6916 (4H chart)
Support levels: 0.6633 0.6409 0.6386 (4H chart)
-638044641033582989.png)
GOLD
Gold prices extended the leg lower and corrected further from multi-week peaks recorded earlier in the week near $1,790 and broke below the $1,750 mark per ounce troy on Friday.
The second session in a row with gains in the dollar depressed any bullish attempt in the precious metal, while further rebound in US yields across the curve also collaborated with the sour sentiment.
Bullion, in addition, remained under pressure, as traders continued to digest the recent hawkish remarks from St. Louis Fed James Bullard, while Friday’s views from Boston Fed Susan Collins also reinforced his views.
Further losses in gold are now expected to meet interim contention levels at the 100- and 55-day SMAs at $1,712 and $1,684, respectively, ahead of the 2022 low at $1,614 (September 28), which precedes the round level at $1,600. On the other hand, the initial up barrier comes at the November peak at $1,786 (November 15) prior to the critical $1,800 mark, which appears just before the key 200-day SMA at $1,802. Once cleared, the August high at $1,807 (August 10) could re-emerge on the horizon prior to the June top at $1,879 (June 13).
Resistance levels: $1,767 $1,786 $1,807 (4H chart)
Support levels: $1,747 $1,702 $1,682 (4H chart)
-638044641698753421.png)
CRUDE WTI
Prices of the West Texas Intermediate (WTI) retreated to the vicinity of the $77.00 mark per barrel at its worst moment on Friday and ended the session just above the key $80.00 mark, shedding more than 2%.
That said, the WTI clinched the second session in a row and closed in multi-week lows on the back of persevering demand concerns stemming from China and the surge in COVID cases, while fading supply jitters also added to the downbeat mood in the commodity.
In the calendar, driller Baker Hughes said the US oil rig count went up by 1 in the week to November 18, lifting the total US oil rigs to 623.
If oil bears could breach the November low at $77.24 (November 18), then a move to the September low at $76.28 (September 26) could resurface on the horizon prior to the 2022 low at $74.30 (January 3). Just the opposite, an interim resistance comes at the 55-day SMA at $85.83 ahead of the minor hurdle at the $90.08 level (November 11). Further up emerges the November high at $93.73 before the weekly top at $97.65 (August 30). Extra gains from here should put the key 200-day SMA at $98.23 back on the radar ahead of the psychological $100.00 mark per barrel.
Resistance levels: $82.62 $87.26 $88.65 (4H chart)
Support levels: $77.21 $76.54 $74.26 (4H chart)
-638044642811120740.png)
DOW JONES
Equities closed the week with humble gains and managed to reverse part of the recent weakness at the same time.
Indeed, investors seem to have already digested recent hawkish remarks from Fed speakers as well as some speculation that the so-called Fed’s pivot could still wait a bit longer to emerge.
Despite Bullard’s hawkish rhetoric, a 50 bps interest rate hike by the Fed at the December 14 event still looks like the most probable scenario, as per CME Group’s FedWatch Tool (nearly 76% probability).
Against that, the Dow Jones rose 0.59% to 33,745, the S&P500 gained 0.48% to 3,965 and the tech-reference Nasdaq Composite advanced 0.01% to 11,146.
Bulls continue to look at a breakout of the November peak at 33,987 (November 15) to allow for the continuation of the uptrend to the August high at 34,281 (August 16) followed by the April top at 35,492. Meanwhile, the key 200-day SMA at 32,501 is predicted to hold the downside ahead of the November low at 31,727 (November 3). The loss of the latter exposes the 100- and 55-day SMAs at 31,694 and 31,220, respectively prior to the 30,206 level (October 21) and the 2022 low at 28,660 (October 13). The daily RSI improved slightly to the proximity of 67.
Top Performers: UnitedHealth, Cisco, Merck&Co
Worst Performers: Salesforce Inc, Walgreen Boots, Chevron
Resistance levels: 33,987 34,281 35,492 (4H chart)
Support levels: 33,239 32,478 31,727 (4H chart)
-638044643528168477.png)
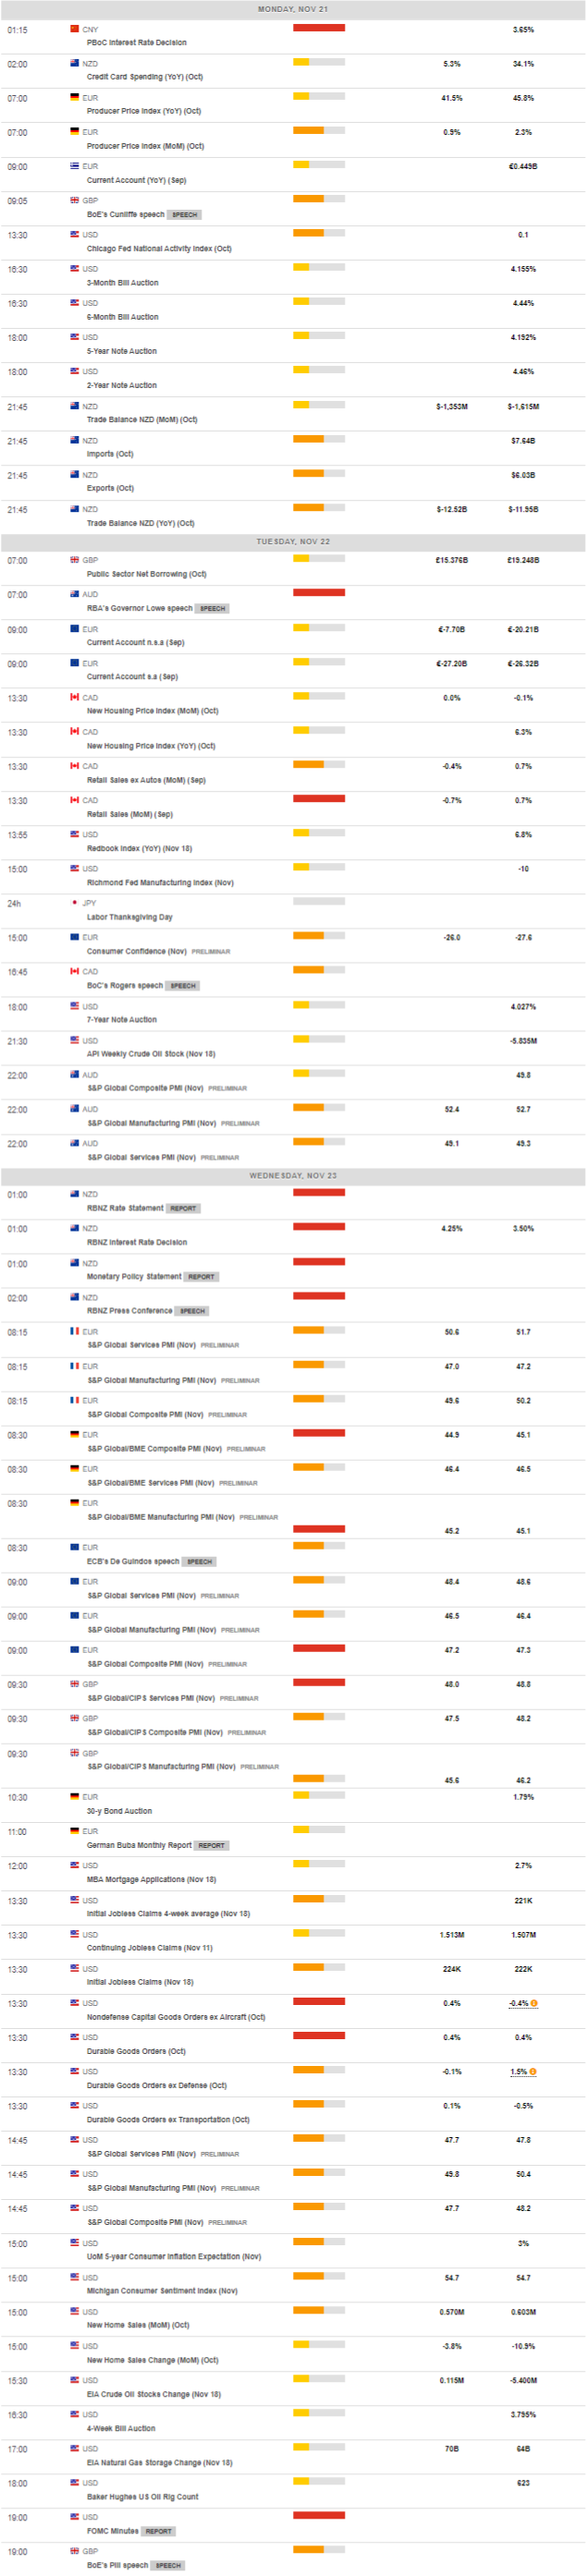
MACROECONOMIC EVENTS
All Information & Updates provided by:

All information relating to the financial markets available on this page has been prepared and issued by FXStreet (Forexstreet SL, Spain, Reg: B62498233) on the basis of publicly available information and all information believed to be reliable and does not conflict with Kuwaiti local laws, and all necessary care has been taken to before the company to ensure that the facts mentioned are correct from the source.
NCM Investment nor any of its directors or employees shall in any way be held responsible for the contents of this news, and the information contained on this page is intended only to provide clients with publicly available information and should not be construed as investment advice, report or analysis and/or constitute an offer or invitation to buy or sell financial instruments of any kind.
RISK WARNING: Forex and CFDs are highly risky leveraged products, as losses can exceed deposits. Please ensure you understand all the risks and take independent advice if necessary. NCM will segregate the clients based on the criteria of the regulator and its bylaws. NCM does not provide any advisory service; the material published does not constitute advice or a recommendation for a transaction in any financial instrument. NCM accepts no responsibility for any use of the content presented and any consequences of that use. Anyone acting on the information provided does so at their own risk.