
- Contact Us:
-

-

-

-


Daily Market Updates
22 Nov 2022
EURUSD
EUR/USD saw its downside exacerbated to new 2-week lows near 1.0220 at the beginning of the week, always on the back of the persistent recovery in the greenback.
Indeed, the dollar continued to reclaim lost ground and approached the 108.00 neighbourhood, as market participants digested further the recent hawkish tilt seen in messages from many Fed’s rate setters (Waller, Bullard and Collins), which at the same time appear to have mitigated the speculation around a potential pivot in the Fed’s policy.
Indeed, and following these remarks, the probability of a 50 bps rate hike at the December 14 gathering receded to around 75% as per the FedWatch Tool gauged by CME Group.
The uptick in the dollar – or the extra weakness in spot – was once again amidst another positive performance of US yields across the curve. In the German money market, the 10-year benchmark bund yields advanced marginally and kept the trade above the key 2.0% mark.
The European docket saw Germany’s Producer Prices contract 4.2% MoM in October and rise 34.5% over the last twelve months. In the US, the Chicago Fed National Activity Index deteriorated to -0.05 in October (from 0.17).
Further decline in EUR/USD could see the September high at 1.0197 (September 12) revisited in the near term. Below this level emerges the 100-day SMA at 1.0021 ahead of the 0.9935 level (November 10), which appears propped up by the 55-day SMA at 0.9938. The loss of this region could open the door to a test of the November low at 0.9730 (November 3) revisited. Just the opposite, once the 200-day SMA at 1.0406 is cleared, the pair could then confront the November high at 1.0481 (November 15) ahead of the round level at 1.0500 and the weekly top at 1.0614 (June 27). North from here turns up the June peak at 1.0773 (June 9) seconded by the May high at 1.0786 (May 30). The daily RSI eased further to the sub-59 region.
Resistance levels: 1.0438 1.0481 1.0614 (4H chart)
Support levels: 1.0222 1.0098 0.9959 (4H chart)
-638046531529995779.png)
USDJPY
USD/JPY prolonged the upside bias and advanced for the fourth session in a row at the beginning of the week, this time rising more than 1% to the area north of the 142.00 hurdle.
Indeed, the pair trespassed the 142.00 mark to clinch fresh multi-session peaks on the back of the continuation of the rebound in the greenback, which was further sustained by another positive performance in US yields across the curve.
The Japanese calendar was empty on Monday, while the next releases of note are expected on Thursday with the flash PMIs as well as the final prints of the Coincident Index and the Leading Economic Index.
Further gains in USD/JPY continue to target the interim 55-day SMA at 144.89 prior to the weekly high at 148.84 (October 31) and seconded by the 2022 top at 151.94 (October 21). On the flip side, there is initial contention at the November low at 137.65 (November 15) prior to the weekly low at 135.80 (August 23). South from here emerges the key 200-day SMA at 133.45 before the August low at 130.39 (August 2). The daily RSI improved further and poked with the 44 zone.
Resistance levels: 142.25 142.48 145.77 (4H chart)
Support levels: 138.87 137.65 136.9 (4H chart)
-638046532072225687.png)
GBPUSD
GBP/USD retreated markedly and clinched 2-day lows in the 1.1780/75 band at the beginning of the week, where some decent contention appears to have emerged.
In fact, another noticeable advance in the greenback weighed on the risk complex and forced Cable to shed part of the recent recovery. The firmer note in the buck came once again in response to the recent hawkish tilt seen in some comments by Fed speakers.
There were no data releases in the UK calendar on Monday, whereas Public Sector Net Borrowing is only due on Tuesday.
A deeper retracement in GBP/USD should retest the temporary support levels at the 100- and 55-day SMAs at 1.1639 and 1.1387, respectively, prior to the November low at 1.1142 (November 4) and the weekly low at 1.1059 (October 21). By contrast, the November peak at 1.2028 (November 15) comes up first followed by the August high at 1.2293 (August 1) and the weekly high at 1.2405 (June 16). The daily RSI dropped further and approached 58.
Resistance levels: 1.1957 1.2028 1.2142 (4H chart)
Support levels: 1.1762 1.1709 1.1433 (4H chart)
-638046531761510961.png)
AUDUSD
The continuation of the upside momentum in the dollar kept the price action in the risk-associated universe depressed and sponsored the fourth consecutive daily retracement in AUD/USD, this time revisiting the area below the 0.6600 mark, more than 2 cents down from last week’s peaks.
The stronger dollar also weighed on the commodities space, where copper prices extended the decline and iron ore dropped marginally.
Collaborating with the downbeat tone in the Aussie dollar also re-emerged concerns in China in response to the unabated surge in COVID cases.
No data releases in Oz on Monday left all the focus to Tuesday’s speech by RBA Governor P.Lowe.
Sellers in AUD/USD now target the interim 55-day SMA at 0.6515 ahead of the weekly low at 0.6386 (November 10). The breakdown of this level could pave the way for a move to the November low at 0.6272 (November 3) prior to the 2022 low at 0.6169 (October 13) and the psychological 0.6000 mark. Contrarily, the November top at 0.6797 (November 15) emerges as the immediate obstacle for further gains before the September peak at 0.6916 (September 13). North from here lines up the 200-day SMA at 0.6942 prior to the psychological 0.7000 level. The daily RSI deflated to the sub-54 region.
Resistance levels: 0.6730 0.6797 0.6916 (4H chart)
Support levels: 0.6584 0.6409 0.6386 (4H chart)
-638046532390298050.png)
GOLD
Gold prices started the week on the defensive along with the rest of the USD-denominated assets.
Indeed, the robust bounce in the dollar in combination with higher US yields across the curve put the yellow metal under heightened pressure and dragged it back to the $1,730 region per ounce troy on Monday.
Furthermore, bullion is expected to remain under pressure against the current backdrop of reignited speculation of the tighter-for-longer stance from the Fed, especially reinvigorated in response to recent aggressive Fedspeak.
Immediately to the downside in gold now comes the 100- and 55-day SMAs at $1,711 and $1,684, respectively, prior to the 2022 low at $1,614 (September 28) and the round level at $1,600. In the opposite direction, the immediate hurdle remains at the November high at $1,786 (November 15) ahead of the critical $1,800 zone, which looks underpinned by the key 200-day SMA at $1,801and the August top at $1,807 (August 10). Once cleared, the precious metal could attempt a challenge of the June peak at $1,879 (June 13).
Resistance levels: $1,767 $1,786 $1,807 (4H chart)
Support levels: $1,732 $1,702 $1,682 (4H chart)
-638046532688264394.png)
CRUDE WTI
WTI prices traded on the defensive for the fourth straight day on Monday, this time approaching the $75.00 mark per barrel, just cents away from the YTD low ($74.30 printed on January 3).
Indeed, prices of the West Texas Intermediate came under extra pressure following persistent jitters surrounding the Chinese economy and the surge in COVID cases, all directly impacting on the demand for crude oil.
Additionally, traders remained prudent amidst rumours citing the likelihood that Saudi Arabia and other OPEC+ members could be planning an output increase.
It is worth recalling that the next OPEC+ meeting is due on December 5.
Next on the downside for WTI now comes the 2022 low at $74.30 (January 3) ahead of the round level at $70.00. Further down comes the weekly low at $66.15 (December 20 2021) prior to the December 2021 low at $62.46 (December 2). On the other hand, there is a temporary hurdle at the 55-day SMA at $85.66 before the $90.08 level (November 11). The surpass of this level could open the door to the November top at $93.73 prior to the weekly peak at $97.65 (August 30). If the recovery gathers steam, then the commodity could confront the key 200-day SMA at $98.15 and the psychological $100.00 mark per barrel.
Resistance levels: $80.41 $82.62 $85.42 (4H chart)
Support levels: $75.30 $74.26 $67.52 (4H chart)
-638046533445176388.png)
DOW JONES
US stocks started the week in a mixed fashion against the backdrop of renewed concerns surrounding the deteriorating outlook for the Chinese economy in the current scenario of rising COVID cases and the implementation of further lockdown measures.
In addition, the firmer note in the greenback and higher US yields across the curve also dented the mood around the risk complex on Monday.
That said, the Dow Jones advanced 0.03% to 33,754, the S&P500 retreated 0.29% to 3,954 and the tech-heavy Nasdaq Composite dropped 0.95% to 11,043.
The next target on the upside for the Dow Jones remains at the November high at 33,987 (November 15) followed by the August top at 34,281 (August 16) and the April peak at 35,492. Contrarily, the key 200-day SMA at 32,494 emerges as the initial contention before the November low at 31,727 (November 3). The latter appears reinforced by the 100-day SMA ahead of the 55-day SMA at 31,264. If bears push harder, then the 30,206 level (October 21) could re-emerge on the horizon prior to the 2022 low at 28,660 (October 13). The daily RSI looked stable near the 67 yardstick.
Top Performers: Walt Disney, Walgreen Boots, Merck&Co
Worst Performers: Salesforce Inc, UnitedHealth, Intel
Resistance levels: 33,987 34,281 35,492 (4H chart)
Support levels: 33,239 32,478 31,727 (4H chart)
-638046533739493936.png)
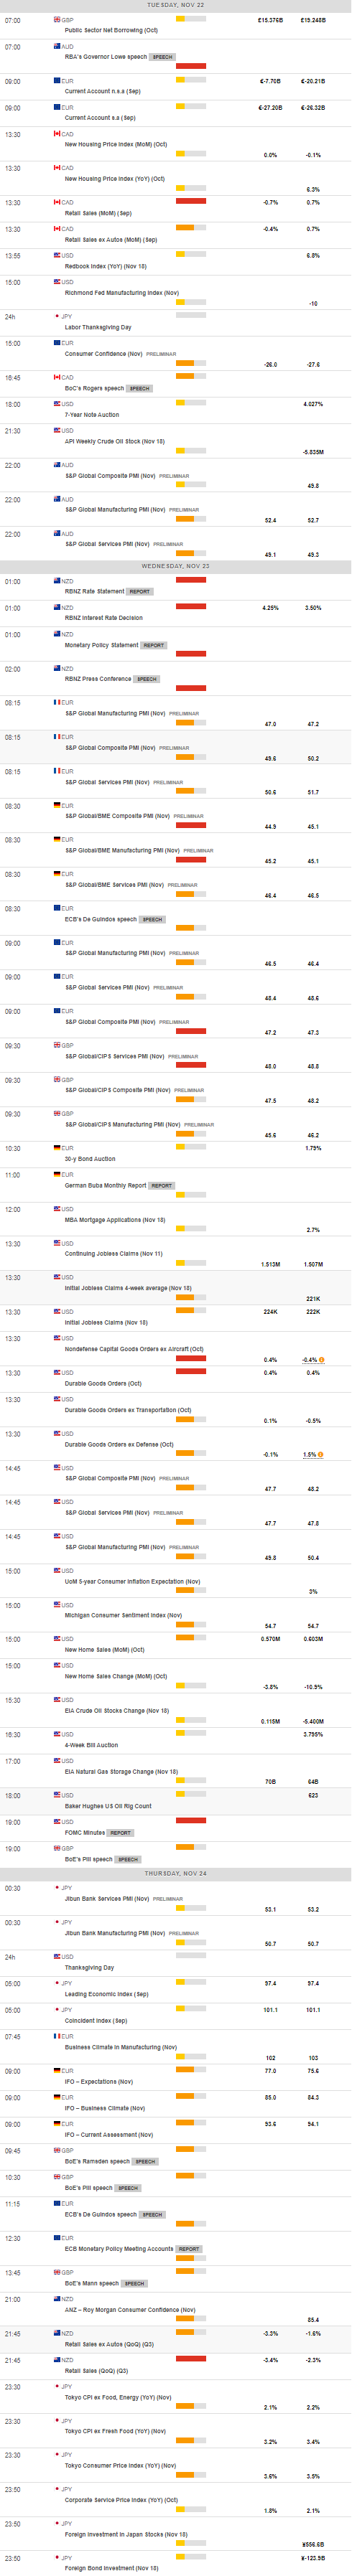
MACROECONOMIC EVENTS
All Information & Updates provided by:

All information relating to the financial markets available on this page has been prepared and issued by FXStreet (Forexstreet SL, Spain, Reg: B62498233) on the basis of publicly available information and all information believed to be reliable and does not conflict with Kuwaiti local laws, and all necessary care has been taken to before the company to ensure that the facts mentioned are correct from the source.
NCM Investment nor any of its directors or employees shall in any way be held responsible for the contents of this news, and the information contained on this page is intended only to provide clients with publicly available information and should not be construed as investment advice, report or analysis and/or constitute an offer or invitation to buy or sell financial instruments of any kind.
RISK WARNING: Forex and CFDs are highly risky leveraged products, as losses can exceed deposits. Please ensure you understand all the risks and take independent advice if necessary. NCM will segregate the clients based on the criteria of the regulator and its bylaws. NCM does not provide any advisory service; the material published does not constitute advice or a recommendation for a transaction in any financial instrument. NCM accepts no responsibility for any use of the content presented and any consequences of that use. Anyone acting on the information provided does so at their own risk.