
- Contact Us:
-

-

-

-


Daily Market Updates
23 Nov 2022
EURUSD
EUR/USD regained the smile and managed to back pedal three consecutive sessions with losses and advanced markedly on turnaround Tuesday. Indeed, the pair bounced off Monday’s lows in the vicinity of 1.0220 and reclaimed the area above the 1.0300 barrier.
The improvement in spot came in response to an impasse in the recent strong rebound in the dollar, which met a tough barrier at the 108.00 neighbourhood – or multi-session peaks - so far this week (November 21).
The daily gains in the pair were also accompanied by declining US yields, while the German 10-year benchmark yields dropped below the key 2.0% mark.
In the meantime, the macro scenario in the FX universe remained unchanged, where expectations around the probable pivot in the Fed’s policy continue to be in the centre of the debate.
In the euro docket, the preliminary gauge of the Consumer Confidence in the broader Euroland tracked by the European Commission is seen improving a tad to -23.9 for the current month (from -27.5).
-638047424444069735.png)
In the US, the Richmond Fed Manufacturing Index ticked higher to -3 in November (from -10).
The decline in EUR/USD seems to have met some contention at 1.0222 (November 21) so far. Extra weakness should target the September high at 1.0197 (September 12) seconded by the 100- and 55-day SMAs at 1.0021 and 0.9945, respectively, prior to the 0.9935 level (November 10) and the November low at 0.9730 (November 3). By contrast, the 200-day SMA at 1.0400 emerges as the initial up barrier before the November top at 1.0481 (November 15) and the round level at 1.0500. Once cleared, a test of the weekly peak at 1.0614 (June 27) could return to the investors’ radar ahead of the June high at 1.0773 (June 9) and the May top at 1.0786 (May 30). The daily RSI improved to the 60 zone.
Resistance levels: 1.308 1.0396 1.0438 (4H chart)
Support levels: 1.0222 1.0098 0.9959 (4H chart)
-638047424306425349.png)
USDJPY
The recovery in USD/JPY halted after four consecutive daily advances following another failed attempt to surpass the 142.00 hurdle in a sustainable fashion.
The daily pullback in the pair came in line with the retracement in the dollar after hitting fresh multi-session peaks on Monday, as well as the absence of traction in US yields, which remained around Monday’s close.
No data releases or events scheduled in the Japanese calendar on Tuesday left investors focused on Thursday’s preliminary PMIs and the final readings of the Coincident Index and the Leading Economic Index.
USD/JPY now seems to have met a decent resistance at 142.25 (November 21). An advance beyond this level exposes the temporary 55-day SMA at 144.87 ahead of the weekly top at 148.84 (October 31) and the 2022 peak at 151.94 (October 21). Just the opposite, the November low at 137.65 (November 15) is predicted to hold the downside before the weekly low at 135.80 (August 23). The loss of this region could put a visit to the key 200-day SMA at 133.58 back on the radar prior to the August low at 130.39 (August 2). The daily RSI deflated to the sub-42 area.
Resistance levels: 142.25 142.48 145.77 (4H chart)
Support levels: 141.08 138.87 137.65 (4H chart)
-638047425189318372.png)
GBPUSD
GBP/USD regained composure and back pedaled Monday’s downtick, advancing briefly above the 1.1900 mark on Tuesday. Despite the daily advance, Cable kept unchanged the so far multi-session consolidation theme in the area close to monthly highs.
The resumption of the selling bias in the greenback lent wings to the risk complex and sponsored the daily uptick in the sterling, in line with the broad-based improvement in the rest of its risky peers.
In the UK docket, Public Sector Net Borrowing shrank to £12.7B during October in what was the only release for the day.
If GBP/USD manages to break above the current consolidation, it should retarget the November high at 1.2028 (November 15) prior to the August top at 1.2293 (August 1) and followed by the weekly peak at 1.2405 (June 16). Further up, there are no resistance levels of note until the May high at 1.2666 (May 27). On the downside, there are interim contention at the 100- and 55-day SMAs at 1.1638 and 1.1393, respectively, ahead of the November low at 1.1142 (November 4) and the weekly low at 1.1059 (October 21). The daily RSI ticked a tad higher and surpassed 60.
Resistance levels: 1.1957 1.2028 1.2142 (4H chart)
Support levels: 1.1762 1.1709 1.1447 (4H chart)
-638047424885489127.png)
AUDUSD
The recovery in the risk complex helped the AUD/USD reverse four consecutive daily retracements and reclaim the area well north of the 0.6600 mark on Tuesday.
The commodity complex, however, seems it could not fully capitalize on the weaker dollar, as copper prices managed to set aside part of the recent leg lower but the iron ore remained under pressure.
Nothing scheduled Down Under other than the speech by RBA Governor P.Lowe, who reiterated the bank is expected to keep the hiking cycle in place over the period ahead at the time and also noted that the policy is not on a pre-set path.
Despite the daily bounce, AUD/USD still looks under pressure and the resumption of the bearish sentiment could motivate it to revisit the temporary 55-day SMA at 0.6514 prior to the weekly low at 0.6386 (November 10). If breached, then a probable move to the November low at 0.6272 (November 3) could emerge on the horizon before the 2022 low at 0.6169 (October 13) and the psychological 0.6000 mark. In the opposite direction, the 100-day SMA is expected to offer temporary resistance ahead of the November peak at 0.6797 (November 15) and the September high at 0.6916 (September 13). The surpass of the latter could lead up to a test of the 200-day SMA at 0.6939 ahead of the psychological 0.7000 mark. The daily RSI picked up pace and approached 57.
Resistance levels: 0.6651 0.6730 0.6797 (4H chart)
Support levels: 0.6584 0.6440 0.6386 (4H chart)
-638047425530175965.png)
GOLD
Prices of the ounce troy of gold could not sustain the earlier climb to the $1,750 region and retreated to the $1,740 area, up marginally for the day.
Indeed, the precious metal failed to take any advantage from the selling pressure hitting the dollar as well as the corrective decline in US yields. At least, bullion succeeded in halting a 4-session negative streak on Tuesday.
In the meantime, the yellow metal continues to closely follow developments from the potential Fed’s pivot vs. the recent hawkish messages from Fed speakers.
If sellers remain in control, gold could revisit the weekly low at $1,732 (November 21). The breach of this level should give way to the 100- and 55-day SMAs at $1,711 and $1,685, respectively, ahead of the 2022 low at $1,614 (September 28) and the round level at $1,600. On the upside, bulls will attempt to retest the November top at $1,786 (November 15) prior to the critical $1,800 zone, where the key 200-day SMA at $1,800 and the August top at $1,807 (August 10) converge. Further north comes the June high at $1,879 (June 13).
Resistance levels: $1,749 $1,767 $1,786 (4H chart)
Support levels: $1,732 $1,702 $1,686 (4H chart)
-638047425840731666.png)
CRUDE WTI
Prices of the American benchmark for the sweet light crude oil rose to 2-day highs past the $82.00 mark per barrel on Tuesday, extending the recovery seen at the beginning of the week.
Indeed, the upbeat tone among traders came in response to the likelihood that the OPEC+ could maintain its output cut at the December meeting, which somewhat offset renewed recession concerns – stemming from the recent hawkish tone from Fed rate setters – and omnipresent demand worries following the late surge of COVID cases in China and the subsequent lockdown measures.
Later in the NA session, the API will report on US crude oil supplies in the week to November 18.
Further rebound in prices of the WTI is expected to test the 55-day SMA at $85.58 ahead of the $90.08 level (November 11). North from here aligns the November peak at $93.73 seconded by the weekly high at $97.65 (August 30). If bulls push harder, then the key 200-day SMA at $98.09 could emerge on the horizon before the psychological $100.00 mark per barrel. On the contrary, there is an initial support at the 2022 low at $74.30 (January 3) followed by the round level at $70.00. The breakdown of this level could open the door to the weekly low at $66.15 (December 20 2021) ahead of the December 2021 low at $62.46 (December 2).
Resistance levels: $82.35 $85.42 $86.85 (4H chart)
Support levels: $75.27 $74.26 $67.52 (4H chart)
-638047426411209627.png)
DOW JONES
Equities tracked by the three major US stock indices reversed the pessimism seen on Monday on the back of positive news from the retail sector, while some prudence also emerged in light of new Chinese restrictions following COVID cases.
While investors wait for the release of the FOMC Minutes on Wednesday, the Dow Jones gained 0.93% to 34,014, the S&P500 advanced 1.02% to 3,990 and the tech-reference Nasdaq Composite rose 0.84% to 11,117.
Dow Jones clinched a new November top at 34.036. Further up appears the August peak at 34,281 (August 16) seconded by the April high at 35,492. Contrarily, the key 200-day SMA at 32,488 should offer decent support ahead of the November low at 31,727 (November 3) and the 100-day SMA at 31,753. The breakdown of this level exposes a temporary support at the 55-day SMA at 31,315 ahead of the 30,206 level (October 21) and the 2022 low at 28,660 (October 13). The daily RSI gathered pace and flirted with 69.
Top Performers: Home Depot, Dow, Chevron
Worst Performers: Walt Disney, Amgen, Boeing
Resistance levels: 34,036 34,281 35,492 (4H chart)
Support levels: 33,239 32,478 31,727 (4H chart)
-638047426753389592.png)
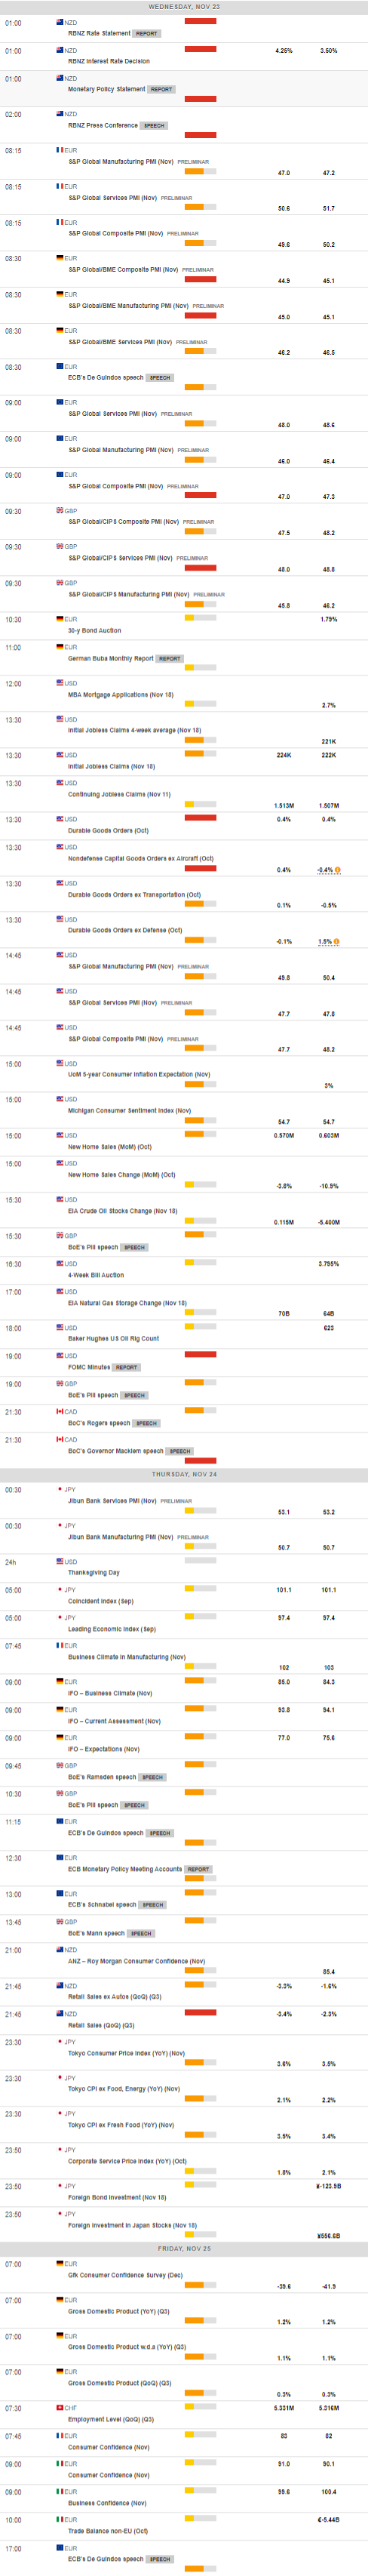
MACROECONOMIC EVENTS
All Information & Updates provided by:

All information relating to the financial markets available on this page has been prepared and issued by FXStreet (Forexstreet SL, Spain, Reg: B62498233) on the basis of publicly available information and all information believed to be reliable and does not conflict with Kuwaiti local laws, and all necessary care has been taken to before the company to ensure that the facts mentioned are correct from the source.
NCM Investment nor any of its directors or employees shall in any way be held responsible for the contents of this news, and the information contained on this page is intended only to provide clients with publicly available information and should not be construed as investment advice, report or analysis and/or constitute an offer or invitation to buy or sell financial instruments of any kind.
RISK WARNING: Forex and CFDs are highly risky leveraged products, as losses can exceed deposits. Please ensure you understand all the risks and take independent advice if necessary. NCM will segregate the clients based on the criteria of the regulator and its bylaws. NCM does not provide any advisory service; the material published does not constitute advice or a recommendation for a transaction in any financial instrument. NCM accepts no responsibility for any use of the content presented and any consequences of that use. Anyone acting on the information provided does so at their own risk.