
- Contact Us:
-

-

-

-


Daily Market Updates
24 Nov 2022
EURUSD
EUR/USD extended the weekly recovery and ephemerally tested the 1.0400 barrier on Wednesday, always on the back of the poor session in the dollar.
Indeed, another negative performance in the greenback saw the USD Index (DXY) trade close to the 106.00 support and flirt with multi-day lows. The downside in the buck was particularly exacerbated in the wake of the release of the FOMC Minutes of the November gathering.
In addition, the improved sentiment in the risk complex and declining US yields weighed further on the dollar and thus propped up the daily climb in spot.
From the FOMC Minutes, participants agreed that a slower pace of rate hikes could allow policymakers to assess the progress of the normalization process given the usual lags in monetary policy. In addition, participants saw the policy approaching a “sufficiently restrictive” territory, at the time when they agreed on the absence of signals that inflation is losing traction and that risks remain tilted to the upside. Several members, in the meantime, showed significant uncertainty over the ultimate level of the interest rate needed to tame inflation, but they agreed that rates will be higher than initially predicted.
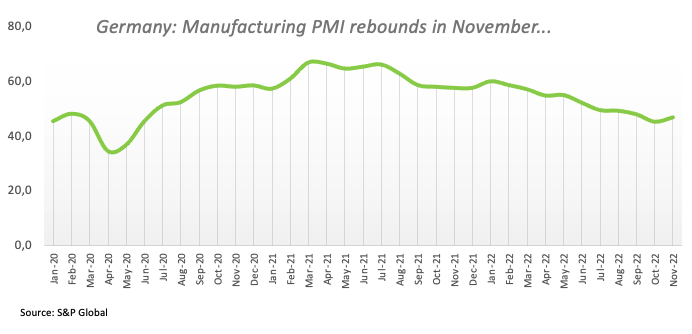
In the docket, Germany’s preliminary figures for the Manufacturing and Services PMIs for the month of November surpassed consensus at 46.7 and 46.4, respectively. Same trend was observed in the broader Euroland, where the Manufacturing PMI is expected at 47.3 and the Services PMI is seen at 48.6.
Busy calendar in the US ahead of the Thanksgiving Day holiday on Thursday. That said, MBA Mortgage Applications increased 2.2% in the week to November 18, Durable Goods Orders expanded 1.0% MoM in October, Initial Jobless Claims rose by 240K in the week to November 19 and the final Michigan Consumer Sentiment retreated to 56.8 in the current month. Finally, the Flash Manufacturing PMI is expected at 47.6 in November and 46.1 when it comes to the Services PMI and New Home Sales expanded 7.6% MoM in October, or 0.632M units.
In case sellers regain the initiative, EUR/USD could revisit the weekly low at 1.0222 (November 21) ahead of the September high at 1.0197 (September 12). The loss of this level leaves the pair vulnerable to a potential drop to the 100- and 55-day SMAs at 1.0023 and 0.9951, respectively, before the 0.9935 level (November 10) and the November low at 0.9730 (November 3). On the flip side, there is an initial hurdle at the key 200-day SMA at 1.0395 ahead of the November peak at 1.0481 (November 15) and the round level at 1.0500. Beyond the latter, the pair could confront the weekly high at 1.0614 (June 27) before the June top at 1.0773 (June 9) and the May peak at 1.0786 (May 30). The daily RSI ticked higher and flirted with 66.
Resistance levels: 1.0400 1.0438 1.0481 (4H chart)
Support levels: 1.0222 0.9967 0.9935 (4H chart)
-638048294731944110.png)
USDJPY
USD/JPY clinched the second session in a row with losses and retreated to multi-session lows below the 140.00 mark on Wednesday.
In fact, renewed weakness in the pair came in response to the deteriorated sentiment around the greenback, which prompted the USD Index (DXY) to drop markedly and revisit the vicinity of the 106.00 mark, while the negative day in US yields across the curve also added to the daily decline.
The vacuum of data releases in the Japanese docket motivated traders to shift the focus to the preliminary PMIs and the final readings of the Coincident Index and the Leading Economic Index, all due on Thursday.
USD/JPY faces the immediate up barrier at the weekly top at 142.25 (November 21) ahead of the interim 55-day SMA at 144.82 and the weekly peak at 148.84 (October 31). The advance beyond the latter opens the door to a probable test of the 2022 high at 151.94 (October 21). On the other hand, initial contention remains at the November low at 137.65 (November 15) prior to the weekly low at 135.80 (August 23). A deeper pullback could motivate the key 200-day SMA at 133.71 to emerge on the horizon before the August low at 130.39 (August 2). The daily RSI lost further momentum and poked with 36.
Resistance levels: 142.25 142.48 145.57 (4H chart)
Support levels: 139.42 138.87 137.65 (4H chart)
-638048295477965217.png)
GBPUSD
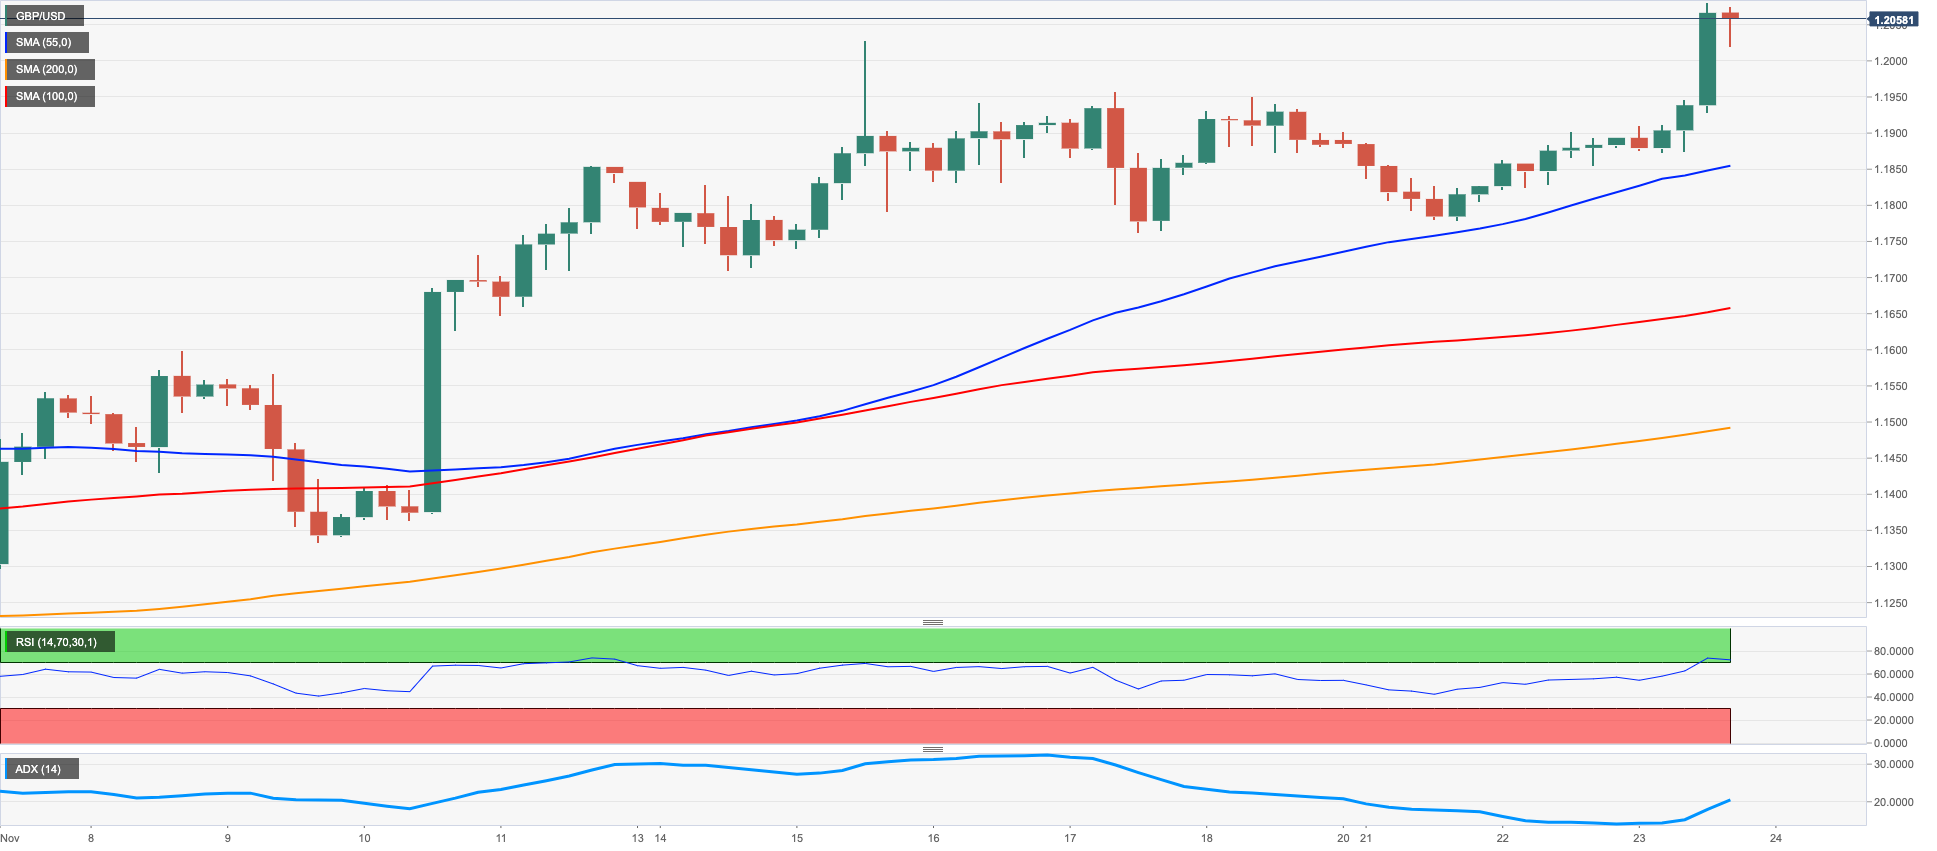
GBP/USD advanced to new 3-month highs around 1.2080 on Wednesday in response to the pick-up in the bearish momentum in the greenback, which saw its decline magnified following the release of the FOMC Minutes of the November event.
Further weakness in the greenback put the USD Index (DXY) under extra pressure and fueled the ongoing bounce in the British pound and the rest of the risk-linked galaxy midweek.
In the UK, preliminary readings expect the Services PMI to remain unchanged at 48.8 in November, while the Manufacturing PMI is also seen steady at 46.2. Both prints, however, came in above expectations.
Further gains in GBP/USD are seen targeting the November top at 1.2080 (November 23) ahead of the August peak at 1.2293 (August 1) and seconded by the weekly high at 1.2405 (June 16). The breakout of this level exposes a probable move to the May top at 1.2666 (May 27). Contrarily, the 100- and 55-day SMAs at 1.1639 and 1.1401, respectively, are seen offering temporary contention prior to the November low at 1.1142 (November 4) and before the weekly low at 1.1059 (October 21). The daily RSI edged higher and approached the 65 level.
Resistance levels: 1.2080 1.2142 1.2276 (4H chart)
Support levels: 1.1778 .1762 1.1709 (4H chart)
AUDUSD
The much weaker note in the greenback saw AUD/USD clinch the second session in a row with gains on Wednesday. Furthermore, the pair tested once again the zone above the 0.6700 level, or 4-day highs.
The offered bias in the dollar lent oxygen to the commodity complex and motivated copper prices to chart tepid gains vs. a marginal drop in prices of the tonne of iron ore.
Nothing scheduled in the Australian calendar until the release of flash Retail Sales for the month of October due on November 28.
AUD/USD is now predicted to challenge the November top at 0.6797 (November 15) followed by the September peak at 0.6916 (September 13). Beyond this level emerges the 200-day SMA at 0.6937 prior to the psychological 0.7000 yardstick, which also precedes the weekly high at 0.7008 (August 26) before the August top at 0.7136 (August 11). By contrast, the weekly low at 0.6584 (November 21) should hold the initial test seconded by the 55-day SMA at 0.6512 and the weekly low at 0.6386 (November 10). The breakdown of this region exposes the November low at 0.6272 (November 3) ahead of the 2022 low at 0.6169 (October 13) and the psychological 0.6000 mark. The daily RSI bounced further and trespassed the 61 mark.
Resistance levels: 0.6733 0.6797 0.6916 (4H chart)
Support levels: 0.6584 0.6447 0.6386 (4H chart)
-638048295783404923.png)
GOLD
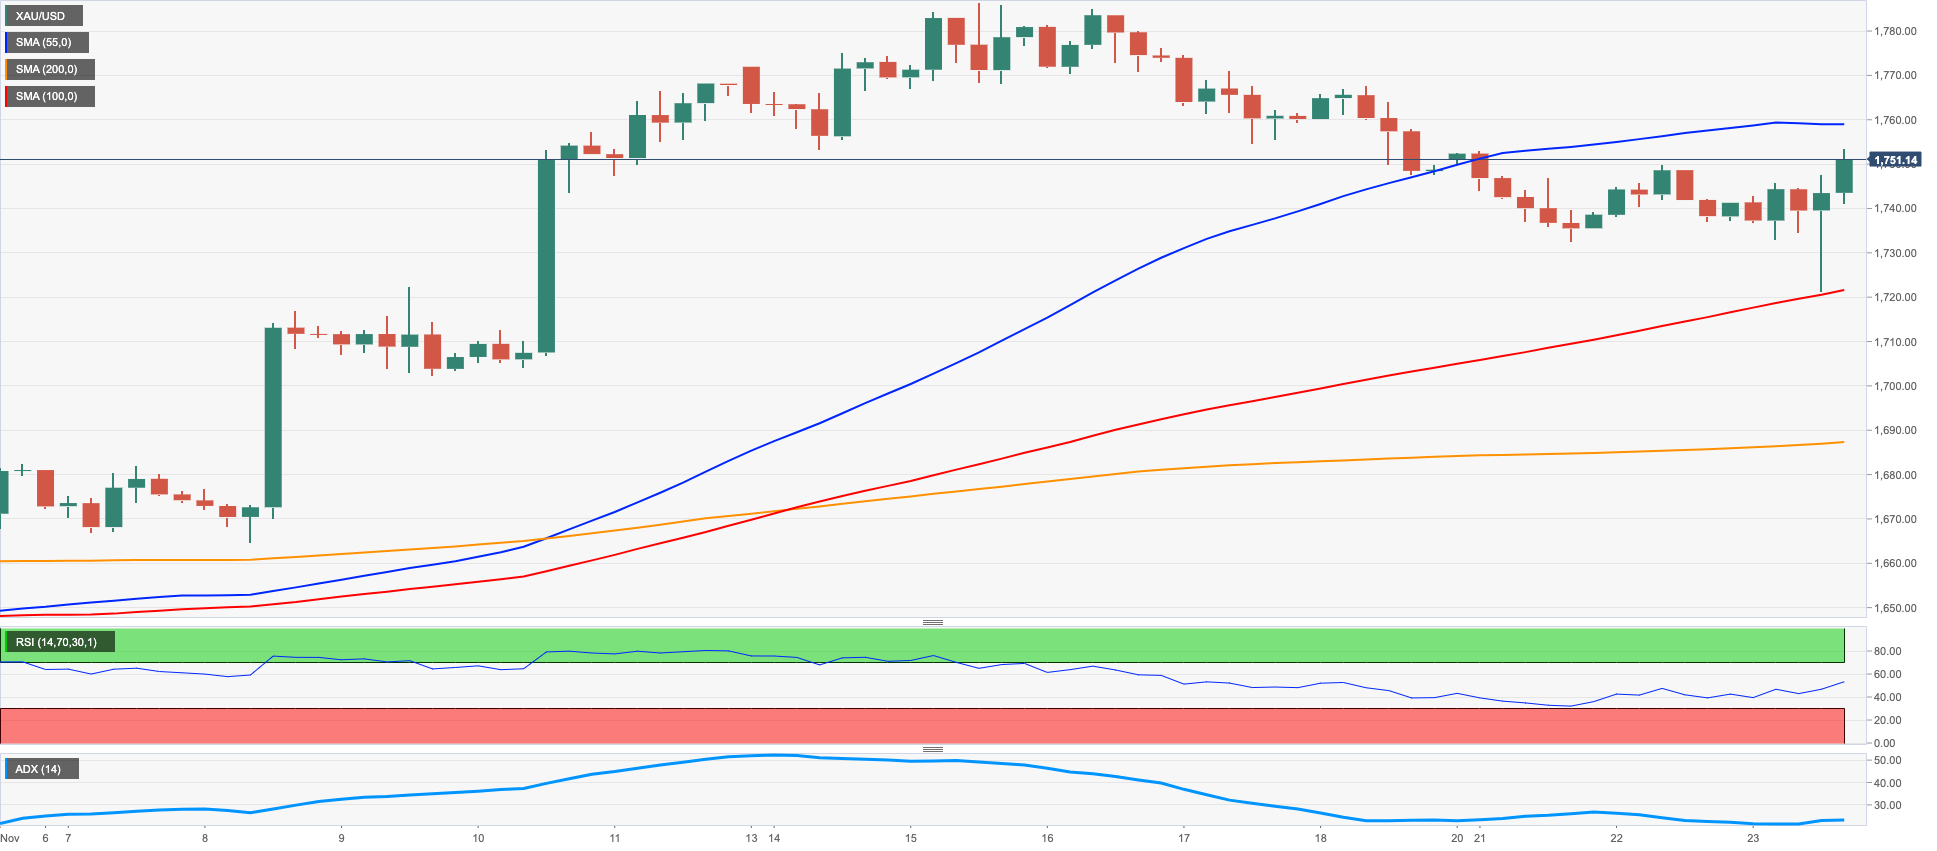
Another bearish session in the dollar motivated the yellow metal to add to Tuesday’s advance and revisit levels just above the $1,750 mark per ounce troy on Wednesday.
Indeed, the daily retracement in the greenback came along marked losses in US yields across the curve, which underpinned further the positive performance in bullion.
Extra support for the precious metal came after the FOMC Minutes of the November event showed members’ support to a slower pace of future interest rate hikes.
The November peak at $1,786 (November 15) emerges as the immediate obstacle for the continuation of the upside momentum ahead of the critical $1,800 zone, home of the key 200-day SMA and the August high at $1,807 (August 10). Beyond this region, the next hurdle of note is seen not before the June top at $1,879 (June 13). On the contrary, sellers should meet the next support at the weekly low at $1,732 (November 21) prior to the 100- and 55-day SMAs at $1,711 and $1,685, respectively. The loss of this zone could put the 2022 low at $1,614 (September 28) back on the radar before the round level at $1,600.
Resistance levels: $1,753 $1,767 $1,786 (4H chart)
Support levels: $1,727 $1,702 $1,686 (4H chart)
CRUDE WTI
WTI prices dropped more than 4% and revisited the sub-$77.00 region on Wednesday, trading at shouting distance from Monday’s 10-month lows around $75.30 per barrel.
News that the G7 could cap Russian oil prices above current levels in combination with an unexpectedly large gasoline stockpiles build during last week and demand concerns coming from China and the unabated rise in COVID cases all depressed the sentiment among traders and forced crude oil prices to retreat further.
According to the EIA’s report, crude oil inventories shrank by 3.691M barrels in the week to November 18, supplies at Cushing went down by 0.887M barrels, distillate stocks increased by 1.718M barrels and gasoline stockpiles rose by 3.058M barrels.
The 2022 low at $74.30 (January 3) remains the immediate magnet for oil bears for the time being. The loss of this level could open the door to the round level at $70.00, while south from here emerges the weekly low at $66.15 (December 20 2021) prior to the December 2021 low at $62.46 (December 2). In the opposite direction, the 55- and 100-day SMAs at $85.49 and $89.11, respectively, offer temporary resistance before the $90.08 level (November 11). Once cleared, the WTI could confront the November high at $93.73 prior to the weekly top at $97.65 (August 30) and the key 200-day SMA at $98.02. Further up aligns the psychological $100.00 mark per barrel.
Resistance levels: $82.35 $85.42 $86.56 (4H chart)
Support levels: $76.85 $75.27 $74.26 (4H chart)
-638048296756030127.png)
DOW JONES
US equities accelerated their daily gains and added to the weekly leg higher after the FOMC Minutes of the November meeting opened the door to a slower pace of upcoming interest rate hikes.
Indeed, and following the publication of the Minutes, CME Group’s FedWatch Tool noted the probability of a 50 bps rate hike at the December 14 gathering rose to around 80%.
If the Dow Jones breaks above the November peak at 34,262 (November 23) it could then put the August high at 34,281 (August 16) back on the investors’ radar seconded by the April top at 35,492. Inversely, there is an initial support at the weekly low at 33,239 (November 17) ahead of the key 200-day SMA at 32,482 and the November low at 31,727 (November 3). South from here turns up the 55-day SMA at 31,363 before the 30,206 level (October 21) and the 2022 low at 28,660 (October 13). The daily RSI traded close to the overbought zone near 70.
Top Performers: Walt Disney, Salesforce Inc, Boeing
Worst Performers: Verizon, Chevron, Amgen
Resistance levels: 34,262 34,281 35,492 (4H chart)
Support levels: 33,239 32,478 31,727 (4H chart)
-638048297042863698.png)
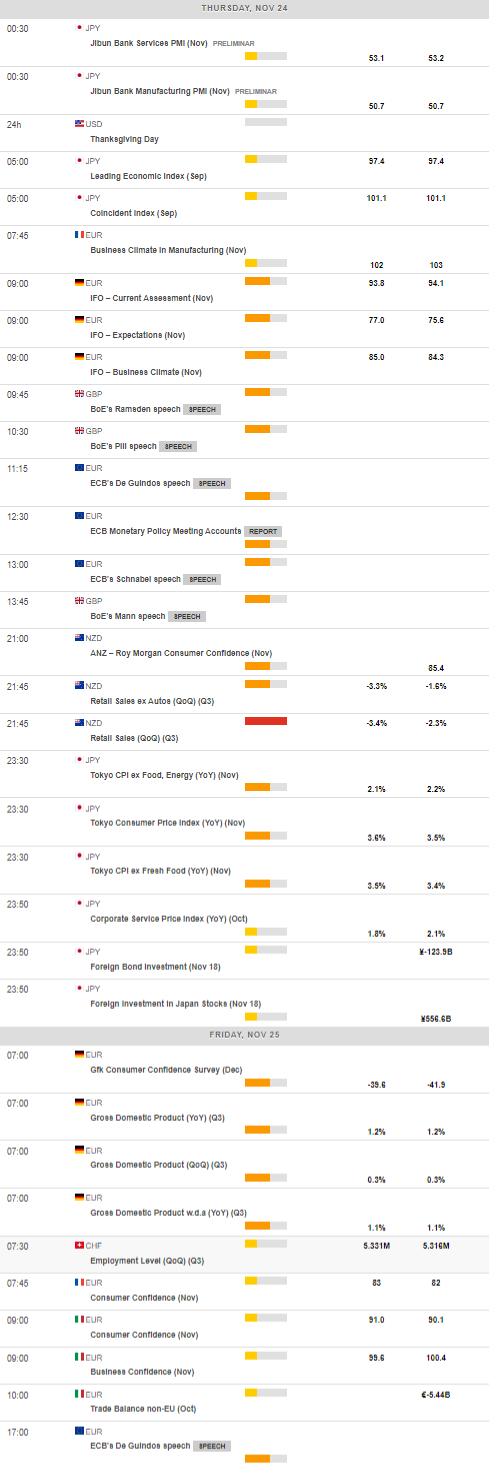
MACROECONOMIC EVENTS
All Information & Updates provided by:

All information relating to the financial markets available on this page has been prepared and issued by FXStreet (Forexstreet SL, Spain, Reg: B62498233) on the basis of publicly available information and all information believed to be reliable and does not conflict with Kuwaiti local laws, and all necessary care has been taken to before the company to ensure that the facts mentioned are correct from the source.
NCM Investment nor any of its directors or employees shall in any way be held responsible for the contents of this news, and the information contained on this page is intended only to provide clients with publicly available information and should not be construed as investment advice, report or analysis and/or constitute an offer or invitation to buy or sell financial instruments of any kind.
RISK WARNING: Forex and CFDs are highly risky leveraged products, as losses can exceed deposits. Please ensure you understand all the risks and take independent advice if necessary. NCM will segregate the clients based on the criteria of the regulator and its bylaws. NCM does not provide any advisory service; the material published does not constitute advice or a recommendation for a transaction in any financial instrument. NCM accepts no responsibility for any use of the content presented and any consequences of that use. Anyone acting on the information provided does so at their own risk.