
- Contact Us:
-

-

-

-


Daily Market Updates
25 Nov 2022
EURUSD
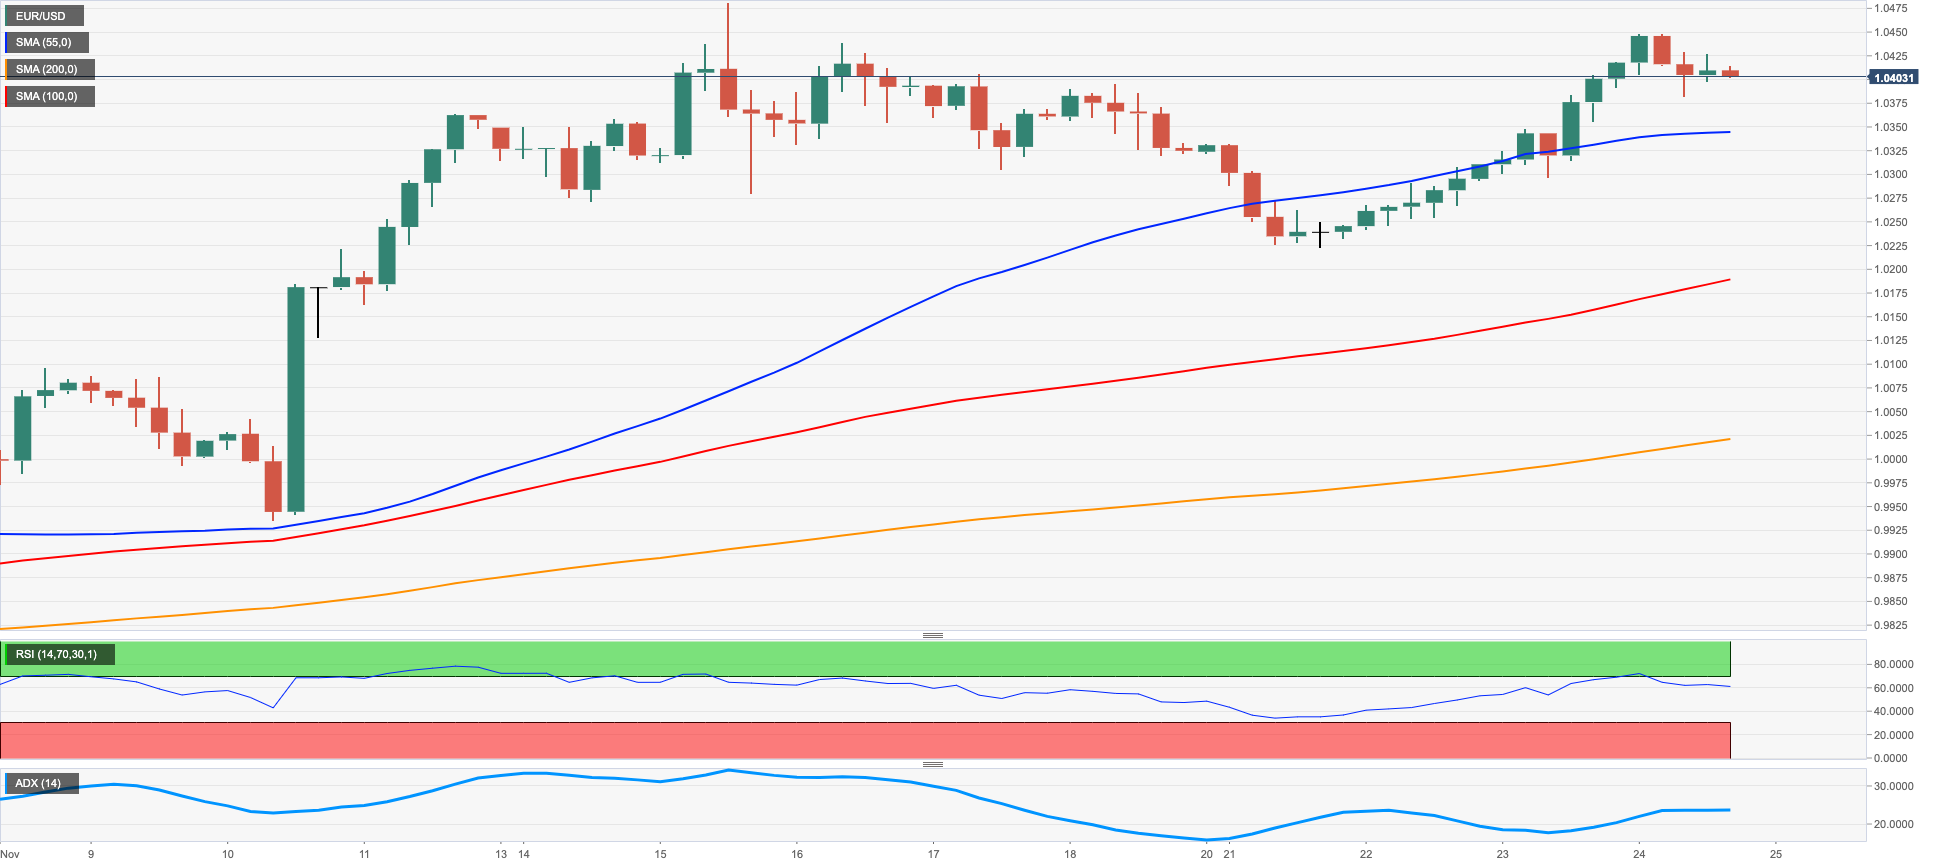
EUR/USD managed to surpass the 1.0400 barrier and clinch new multi-session highs near 1.0450 on Thursday, although the bullish attempt fizzled out afterwards.
The offered bias in the greenback dragged the USD Index (DXY) to new lows near 105.60 amidst reduced trade conditions following the inactivity in the US markets due to the Thanksgiving Day holiday.
Thursday’s price action in the pair was also accompanied by the downtick in the German 10-year bund yields to the 1.80% region, an area last seen back in early October.
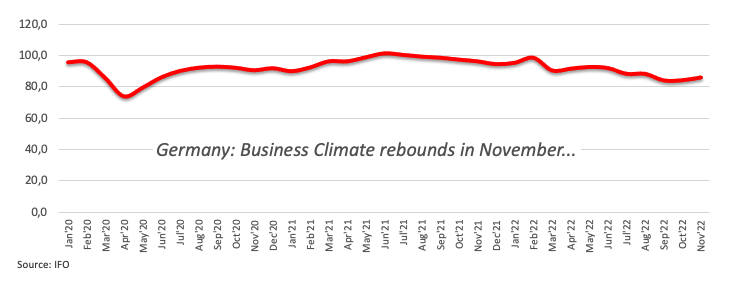
Further oxygen to the single currency also came from the domestic calendar after the Business Climate in Germany rebounded to 86.3 in November (from 84.5), while the ECB Accounts showed that most members supported a 75 bps rate hike, while a worsening inflation outlook was widely accepted. The Accounts also suggested that a decline in the economic activity won’t suffice to significantly reduce inflation. In addition, the normalization process is expected to continue unless a deep and extended recession emerges.
Still around the ECB, Board member Knot advocated for further interest rate hikes in the next meeting, while rumours around a potential 50 bps rate hike at the December meeting were also doing the rounds in the old continent on Thursday.
The surpass of the weekly high at 1.0448 (November 24) should motivate EUR/USD to challenge the November high at 1.0481 (November 15) prior to the round level at 1.0500. The continuation of the rebound could put the weekly top at 1.0614 (June 27) back on the investors’ radar ahead of the June peak at 1.0773 (June 9) and the May high at 1.0786 (May 30). By contrast, the weekly low at 1.0222 (November 21) is seen offering initial contention followed by the September top at 1.0197 (September 12). Below the latter comes the 100- and 55-day SMAs at 1.0026 and 0.9960, respectively, prior to the 0.9935 level (November 10) and the November low at 0.9730 (November 3). The daily RSI appeared stable around 65.
Resistance levels: 1.0448 1.0481 1.0614 (4H chart)
Support levels: 1.0296 1.0222 0.9967 (4H chart)
USDJPY
USD/JPY dropped further and recorded new weekly lows in the boundaries of the 138.00 neighbourhood on Thursday.
The inactivity in the US markets due to the Thanksgiving Day holiday left the dollar’s price action as the exclusive driver of the pair on Thursday.
Indeed, the persistent appetite for the risk complex weighed further on the buck, while the prospects for a slower pace of future interest rate hikes by the Federal Reserve also collaborated with the decline.
In Japan, the preliminary Manufacturing and Services PMIs are seen at 49.4 and 50.0, respectively, in November. In addition, the final September readings of the Coincident Index and the Leading Economic Index came at 101.4 and 97.5, respectively.
USD/JPY traded at shouting distance from the November low at 137.65 (November 15). The loss of this level could pave the way for a deeper retracement to the weekly low at 135.80 (August 23) ahead of the key 200-day SMA at 133.82 and the August low at 130.39 (August 2). On the flip side, the weekly peak at 142.25 (November 21) emerges as the next up barrier followed by the temporary 55-day SMA at 144.69 and the weekly high at 148.84 (October 31). Above this region, the pair could challenge the 2022 high at 151.94 (October 21). The daily RSI headed towards the oversold territory around 33.
Resistance levels: 141.61 142.25 142.48 (4H chart)
Support levels: 138.04 137.65 136.19 (4H chart)
-638049152443773283.png)
GBPUSD
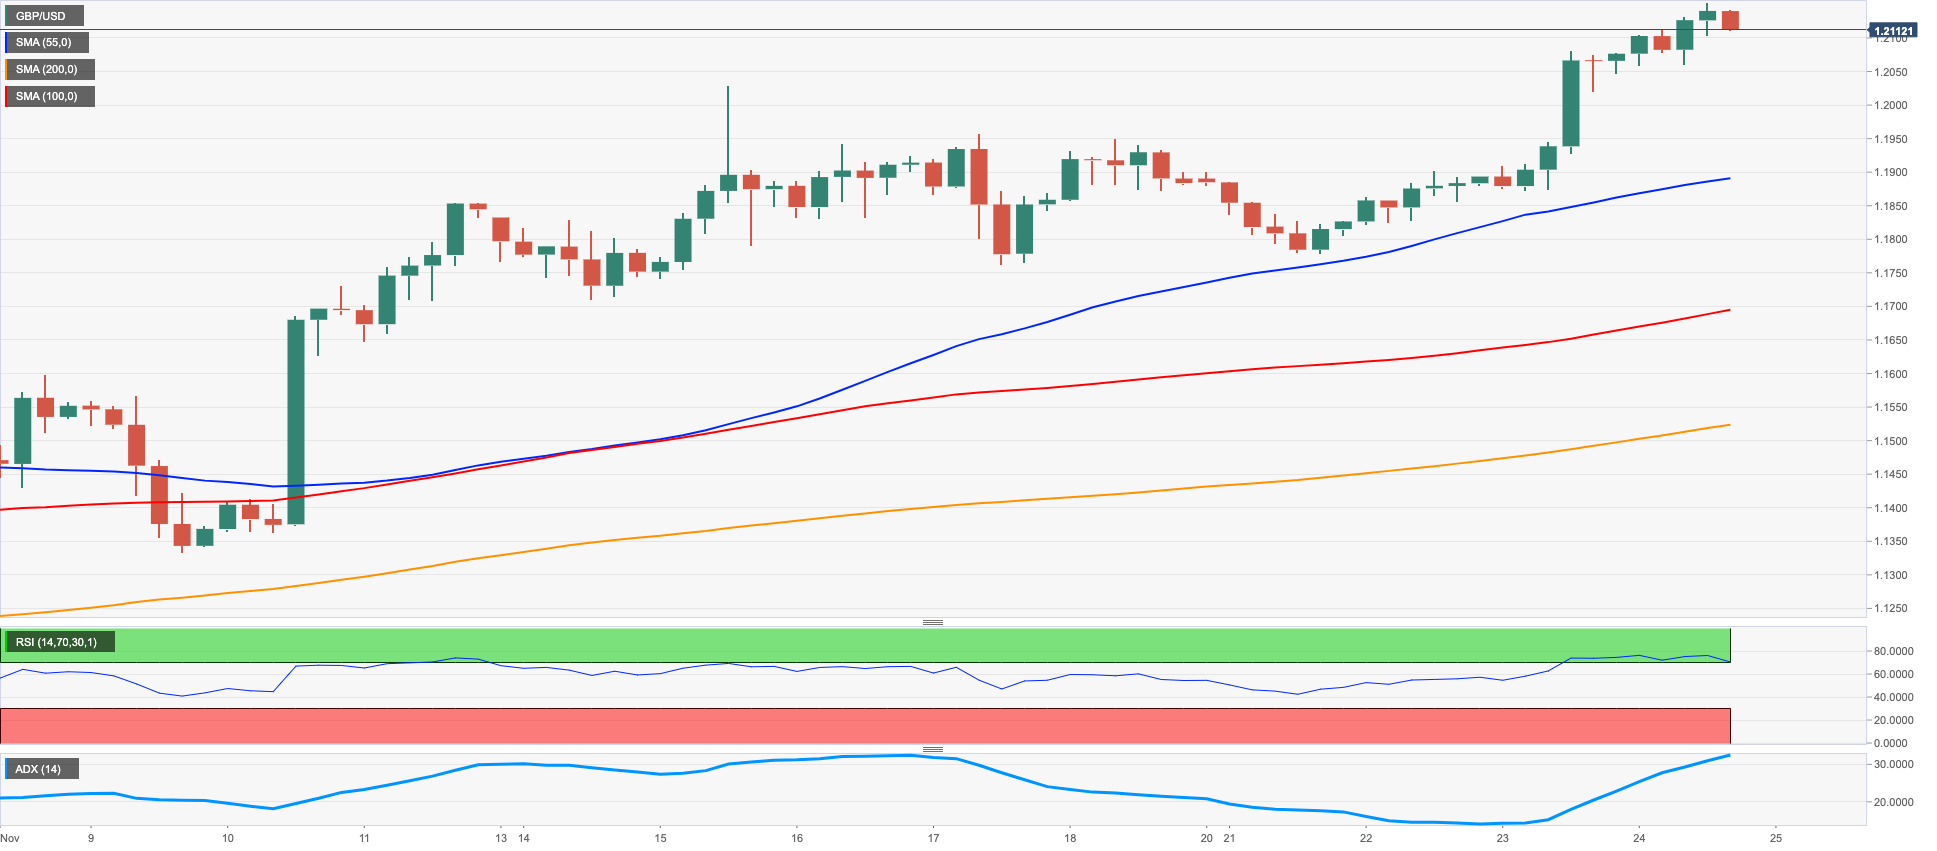
GBP/USD rose sharply to levels last seen back in mid-August north of 1.2100 the figure in response to further weakness hitting the dollar.
Indeed, the greenback continued to suffer the intense selling pressure which has particularly emerged following the publication of the FOMC Minutes during the European evening on Wednesday.
From the BoE, MPC member C.Mann said that UK risk premium remains reflected in the currency, adding that inflation expectations appear well above the bank’s 2% target. Mann noted that her inflation expectations are at the upper end of the BoE’s range of projections.
Data wise in the UK, the CBI Industrial Trends Orders dropped to -5 in November (from -4).
The rally in GBP/USD looks everything but abated. That said, immediately to the upside now emerges at the August high at 1.2293 (August 1) ahead of the weekly top at 1.2405 (June 16) and the May peak at 1.2666 (May 27). On the contrary, temporary contention is seen at the 100- and 55-day SMAs at 1.1641 and 1.1415, respectively, before the November low at 1.1142 (November 4) and the weekly low at 1.1059 (October 21). The daily RSI improved further and tested the 67 region.
Resistance levels: 1.2153 1.2276 1.2293 (4H chart)
Support levels: 1.1778 .1762 1.1709 (4H chart)
AUDUSD
Another daily sell-off in the dollar and the upbeat mood in the risk complex sponsored the third session in a row with gains in AUD/USD, this time advancing to the 0.6775/80 band, or multi-session highs.
Indeed, the dollar’s decline picked up extra pace in response to the publication of the FOMC Minutes on Wednesday, while the mild recovery in copper prices and the iron ore also added to the optimism around the Aussie dollar and helped mitigate demand concerns coming from China and the implementation of new lockdown measures in Beijing.
The Australian docket will be empty until the release of advanced Retail Sales for the month of October due on November 28.
AUD/USD trades closer to the November peak at 0.6797 (November 15). Once cleared, the pair could then dispute the September high at 0.6916 (September 13) prior to the key 200-day SMA at 0.6935. The breakout of the latter could put a test of the psychological 0.7000 mark back on the investors’ radar prior to the weekly top at 0.7008 (August 26) and the August peak at 0.7136 (August 11). Contrarily, the pair is expected to meet initial support at the weekly low at 0.6584 (November 21) ahead of the 55-day SMA at 0.6514 and the weekly low at 0.6386 (November 10). South from here turns up the November low at 0.6272 (November 3) before the 2022 low at 0.6169 (October 13) and the psychological 0.6000 yardstick. The daily RSI edged higher and trespassed the 63 level.
Resistance levels: 0.6775 0.6797 0.6916 (4H chart)
Support levels: 0.6584 0.6459 0.6386 (4H chart)
-638049152769041089.png)
GOLD
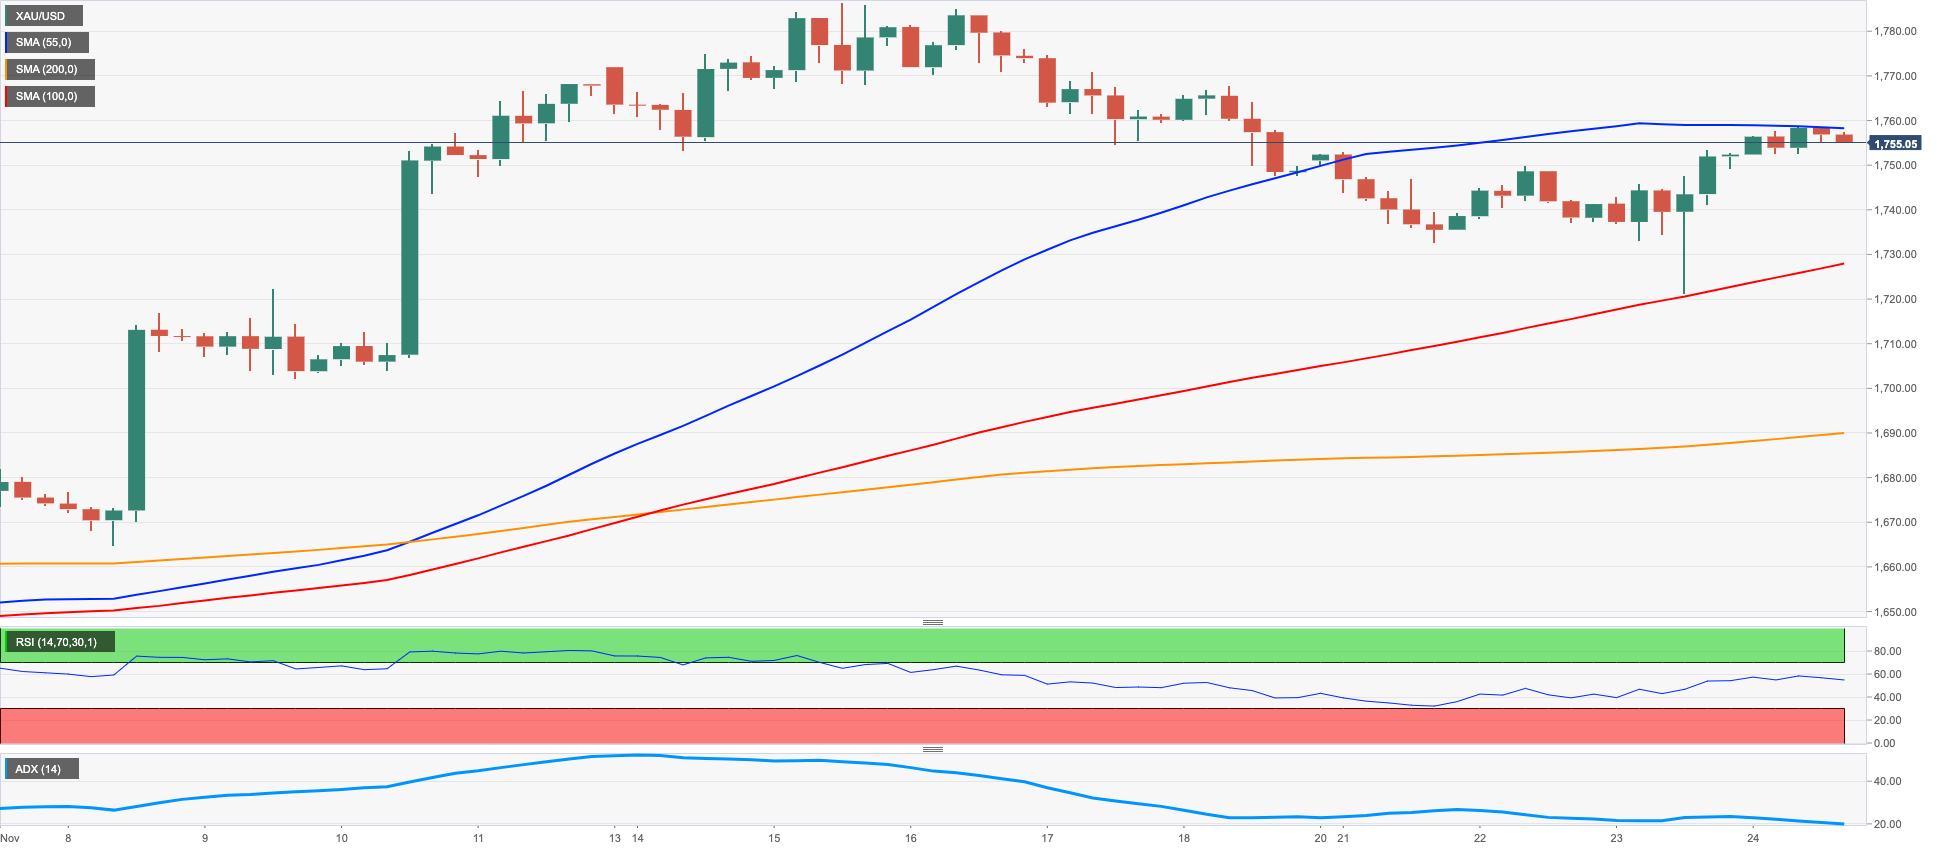
Gold prices extended the weekly recovery to the $1,760 region per ounce troy on Thursday, up for the third straight session at the same time.
Bullion traded in an upbeat fashion in response to further weakness in the dollar and the inactivity in the US money markets due to the Thanksgiving Day holiday.
In the meantime, the precious metal appears to have managed to get rid of some downside pressure after the FOMC Minutes signaled the likelihood that the Federal Reserve could slow the pace of the next interest rate hikes. So far, a 50 bps rate raise at the December 14 gathering seems the most likely scenario according to CME Group’s FedWatch Tool.
Further upside in gold continues to target the November high at $1,786 (November 15) just before the critical $1,800 zone, where the key 200-day SMA and the August top at $1,807 (August 10) converge. Further north aligns the June peak at $1,879 (June 13). Just the opposite, the immediate down barrier appears at the weekly low at $1,732 (November 21) seconded by the 100- and 55-day SMAs at $1,712 and $1,686, respectively. A deeper drop could prompt a test of the 2022 low at $1,614 (September 28) to start shaping up ahead of the round level at $1,600.
Resistance levels: $1,758 $1,767 $1,786 (4H chart)
Support levels: $1,727 $1,702 $1,686 (4H chart)
CRUDE WTI
WTI prices advanced marginally and briefly surpassed the $78.00 mark per barrel on Thursday.
Indeed, prices of the commodity mostly alternated gains with losses on renewed supply concerns after traders continued to digest the recently announced G7 cap on prices of Russian oil, which could be above the current levels.
In the meantime, demand concerns persisted following new lockdown measures in China, this time in Beijing, amidst unabated rise in COVID cases, while the unexpected surge in gasoline inventories, as per the latest EIA’s report, also weighed on the sentiment.
The WTI remains under pressure and the next support of note is still expected at the 2022 low at $74.30 (January 3). If the commodity breaks below that zone, it could then dispute the round level at $70.00 prior to the weekly low at $66.15 (December 20 2021) and the December 2021 low at $62.46 (December 2). On the flip side, the 55- and 100-day SMAs at $85.40 and $88.87, respectively, come first ahead of the $90.08 level (November 11) and the November top at $93.73. North from here aligns the weekly peak at $97.65 (August 30) seconded by the key 200-day SMA at $97.95 and just before the psychological $100.00 mark per barrel.
Resistance levels: $82.35 $85.42 $86.12 (4H chart)
Support levels: $76.85 $75.27 $74.26 (4H chart)
-638049153732389305.png)
DOW JONES
US markets were closed on Thursday due to the Thanksgiving Day holiday.
Equities tracked by the three major US stock indices extended the advance to levels last seen in mid-August on Wednesday, as investors’ sentiment continued to improve pari passu with the rising appetite for the risk complex, which was in turned underpinned by firmer speculation that the Federal Reserve could slow the pace of the future interest rate hikes.
Against that view, however, emerges the hawkish rhetoric from many Fed’s rate setters (led by St.Louis Fed J.Bullard), which is expected to be put to the test in light of upcoming results from key fundamentals (Payrolls, CPI).
Against all that, the Dow Jones rose 0.28% to 34,194, the S&P500 advanced 0.59% to 4,027 and the tech-benchmark Nasdaq Composite gained 0.99% to 11,285.
The Dow Jones recorded a new monthly high at 34,262 (November 23), which emerges just ahead of the August top at 34,281 (August 16) and precedes the April peak at 35,492. On the other hand, the weekly low at 33,239 (November 17) resurfaces as the immediate contention prior to the key 200-day SMA at 32,482 and ahead of the November low at 31,727 (November 3). The loss of the latter puts the 55-day SMA at 31,363 back on the radar prior to the 30,206 level (October 21) and the 2022 low at 28,660 (October 13). The daily RSI entered the overbought territory at 70.
Top Performers: Walt Disney, Salesforce Inc, Boeing
Worst Performers: Amgen, Home Depot, Chevron
Resistance levels: 34,262 34,281 35,492 (4H chart)
Support levels: 33,239 32,478 31,727 (4H chart)
-638049154030112444.png)
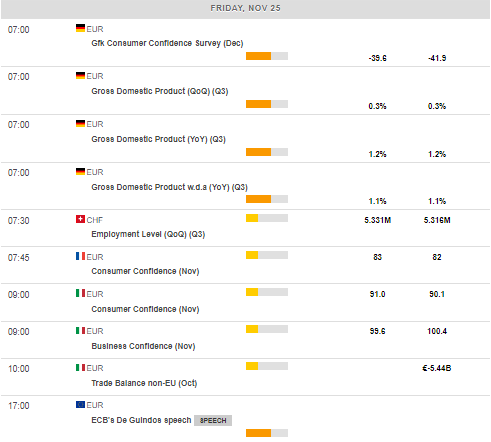
MACROECONOMIC EVENTS
All Information & Updates provided by:

All information relating to the financial markets available on this page has been prepared and issued by FXStreet (Forexstreet SL, Spain, Reg: B62498233) on the basis of publicly available information and all information believed to be reliable and does not conflict with Kuwaiti local laws, and all necessary care has been taken to before the company to ensure that the facts mentioned are correct from the source.
NCM Investment nor any of its directors or employees shall in any way be held responsible for the contents of this news, and the information contained on this page is intended only to provide clients with publicly available information and should not be construed as investment advice, report or analysis and/or constitute an offer or invitation to buy or sell financial instruments of any kind.
RISK WARNING: Forex and CFDs are highly risky leveraged products, as losses can exceed deposits. Please ensure you understand all the risks and take independent advice if necessary. NCM will segregate the clients based on the criteria of the regulator and its bylaws. NCM does not provide any advisory service; the material published does not constitute advice or a recommendation for a transaction in any financial instrument. NCM accepts no responsibility for any use of the content presented and any consequences of that use. Anyone acting on the information provided does so at their own risk.