
- Contact Us:
-

-

-

-


Daily Market Updates
28 Nov 2022
EURUSD
EUR/USD left behind three consecutive daily advances and traded with moderate losses at the end of the week, ending the session around the 200-day SMA in the 1.0385/80 band. That said, the pair closed the week with gains and looks well en route to end the second straight month with gains.
The daily decline in the pair came in response to a marked bounce in the dollar, which managed to reclaim the area above 106.00 the figure when gauged by the USD Index (DXY).
The reduced activity in the US money market, in the meantime, saw US yields regain some composure and reverse part of the recent retracement, the German 10-year bund yields rose to 2-day highs around 1.97%.
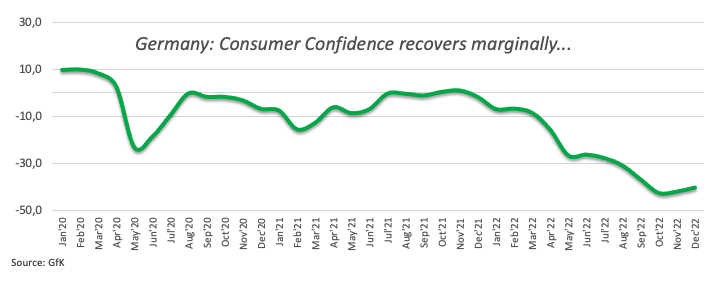
In the docket, final GDP figures showed the German economy expand 0.4% QoQ in the July-September period and 1.3% over the last twelve months, both prints surpassing estimates. An upside surprise also came from the Consumer Confidence measured by GfK, which noted a marginal improvement to -40.2 for the month of December (from -41.9).
EUR/USD’s outlook should shift to positive on a sustained breakout of the 200-day SMA (1.0386) and the 9-month resistance line near 1.0440. Beyond this region, the pair could challenge the November top at 1.0481 (November 15) ahead of the round level at 1.0500 and the weekly peak at 1.0614 (June 27). Extra gains from here target the June high at 1.0773 (June 9) before the May top at 1.0786 (May 30). Just the opposite, the weekly low at 1.0222 (November 21) is expected to hold the initial test before the September peak at 1.0197 (September 12). The breach of this level could open the door to a drop to the 100- and 55-day SMAs at 1.0028 and 0.9966, respectively, ahead of the 0.9935 level (November 10) and the November low at 0.9730 (November 3). The daily RSI receded to the sub-64 region.
Resistance levels: 1.0448 1.0481 1.0614 (4H chart)
Support levels: 1.0354 1.0296 1.0222 (4H chart)
-638051534313528605.png)
USDJPY
The daily rebound in the greenback in combination with the recovery in US yields across the pond lent much needed legs to USD/JPY and briefly lifted it to new 2-day highs around 139.60, just to end the day above 139.00.
Indeed, US yields regained upside traction following the inactivity in the money market due to the Thanksgiving Day holiday, leaving behind many sessions trading in the red territory.
Same story with the dollar, where the USD Index (DXY) managed to recoup part of the ground lost earlier in the week and mainly in response to the dovish tone from the FOMC Minutes.
The Japanese docket saw Foreign Bond Investment shrank to ¥526.6B in the week to November 19.
Despite Friday’s bounce, USD/JPY remains under pressure and faces the immediate support at the November low at 137.65 (November 15) ahead of the weekly low at 135.80 (August 23). The breach of this level could lead up to a visit to the key 200-day SMA at 133.94 before the August low at 130.39 (August 2). By contrast, there is a temporary hurdle at the 100-day SMA at 141.16 ahead of the weekly high at 142.25 (November 21) and the interim 55-day SMA at 144.63. Beyond the latter comes the weekly top at 148.84 (October 31) before the 2022 high at 151.94 (October 21). The daily RSI rebounded and approached the 37 level.
Resistance levels: 139.59 141.61 142.25 (4H chart)
Support levels: 138.04 137.65 136.19 (4H chart)
-638051547385848507.png)
GBPUSD
In line with the rest of the risk complex, GBP/USD gave away part of the recent multi-session gains and returned to the negative territory at the end of the week, revisiting at the same time the sub-1.2100 zone.
Cable came under pressure on Friday in response to the renewed buying interest around the greenback, managing to set aside part of the recent pronounced sell-off, which was particularly exacerbated following the publication of the FOMC Minutes (Wednesday).
The UK calendar was empty on Friday, while the next relevant releases will come from the mortgage results due on November 29.
The upside momentum in GBP/USD now trades at shouting distance from the 200-day SMA at 1.2181. The surpass of this key region could prompt the August top at 1.2293 (August 1) to emerge on the horizon ahead of the weekly peak at 1.2405 (June 16) and the May high at 1.2666 (May 27). On the flip side, the 100- and 55-day SMAs at 1.1641 and 1.1423, respectively, are expected to offer initial support prior to the November low at 1.1142 (November 4) and the weekly low at 1.1059 (October 21). Below the latter turns up the October low at 1.0923 (October 12). The daily RSI receded a tad to the proximity of 65.
Resistance levels: 1.2153 1.2276 1.2293 (4H chart)
Support levels: 1.2058 .1778 1.1762 (4H chart)
-638051535217095296.png)
AUDUSD
AUD/USD saw its recent strong rally run out of steam around the 0.6780 region on Friday, triggering the first daily pullback after three daily gains in a row.
Despite Friday’s negative price action, the pair closed the fifth week with gains out of the last six ones and remained on its way to end the first month in the positive territory following three consecutive drops.
The moderate recovery in the dollar put the risk-linked galaxy under renewed pressure, although the broad-based upbeat tone in the commodity space limited the downside in the pair. On this, both copper prices and the iron ore clinched the third consecutive session with gains on Friday.
No data releases scheduled in Oz on Friday left the attention to the preliminary Retail Sales figures due on November 28.
Bulls in AUD/USD continue to focus on the November high at 0.6797 (November 15) ahead of the September top at 0.6916 (September 13) and seconded by the key 200-day SMA at 0.6933. North from here aligns the psychological 0.7000 mark seconded by the weekly peak at 0.7008 (August 26) and the August high at 0.7136 (August 11). On the other hand, the 100-day SMA at 0.6686 should offer interim contention followed by the weekly low at 0.6584 (November 21) and the 55-day SMA at 0.6512. South from this area, the pair could challenge the weekly low at 0.6386 (November 10) prior to the November low at 0.6272 (November 3), which precedes the 2022 low at 0.6169 (October 13) and the psychological 0.6000 mark. The daily RSI eased a tad and flirted with the 62 area.
Resistance levels: 0.6780 0.6797 0.6916 (4H chart)
Support levels: 0.6720 0.6584 0.6475 (4H chart)
-638051538588564103.png)
GOLD
Gold prices succumbed to the renewed buying interest in the dollar and posted the first daily drop since Tuesday, this time ending the day near the $1,750 per ounce troy. In the meantime, and looking at the monthly chart, bullion remains well poised to close the first month with gains since March.
Back to Friday’s price action, the greenback returned on a strong foot following the Thanksgiving Day holiday on Thursday and put the risk-associated universe and dollar-denominated assets to the test.
Also collaborating with the decline in the yellow metal appeared the rebound in US yields across the curve.
The weekly high at $1,761 now turns up as the immediate hurdle for gold bulls. Once cleared, bullion could then dispute the November top at $1,786 (November 15) prior to the critical $1,800 region, home of the key 200-day SMA and the August top at $1,807 (August 10). Beyond this zone emerges the June high at $1,879 (June 13). On the contrary, there is an initial contention at the weekly low at $1,732 (November 21) en route to the 100- and 55-day SMAs at $1,712 and $1,687, respectively. The breakdown of this region could see the 2022 low at $1,614 (September 28) revisited before the round level at $1,600.
Resistance levels: $1,761 $1,767 $1,786 (4H chart)
Support levels: $1,746 $1,727 $1,702 (4H chart)
-638051542938674394.png)
CRUDE WTI
Prices of the American benchmark for the sweet light crude oil ended the third week in a row in the negative territory and revisited the boundaries of the $76.00 mark per barrel on Friday.
Heightened demand concerns continued to weigh on traders’ sentiment at the end of the week in response to the persevering pick-up in COVID cases in China and the lockdown measures that ensued.
In addition, an agreement to cap Russian oil prices by the EU/G7 remained elusive amidst ongoing negotiations on Friday and was also another driver of increased weakness around the commodity.
Somewhat alleviating concerns emerged the tangible possibility that the OPEC+ could announce extra oil output cuts at its December meeting.
Next on the downside for the WTI appears the weekly low at $75.30 (November 21). If cleared, crude oil could then confront the 2022 low at $74.30 (January 3) ahead of the round level at $70.00. The loss of this key level exposes the weekly low at $66.15 (December 20 2021) seconded by the December 2021 low at $62.46 (December 2). Contrarily, interim hurdles come at the 55- and 100-day SMAs at $85.23 and $88.59, respectively, prior to the $90.08 level (November 11) and the November peak at $93.73. If bulls push harder, then the weekly high at $97.65 (August 30) could emerge on the horizon ahead of the key 200-day SMA at $97.88 and the psychological $100.00 mark per barrel.
Resistance levels: $79.88 $82.35 $85.75 (4H chart)
Support levels: $76.24 $75.27 $74.26 (4H chart)
-638051544094684331.png)
DOW JONES
Equities closed the week on a mixed note following the inactivity of Thanksgiving Day holiday on Thursday and the reduced session on Friday.
Indeed, investors continued to gauge the likelihood of a slower pace of future interest rate hikes by the Federal Reserve against the current backdrop of elevated inflation, recession concerns, the hawkish stance from several FOMC governors and jitters surrounding the economic outlook in China.
That said, the Dow Jones gained 0.45% to 34,347, the S&P500 eased 0.03% to 4,026 and the tech-heavy Nasdaq Composite dropped 0.52% to 11,226.
Another monthly peak in the Dow Jones at 34,386 (November 25) opens the door to a potential move to the April high at 35,492 ahead of the February top at 35,824 (February 9). Oppositely, the next contention still lies at the weekly low at 33,239 (November 17) ahead of the key 200-day SMA at 32,475 and the interim 100-day SMA at 31,819. South from here aligns the November low at 31,727 (November 3) before the temporary 55-day SMA at 31,411, which is followed by the 30,206 level (October 21) and the 2022 low at 28,660 (October 13). The daily RSI remained in the overbought territory past 71.
Top Performers: Boeing, Home Depot, UnitedHealth
Worst Performers: Amgen, J&J, American Express
Resistance levels: 34,386 35,492 35,824 (4H chart)
Support levels: 33,239 32,478 31,807 (4H chart)
-638051544784985554.png)
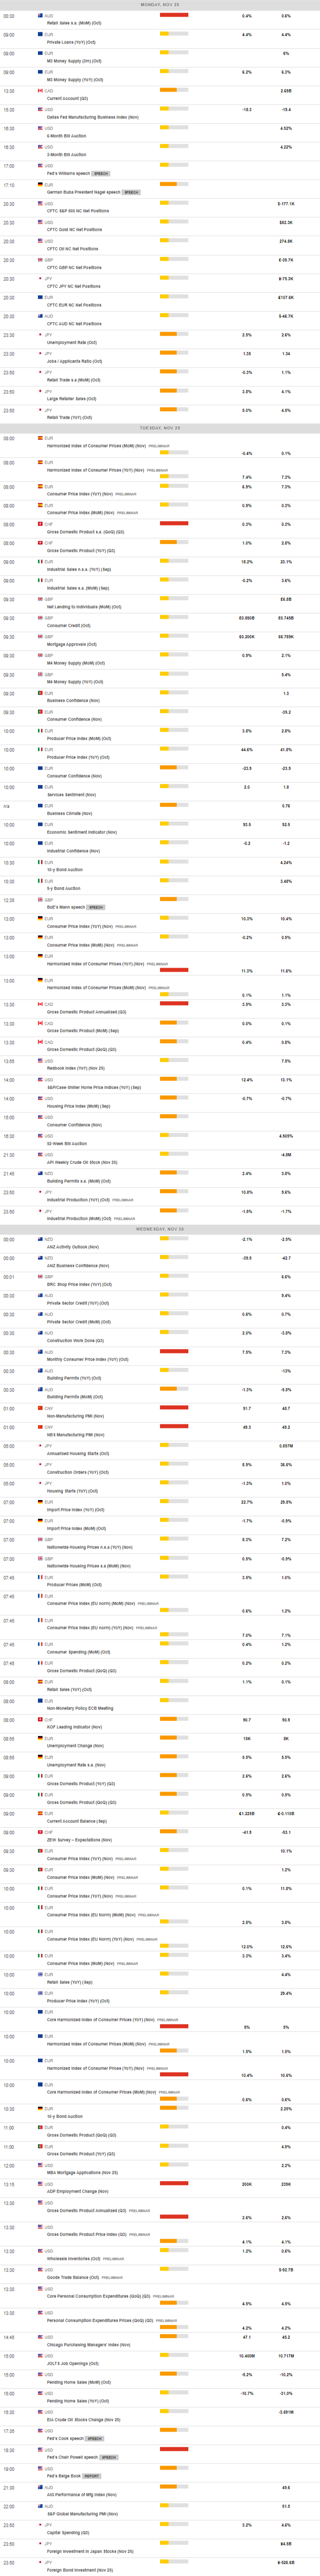
MACROECONOMIC EVENTS
All Information & Updates provided by:

All information relating to the financial markets available on this page has been prepared and issued by FXStreet (Forexstreet SL, Spain, Reg: B62498233) on the basis of publicly available information and all information believed to be reliable and does not conflict with Kuwaiti local laws, and all necessary care has been taken to before the company to ensure that the facts mentioned are correct from the source.
NCM Investment nor any of its directors or employees shall in any way be held responsible for the contents of this news, and the information contained on this page is intended only to provide clients with publicly available information and should not be construed as investment advice, report or analysis and/or constitute an offer or invitation to buy or sell financial instruments of any kind.
RISK WARNING: Forex and CFDs are highly risky leveraged products, as losses can exceed deposits. Please ensure you understand all the risks and take independent advice if necessary. NCM will segregate the clients based on the criteria of the regulator and its bylaws. NCM does not provide any advisory service; the material published does not constitute advice or a recommendation for a transaction in any financial instrument. NCM accepts no responsibility for any use of the content presented and any consequences of that use. Anyone acting on the information provided does so at their own risk.