
- Contact Us:
-

-

-

-


Daily Market Updates
29 Nov 2022
EURUSD
Another sharp U-turn in the dollar sponsored an equally strong reversal in EUR/USD, forcing it to come all the way down to the 1.0340 region after coming just pips away from the 1.0500 barrier during the European morning on Monday, an area last traded back in late June.
Back to the greenback, the USD Index (DXY) briefly poked with the key 200-day SMA near 105.30 before staging a pronounced rebound to the 106.50 region on the back of increasing risk aversion and hawkish Fedspeak.
The sharp bounce in the buck was also accompanied by a small uptick in US yields across the curve, which added to Friday’s advance.
From the ECB, Board member Knot did not rule out a probable drop in the economic activity in the October-December period and stressed that underlying inflation trends are worrying. Still around the ECB and at her speech before the European Parliament, Chairwoman C.Lagarde said inflation risks remain tilted to the upside, while she declined to comment on whether inflation might have peaked. Lagarde added that fiscal policy must be targeted and tailored, while she suggested that rates could go further up to a more restrictive level. She added that the elevated inflation is hurting spending and production, while rate changes are expected to take time to impact on the economy.
On the opposite side of the road and supporting the rebound in the dollar, Cleveland Fed L.Mester said she does not see the Fed pausing its hiking cycle for the time being, while her colleague J.Bullard suggested that markets are underpricing the risk that the Fed could be more aggressive. Somewhat tempering the mood, NY Fed J.Williams hinted at the possibility that the Fed could cut rates at some point in 2024.
There were no data releases in the domestic docket on Monday, whereas the Dallas Fed Manufacturing Index improved to -14.4 in November (from -19.4) in what was the sole release in the US calendar.
In light of the recent price action, EUR/USD now faces the next up barrier at the round level at 1.0500. If the pair clears this level, it should not meet any hurdle of note until the weekly high at 1.0614 (June 27) prior to the June top at 1.0773 (June 9) and the May peak at 1.0786 (May 30). By contrast, the next support still emerges at the weekly low at 1.0222 (November 21) ahead of the 100- and 55-day SMAs at 1.0032 and 0.9970, respectively. South from here comes the 0.9935 level (November 10) followed by the November low at 0.9730 (November 3). The daily RSI retreated to the 62 zone.
Resistance levels: 1.0496 1.0614 1.0642 (4H chart)
Support levels: 1.0341 1.0296 1.0226 (4H chart)
-638052622589963872.png)
USDJPY
After bottoming out in the 137.50 region earlier on Monday’s session, USD/JPY managed to regain composure helped by the rebound in the dollar, which was in turn underpinned by incipient risk aversion fuelled by Chinese concerns.
In addition, another positive session in US yields bolstered the bounce in spot, leaving recent peaks around 142.50 as the next magnet for bulls for the time being.
The Japanese calendar was empty on Monday, leaving all the attention to Retail Sales and the Unemployment Rate, both due on Tuesday.
USD/JPY printed a new November low at 137.49 (November 28). The loss of this level could prompt the weekly low at 135.80 (August 23) to re-emerge on the horizon prior to the key 200-day SMA at 134.06 and the August low at 130.39 (August 2). On the flip side, the 100-day SMA at 141.17 offers initial hurdle before the weekly top at 142.25 (November 21) and the temporary 55-day SMA at 144.56. North from here comes the weekly peak at 148.84 (October 31) ahead of the 2022 top at 151.94 (October 21). The daily RSI deflated a tad to the 36 area.
Resistance levels: 139.59 141.61 142.25 (4H chart)
Support levels: 137.49 136.19 135.80 (4H chart)
-638052623741654495.png)
GBPUSD
GBP/USD retreated to 3-day lows and broke below the 1.2000 yardstick in response to the buying bias in the dollar at the beginning of the week.
Indeed, the greenback started the week on the defensive just to reverse that pessimism in the European midday, always on the back of the continuation of the upside momentum in US yields, Chinese concerns and once again hawkish rhetoric from Fed speakers.
In the UK debt market, the 10-year gilt yields alternated gains with losses around the 3.10% area following two daily advances in a row.
There were no data releases in the UK calendar on Monday.
GBP/USD faces the next up barrier at the 200-day SMA at 1.2173 ahead of the August peak at 1.2293 (August 1). Further north appears the weekly high at 1.2405 (June 16) followed by the May top at 1.2666 (May 27). Just the opposite, there is temporary contention at the 100- and 55-day SMAs at 1.1643 and 1.1430, respectively, before the November low at 1.1142 (November 4) and the weekly low at 1.1059 (October 21). The daily RSI came under pressure and flirted with the 60 region.
Resistance levels: 1.2153 1.2276 1.2293 (4H chart)
Support levels: 1.1980 1.1778 1.1762 (4H chart)
-638052623353162585.png)
AUDUSD
The U-turn in the greenback motivated AUD/USD to add to Friday’s retracement and drop to new 3-day lows well below the 0.6700 mark at the beginning of the week.
In the meantime, the Aussie dollar succumbed to the mixed performance in the commodity universe as well as Chinese jitters regarding the recent social unrest in combination with lockdown measures in response to the surge in COVID cases.
Collaborating with the downbeat mood around AUD, RBA Governor P.Lowe warned against wage-spiral risks at the time when he stressed fears hovering around the housing market.
Data wise Down Under, preliminary figures showed Retail Sales are expected to contract 0.2% MoM in October.
The weekly low at 0.6584 (November 21) emerges as the next support of note in case sellers push harder in the near term. Down from here, AUD/USD should confront the 55-day SMA at 0.6508 ahead of the weekly low at 0.6386 (November 10). Extra losses could then revisit the November low at 0.6272 (November 3) seconded by the 2022 low at 0.6169 (October 13) and the psychological 0.6000 mark. On the contrary, the pair should meet the next up barrier at the November top at 0.6797 (November 15) prior to the September peak at 0.6916 (September 13) and the key 200-day SMA at 0.6930. The continuation of the uptrend is predicted to challenge the psychological 0.7000 mark followed by the weekly high at 0.7008 (August 26) and the August top at 0.7136 (August 11). The daily RSI shed further ground and breached the 57 yardstick.
Resistance levels: 0.6780 0.6797 0.6916 (4H chart)
Support levels: 0.6663 0.6584 0.6475 (4H chart)
-638052624170668763.png)
GOLD
Prices of the ounce troy of the precious metal came under extra pressure and deflated to 3-day lows in the $1,740 zone at the beginning of the week.
Indeed, bullion added to Friday’s pullback in response to the change of heart in the greenback, which was in turn supported by developments in China, while the uptick in the belly of the US yield curve also weighed on the yellow metal.
Adding to the selling bias in the metal, Cleveland Fed’s L.Mester said she does not see any impasse in the Fed’s tightening plans in the near future.
Extra weakness in gold now targets the weekly low at $1,732 (November 21) ahead of the 100- and 55-day SMAs at $1,712 and $1,687, respectively. A deeper drop could then retest the 2022 low at $1,614 (September 28) ahead of the round level at $1,600. On the other hand, initial resistance appears at the weekly top at $1,761 prior to the November peak at $1,786 (November 15) and the critical $1,800 region, where the key 200-day SMA and the August top at $1,807 (August 10) coincide. Further up comes the June top at $1,879 (June 13).
Resistance levels: $1,763 $1,767 $1,786 (4H chart)
Support levels: $1,741 $1,727 $1,702 (4H chart)
-638052624662993700.png)
CRUDE WTI
WTI prices dropped to a new 2022 low near $73.60 on Monday.
However, the commodity managed to reverse the initial weakness and return to the area above the $77.00 mark per barrel exclusively on rumours that the OPEC+ could be seriously planning to announce another oil output cut at its December 4 gathering.
Those rumours, however, seem to have been enough to offset earlier heightened demand concerns following recent protests in China amidst the prevailing COVID-zero policy.
As usual, the API and the EIA will report on US crude oil supplies in the week to November 25 on Tuesday and Wednesday, respectively.
In light of the new YTD low at $73.62 (November 28), the WTI could now challenge the round level at $70.00 ahead of the weekly low at $66.15 (December 20 2021) and the December 2021 low at $62.46 (December 2). On the other hand, there are temporary resistance levels at the 55- and 100-day SMAs at $85.03 and $88.33, respectively, before the $90.08 level (November 11) and the November high at $93.73. The surpass of this region could put a test of the weekly top at $97.65 (August 30) back on the traders’ radar prior to the key 200-day SMA at $97.80 and the psychological $100.00 mark per barrel.
Resistance levels: $77.82 $79.88 $82.35 (4H chart)
Support levels: $73.59 $70.79 $68.55 (4H chart)
-638052625555531306.png)
DOW JONES
US stock markets started the week in a negative mood following increasing concerns in response to the recent social unrest in China, along with jitters surrounding the economic outlook in light of the persevering COVID-zero stance from the country.
In addition, the stronger dollar, higher yields and hawkish messages from Fed speakers also deteriorated the sentiment around the risk complex on Monday.
Against that, the Dow Jones dropped 1.32% to 33,891, the S&P500 retreated 1.50% to 3,965 and the tech-benchmark Nasdaq Composite deflated 1.40% to 11,069.
Further correction in the Dow Jones is now expected to confront the weekly low at 33,239 (November 17) prior to the key 200-day SMA at 32,468 and the interim 100-day SMA at 31,844. Once cleared, the index could then revisit the November low at 31,727 (November 3) ahead of the temporary 55-day SMA at 31,443 before the 30,206 level (October 21) and the 2022 low at 28,660 (October 13). Inversely, the November high at 34,386 (November 25) comes first followed by the April top at 35,492 and prior to the February peak at 35,824 (February 9). The daily RSI abandoned the overbought territory and dropped below 63.
Top Performers: Merck&Co, Walmart, Salesforce Inc
Worst Performers: Boeing, Walt Disney, Apple
Resistance levels: 34,386 35,492 35,824 (4H chart)
Support levels: 33,239 32,478 31,835 (4H chart)
-638052626045732112.png)
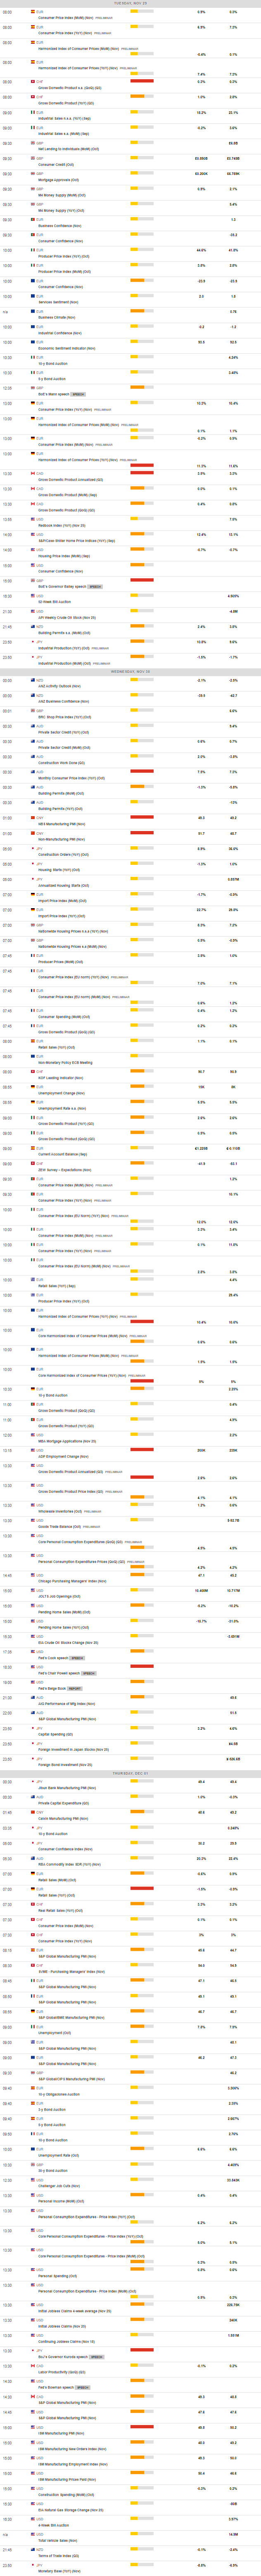
MACROECONOMIC EVENTS
All Information & Updates provided by:

All information relating to the financial markets available on this page has been prepared and issued by FXStreet (Forexstreet SL, Spain, Reg: B62498233) on the basis of publicly available information and all information believed to be reliable and does not conflict with Kuwaiti local laws, and all necessary care has been taken to before the company to ensure that the facts mentioned are correct from the source.
NCM Investment nor any of its directors or employees shall in any way be held responsible for the contents of this news, and the information contained on this page is intended only to provide clients with publicly available information and should not be construed as investment advice, report or analysis and/or constitute an offer or invitation to buy or sell financial instruments of any kind.
RISK WARNING: Forex and CFDs are highly risky leveraged products, as losses can exceed deposits. Please ensure you understand all the risks and take independent advice if necessary. NCM will segregate the clients based on the criteria of the regulator and its bylaws. NCM does not provide any advisory service; the material published does not constitute advice or a recommendation for a transaction in any financial instrument. NCM accepts no responsibility for any use of the content presented and any consequences of that use. Anyone acting on the information provided does so at their own risk.