
- Contact Us:
-

-

-

-


Daily Market Updates
30 Nov 2022
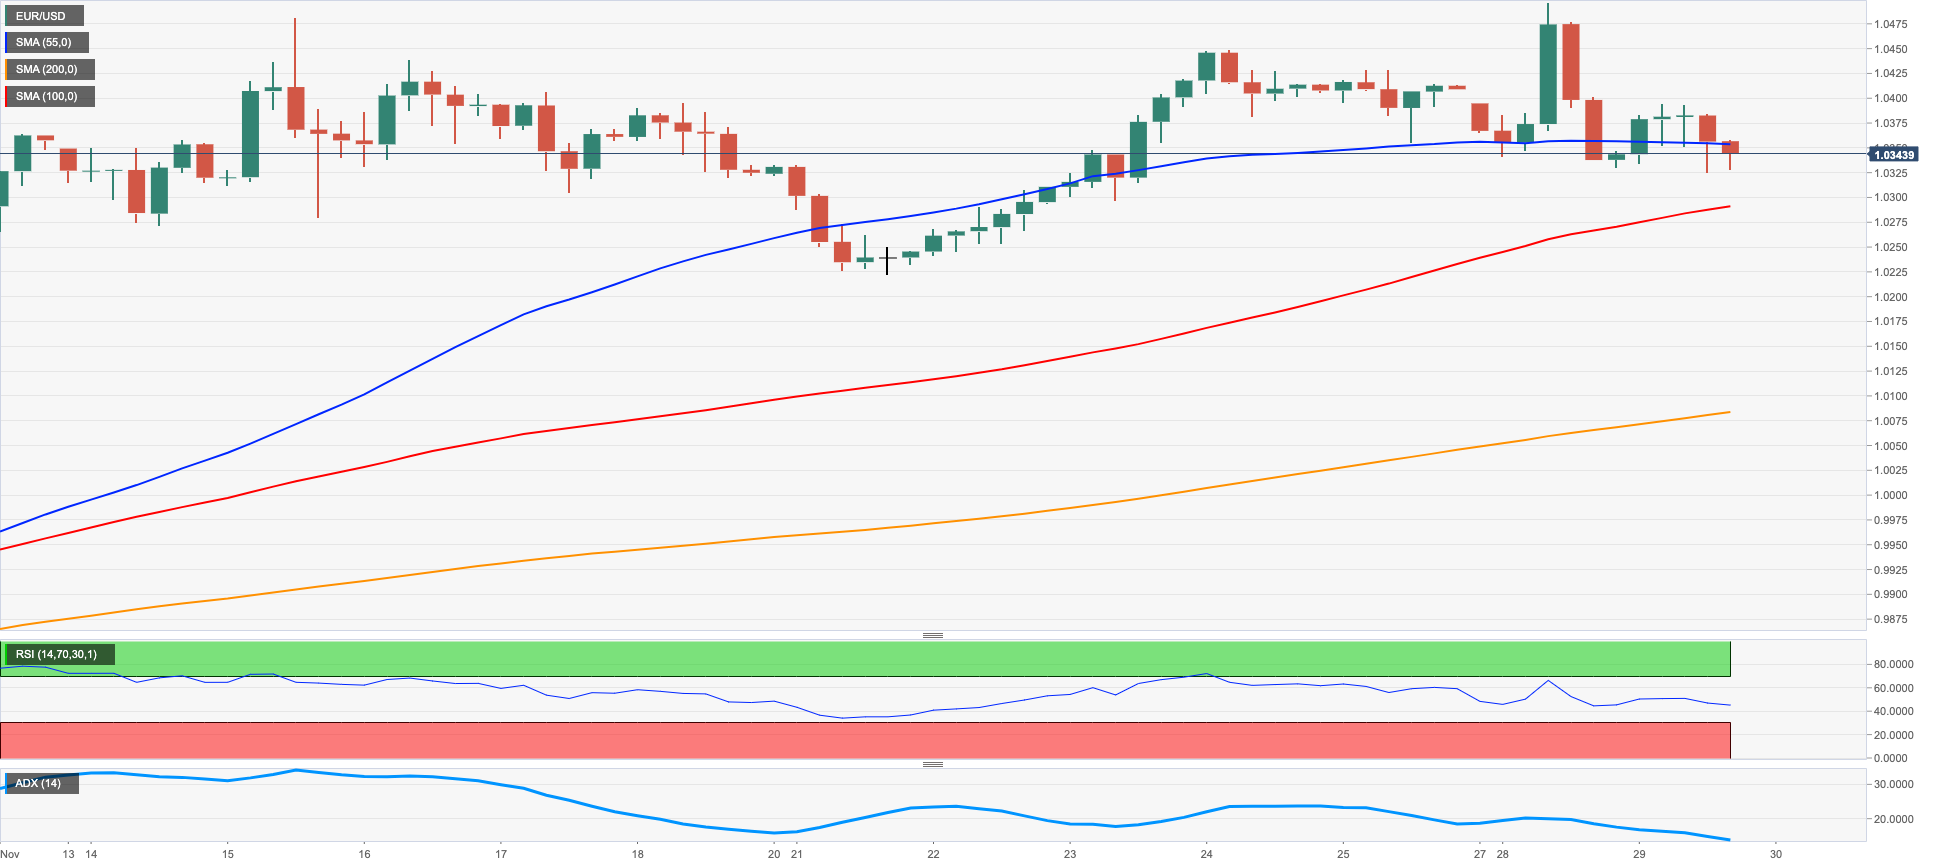
EURUSD
Following a volatile start of the trading week, EUR/USD failed to retest/surpass the key 1.0400 region on Tuesday on the back of alternating price action around the greenback.
On the latter, the USD Index (DXY) initially retreated to the 106.00 neighbourhood, where dip-buyers appear to be clustered, sparking a subsequent rebound to the upper-106.00s helped at the same time by the rebound in US yields across the curve.
In the German money market, the 10-year bund yields dropped below the 1.90% yardstick and eroded a 2-session advance.
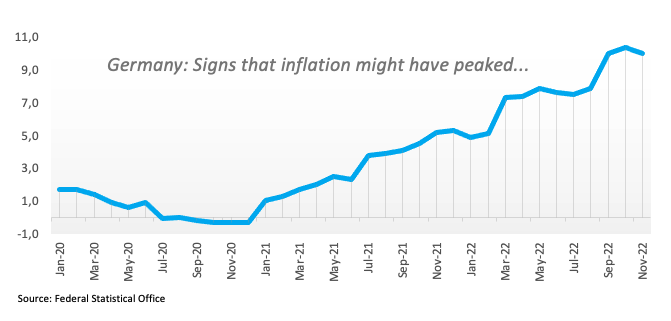
Data wise in the euro area, final readings saw the Consumer Confidence tracked by the European Commission at -23.9 and the Economic Sentiment at 93.7, both for the month of November. In Germany, the Advanced Inflation Rate is expected to have risen 10% in the year to November and contracted 0.5% from a month earlier.
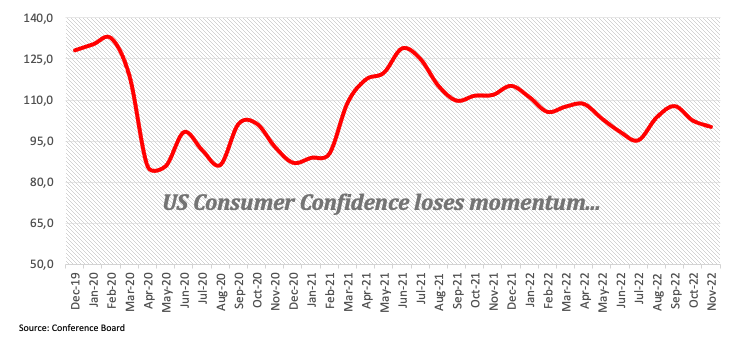
In the US, the FHFA’s House Price Index rose 0.1% MoM in September and the key Consumer Confidence measured by the Conference Board eased to 100.2 in November (from 102.5).
The resumption of the upside bias should prompt EUR/USD to confront the November high at 1.0496 (November 28) closely followed by the round level at 1.0500. North from here emerges the weekly top at 1.0614 (June 27) ahead of the June peak at 1.0773 (June 9) and the May high at 1.0786 (May 30). In the opposite direction, the so far weekly low at 1.0330 (November 28) should offer initial support followed by the weekly low at 1.0222 (November 21) and the 100- and 55-day SMAs at 1.0035 and 0.9977, respectively. A deeper drop could revisit the 0.9935 level (November 10) before the November low at 0.9730 (November 3). The daily RSI deteriorated a tad and broke below the 60 mark.
Resistance levels: 1.0496 1.0614 1.0642 (4H chart)
Support levels: 1.0324 1.0296 1.0226 (4H chart)
USDJPY
USD/JPY added to the pessimism seen at the beginning of the week and briefly dropped to the sub-138.00 region on Tuesday, managing to stage a decent comeback afterwards.
Another upbeat session in the greenback and the decent bounce in US yields across the curve appear to have been insufficient to lift the spot back to the positive territory.
An interesting day in the Japanese calendar saw the Unemployment Rate held steady at 2.6% in October and Retail Sales expanded 4.3% YoY in the same month.
A deeper drop from the November low at 137.49 (November 28) could motivate USD/JPY to challenge the weekly low at 135.80 (August 23) ahead of the key 200-day SMA at 134.18. South from here comes the August low at 130.39 (August 2), which precedes the round level at 130.00. Just the opposite, the surpass of the 100-day SMA at 141.19 should put the weekly peak at 142.25 (November 21) back on the investors’ radar ahead of the temporary 55-day SMA at 144.45. The continuation of the recovery could then challenge the weekly high at 148.84 (October 31) before the 2022 top at 151.94 (October 21). The daily RSI retreated to the 35 area.
Resistance levels: 139.59 141.61 142.25 (4H chart)
Support levels: 137.49 136.19 135.80 (4H chart)
-638053481824843666.png)
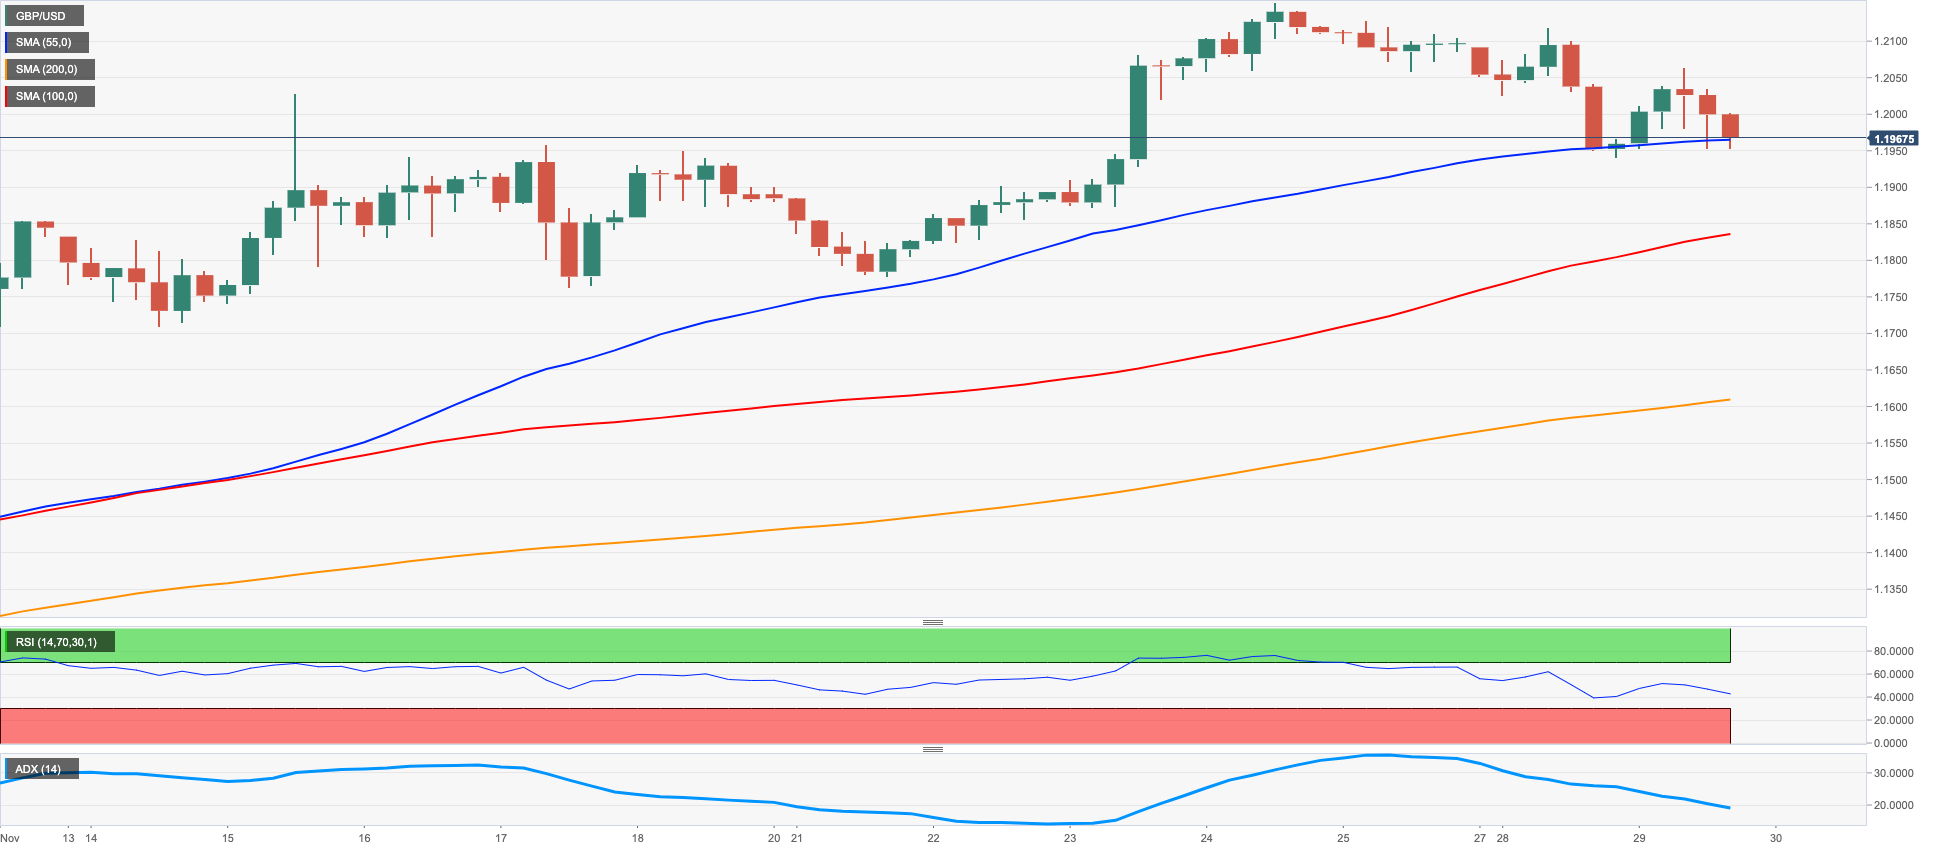
GBPUSD
After two daily retracements in a row, GBP/USD treaded water around Monday’s closing levels around 1.1960 following an earlier climb to the area past the key 1.2000 hurdle on Tuesday.
Indeed, the dollar regained traction and added to Monday’s advance in tandem with the resumption of the buying interest in US yields and the lacklustre loss of momentum in the risk complex.
From the BoE, MPC member C.Mann noted that inflation is increasingly embedded in UK firms, adding that inflation expectations are leaning towards 4% in firms.
In the UK docket, Mortgage Approvals shrank to 58.977K in October and Mortgage Lending dropped to £3.966B in the same month.
No changes to the topside in GBP/USD. The immediate hurdle aligns at the November peak at 1.2153 (November 24) closely followed by the key 200-day SMA at 1.2165. The breakout of this region could open the door to the August high at 1.2293 (August 1) ahead of the weekly top at 1.2405 (June 16) and the May peak at 1.2666 (May 27). By contrast, the 100- and 55-day SMAs at 1.1643 and 1.1437 are expected to offer interim contention, respectively, prior to the November low at 1.1142 (November 4) and the weekly low at 1.1059 (October 21). The daily RSI looked stable near the 59 region.
Resistance levels: 1.2117 1.2153 1.2276 (4H chart)
Support levels: 1.1940 1.1778 1.1762 (4H chart)
AUDUSD
AUD/USD rose to 2-day highs and set aside two daily declines in a row on Tuesday in spite of the continuation of the bid stance in the dollar.
Indeed, the firmer greenback depressed the risk-linked galaxy although it failed to put the commodity space under pressure, where both coper prices and the iron ore left behind part of the recent losses.
The Australian docket was empty on Tuesday, leaving all the attention to the release of preliminary Building Permits and the Monthly CPI Indicator, all due on Wednesday.
Further gains in AUD/USD are expected to meet the next hurdle at the weekly top at 0.6780 (November 25) just before the November peak at 0.6797 (November 15). Further north emerges the September high at 0.6916 (September 13) seconded by the key 200-day SMA at 0.6928, all preceding the psychological 0.7000 mark. Once cleared, the pair could then dispute the weekly top at 0.7008 (August 26) prior to the August peak at 0.7136 (August 11). On the flip side, initial contention appears at the weekly low at 0.6584 (November 21) followed by the 55-day SMA at 0.6508 and the weekly low at 0.6386 (November 10). The daily RSI leapt north of the 56 yardstick.
Resistance levels: 0.6748 0.6780 0.6797 (4H chart)
Support levels: 0.6640 0.6584 0.6475 (4H chart)
-638053482206396579.png)
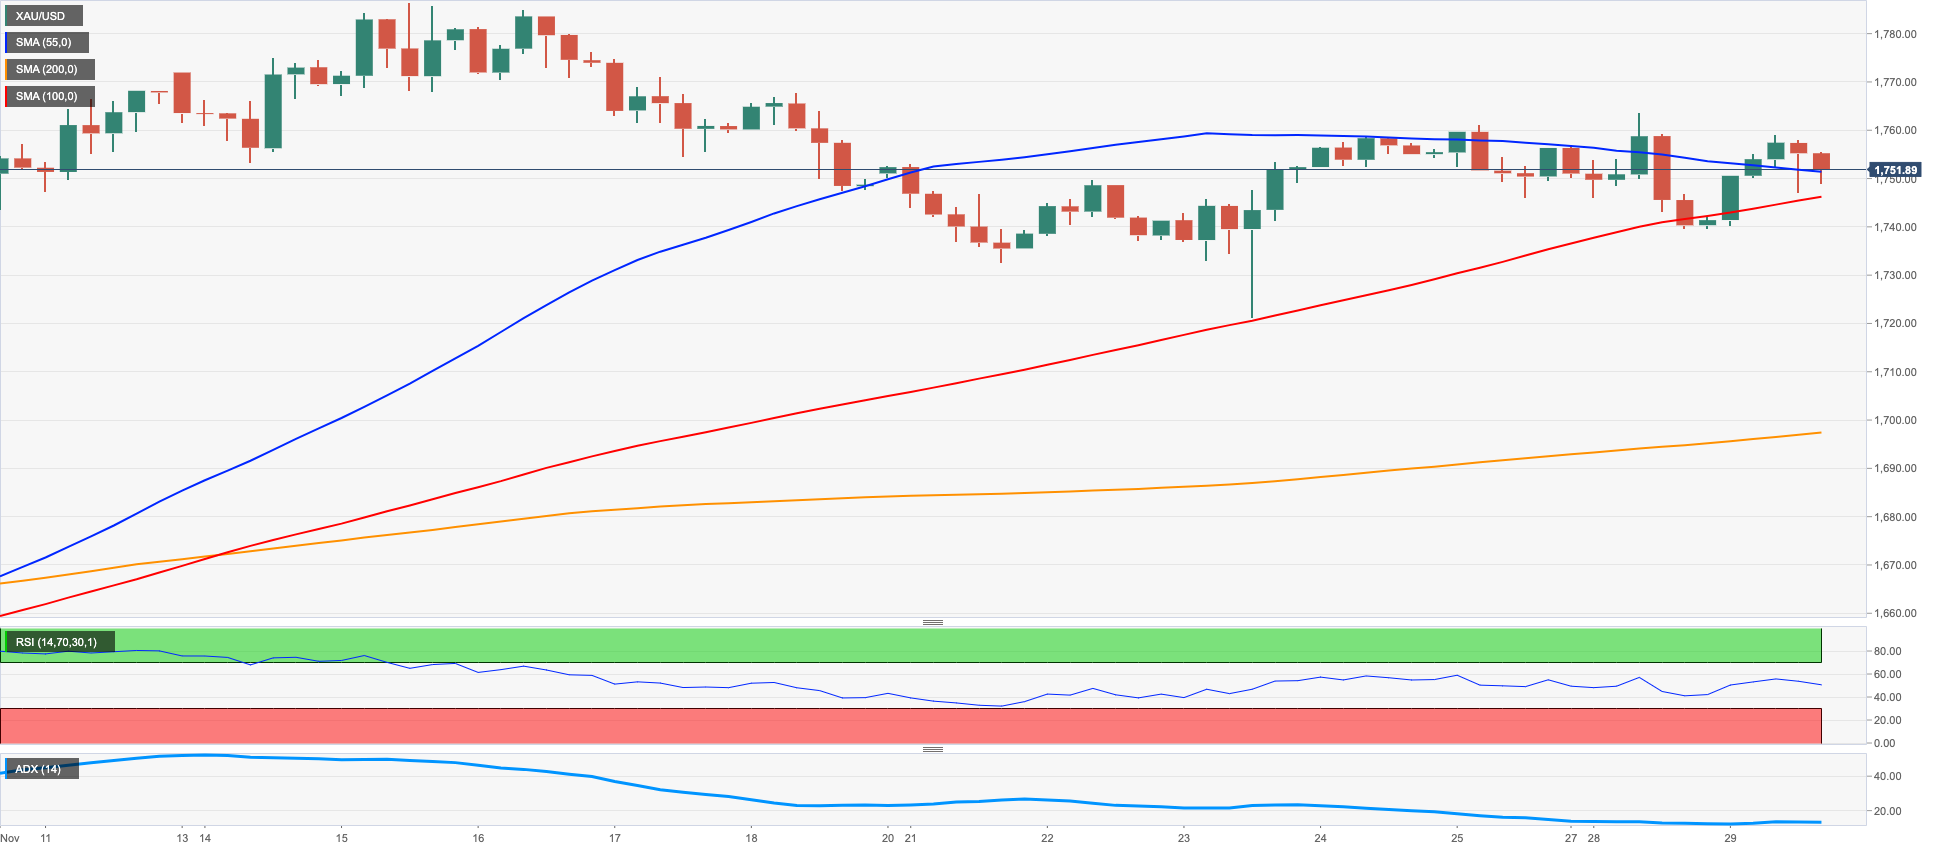
GOLD
Gold prices kept the side-lined theme well in place on Tuesday and managed to reverse two sessions in a row with red figures, revisiting at the same time the $1,760 zone per ounce troy.
Another solid performance of the greenback did not prevent the bounce in the precious metal, although the move higher in US yields across the curve somewhat limited its bullish attempt.
In the meantime, price action around the yellow metal looks contained, as markets get closer to the next FOMC event, where a half-point interest rate hike remains the preferred option among market participants for the time being and despite the recent hawkish messages from Fed’s rate setters (Mester, Bullard).
Gold faces a minor up-barrier at the weekly peak at $1,763 (November 28) ahead of the November high at $1,786 (November 15). If bullion surpasses this area, it could prompt the critical $1,800 region to emerge on the horizon. This resistance zone remains reinforced by the key 200-day SMA ($1,797) and the August top at $1,807 (August 10) and emerges ahead of the June peak at $1,879 (June 13). On the contrary, sellers should target the weekly low at $1,732 (November 21) followed by the temporary 100- and 55-day SMAs at $1,712 and $1,688, respectively. Below this area comes the 2022 low at $1,614 (September 28) closely followed by the round level at $1,600.
Resistance levels: $1,763 $1,767 $1,786 (4H chart)
Support levels: $1,739 $1,727 $1,702 (4H chart)
CRUDE WTI
Prices of the American benchmark for the sweet light crude oil approached the key $80.00 mark per barrel on Tuesday, partially leaving behind the intense weakness seen in past days.
In fact, crude oil prices welcomed news that China might ease its current COVID-zero policy in the wake of protests over the weekend, while further improvement in the traders’ sentiment followed speculation that the OPEC+ could trim its oil output further at its December 4 meeting.
Additionally, the upcoming EU/G7 cap on Russian oil prices also added to the upside bias in prices on Tuesday.
Later in the NA session, the American Petroleum Institute (API) will report on US crude oil stockpiles in the week to November 25.
Prices of the WTI face interim barriers at the 55- and 100-day SMAs at $84.86 and $88.15, respectively, ahead of the $90.08 level (November 11) and the November top at $93.73. Once cleared, the weekly peak at $97.65 (August 30) could resurface on the horizon before the key 200-day SMA at $97.73 and the psychological $100.00 mark per barrel. Contrarily, the 2022 low at $73.62 (November 28) emerges as the initial magnet for bears prior to the round level at $70.00. A deeper pullback exposes the weekly low at $66.15 (December 20 2021) before the December 2021 low at $62.46 (December 2).
Resistance levels: $79.88 $82.35 $85.11 (4H chart)
Support levels: $73.59 $70.79 $68.55 (4H chart)
-638053483101282496.png)
DOW JONES
Equities traded in a mixed fashion on turnaround Tuesday amidst rising prudence among market participants in light of the upcoming US Nonfarm Payrolls (Friday), which is deemed as crucial when it comes to the Fed’s assessment of its future interest rate hikes.
In addition, concerns stemming from China and the impact on the economic outlook from the country’s COVID-zero policy also undermined the sentiment on Tuesday.
That said, the Dow Jones rose 0.15% to 33,900, the S&P500 dropped 0.04% to 3,962 and the tech-heavy Nasdaq Composite retreated 0.72% to 10,970.
Extra decline in the Dow Jones could see the weekly low at 33,239 (November 17) revisited ahead of the key 200-day SMA at 32,463 seconded by the temporary 100-day SMA at 31,868. The breach of the latter could motivate losses to accelerate and challenge the November low at 31,727 (November 3) prior to the interim 55-day SMA at 31,466. Further down emerges the 30,206 level (October 21) ahead of the 2022 low at 28,660 (October 13). Alternatively, if bulls regain the upper hand, the November top at 34,386 (November 25) should return to the radar before the April peak at 35,492 and the February high at 35,824 (February 9). The daily RSI dropped further and flirted with the 60 level.
Top Performers: Dow, American Express, Boeing
Worst Performers: Apple, Walt Disney, Visa A
Resistance levels: 34,386 35,492 35,824 (4H chart)
Support levels: 33,715 33,239 32,478 (4H chart)
-638053483427041275.png)
MACROECONOMIC EVENTS

All Information & Updates provided by:

All information relating to the financial markets available on this page has been prepared and issued by FXStreet (Forexstreet SL, Spain, Reg: B62498233) on the basis of publicly available information and all information believed to be reliable and does not conflict with Kuwaiti local laws, and all necessary care has been taken to before the company to ensure that the facts mentioned are correct from the source.
NCM Investment nor any of its directors or employees shall in any way be held responsible for the contents of this news, and the information contained on this page is intended only to provide clients with publicly available information and should not be construed as investment advice, report or analysis and/or constitute an offer or invitation to buy or sell financial instruments of any kind.
RISK WARNING: Forex and CFDs are highly risky leveraged products, as losses can exceed deposits. Please ensure you understand all the risks and take independent advice if necessary. NCM will segregate the clients based on the criteria of the regulator and its bylaws. NCM does not provide any advisory service; the material published does not constitute advice or a recommendation for a transaction in any financial instrument. NCM accepts no responsibility for any use of the content presented and any consequences of that use. Anyone acting on the information provided does so at their own risk.