
- Contact Us:
-

-

-

-


Daily Market Updates
01 Dec 2022
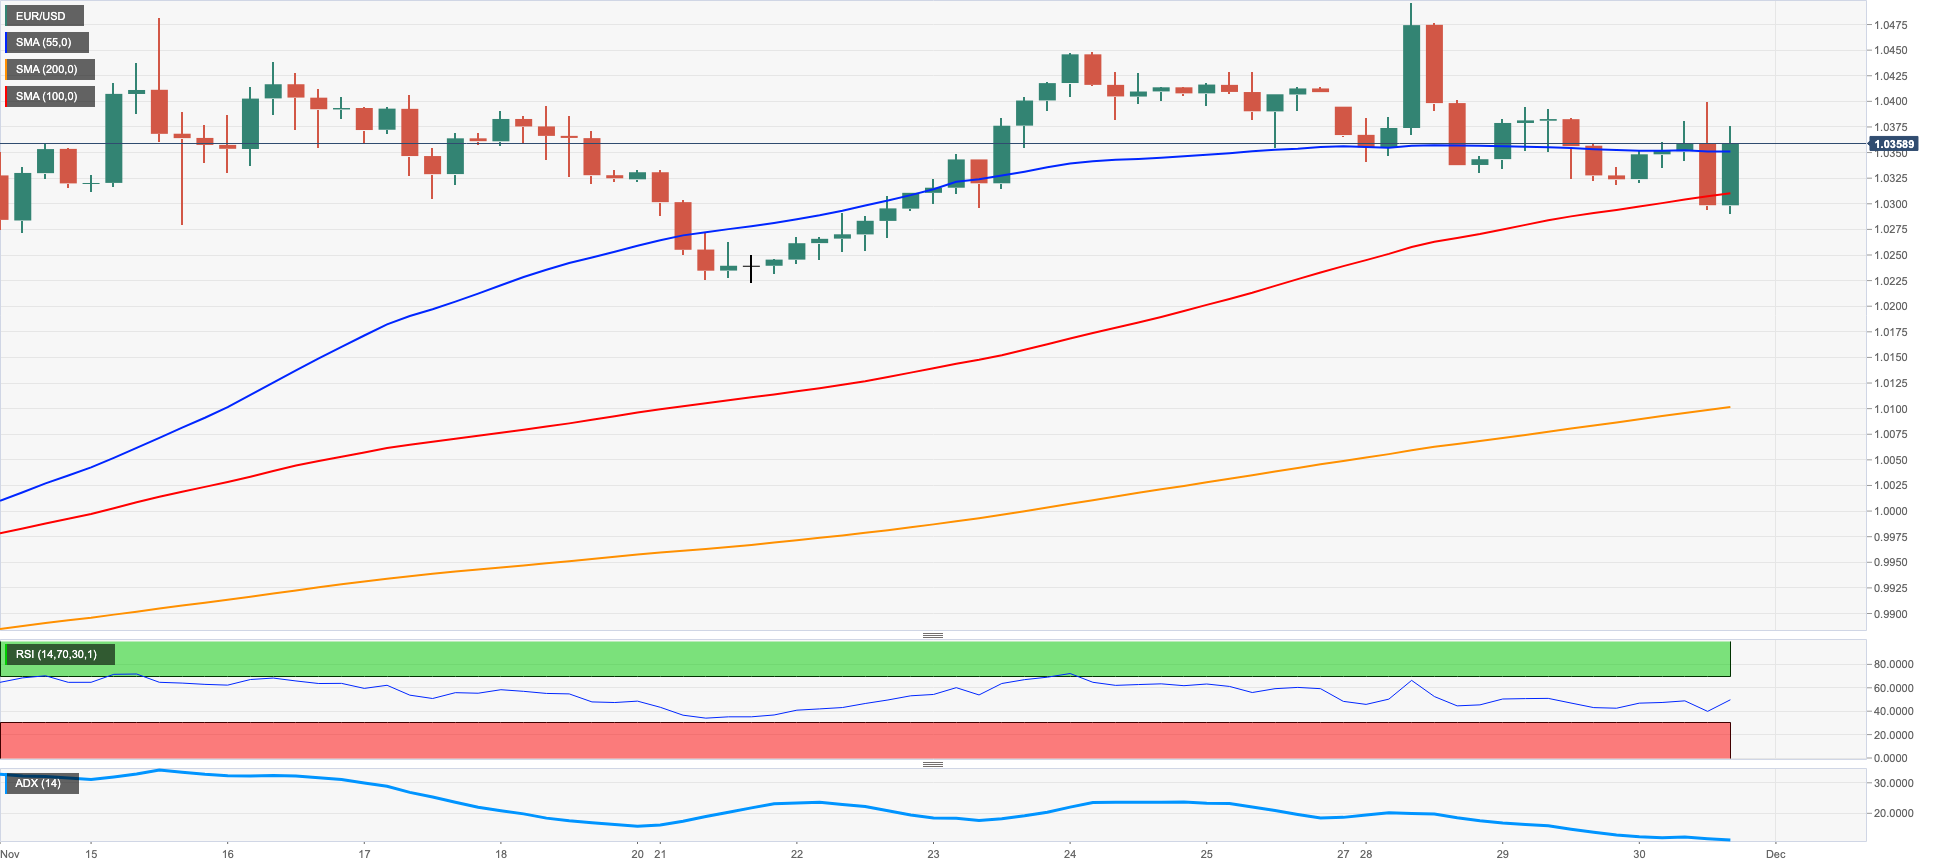
EURUSD
The resumption of the offered stance in the greenback allowed EUR/USD to set aside three consecutive sessions with losses and revisit the boundaries of 1.0400 amidst decent gains on Wednesday.
Back to the greenback, the USD Index (DXY) gave away part of the recent 3-day advance against the backdrop of rising cautiousness ahead of the key Nonfarm Payrolls due on Friday and the lack of any real news from Powell’s speech.
On the latter, at his speech on “Economic Outlook, Inflation and the Labor Market”, Chair Powell suggested that it makes sense to moderate the pace of rate raises and added that policy is expected to remain restrictive for some time. In line with his post-FOMC presser at the November gathering, he reiterated that rates will be higher than initially estimated. He highlighted the slowdown in economic activity and vowed for it to be maintained. On inflation, Powell noted that the October’s prints were a positive surprise, although further evidence is needed to give reassurance that inflation is actually losing traction.
Following Powell’s remarks, and according to CME Group’s FedWatch Tool, the probability of a 50 bps rate raise at the December 14 event is now at around 68%.
In the domestic calendar, France’s preliminary Inflation Rate is expected to have risen 6.2% YoY in November and 0.4% MoM. In addition, Germany’s Unemployment Change rose by 17K persons in November and the Unemployment Rate ticked higher to 5.6%. In the broader Euroland, the advanced Inflation Rate is seen rising 10.0% YoY in November and 5.0% YoY when it comes to the Core Inflation Rate.
Across the Atlantic, MBA Mortgage Applications contracted 0.8% in the week to November 25, while the ADP Employment Change increased by 127K jobs during last month (vs. 200K expected).
In addition, another revision of the GDP Growth Rate now sees the economy expanding 2.9% YoY in Q3, while the Goods Trade deficit is expected at $99.0B in October, Pending Home Sales contracted 4.6% MoM in October and JOLTs Job Openings increased to 10.334M also in October.
EUR/USD’s downside is seen facing initial support at the weekly low at 1.0290 (November 30). The loss of this level exposes another weekly low at 1.0222 (November 21) ahead of the temporary 100- and 55-day SMAs at 1.0037 and 0.9983, respectively. South from here emerges the 0.9935 level (November 10) prior to the November low at 0.9730 (November 3). Alternatively, the immediate up barrier is seen at the November top at 1.0496 (November 28) just ahead of the round level at 1.0500. The breakout of the latter should put a probable test of the weekly peak at 1.0614 (June 27) back on the investors’ radar before the June high at 1.0773 (June 9) and the May top at 1.0786 (May 30). The daily RSI improved beyond the 61 level.
Resistance levels: 1.0399 1.0496 1.0614 (4H chart)
Support levels: 1.0290 1.0226 1.0088 (4H chart)
USDJPY
The U-turn in US yields following Chief Powell’s lack of spark at his speech on Wednesday encouraged USD/JPY to add to recent losses, this time against the backdrop of a soft note surrounding the greenback.
In fact, the dollar eroded part of the recent advance and kept the USD Index (DXY) somewhat depressed in the mid-106.00s, while US yields shed some ground following Tuesday’s rebound.
Data wise in Japan, flash results now expect the Industrial Production to expand 3.7% in the year to October, while Housing Starts contracted 1.8% in the year to October.
Immediately to the downside in USD/JPY still aligns the November low at 137.49 (November 28) ahead of the weekly low at 135.80 (August 23) and prior to the key 200-day SMA at 134.30. Down from this region emerges the August low at 130.39 (August 2), closely followed by the round level at 130.00. By contrast, the 100-day SMA at 141.21 offers a temporary hurdle before the weekly high at 142.25 (November 21) and the interim 55-day SMA at 144.37. If the pair breaks above this level, it could prompt the weekly top at 148.84 (October 31) to emerge on the horizon ahead of the 2022 peak at 151.94 (October 21). The daily RSI looked flat near 36.
Resistance levels: 139.45 139.59 141.61 (4H chart)
Support levels: 137.49 136.19 135.80 (4H chart)
-638054318644238267.png)
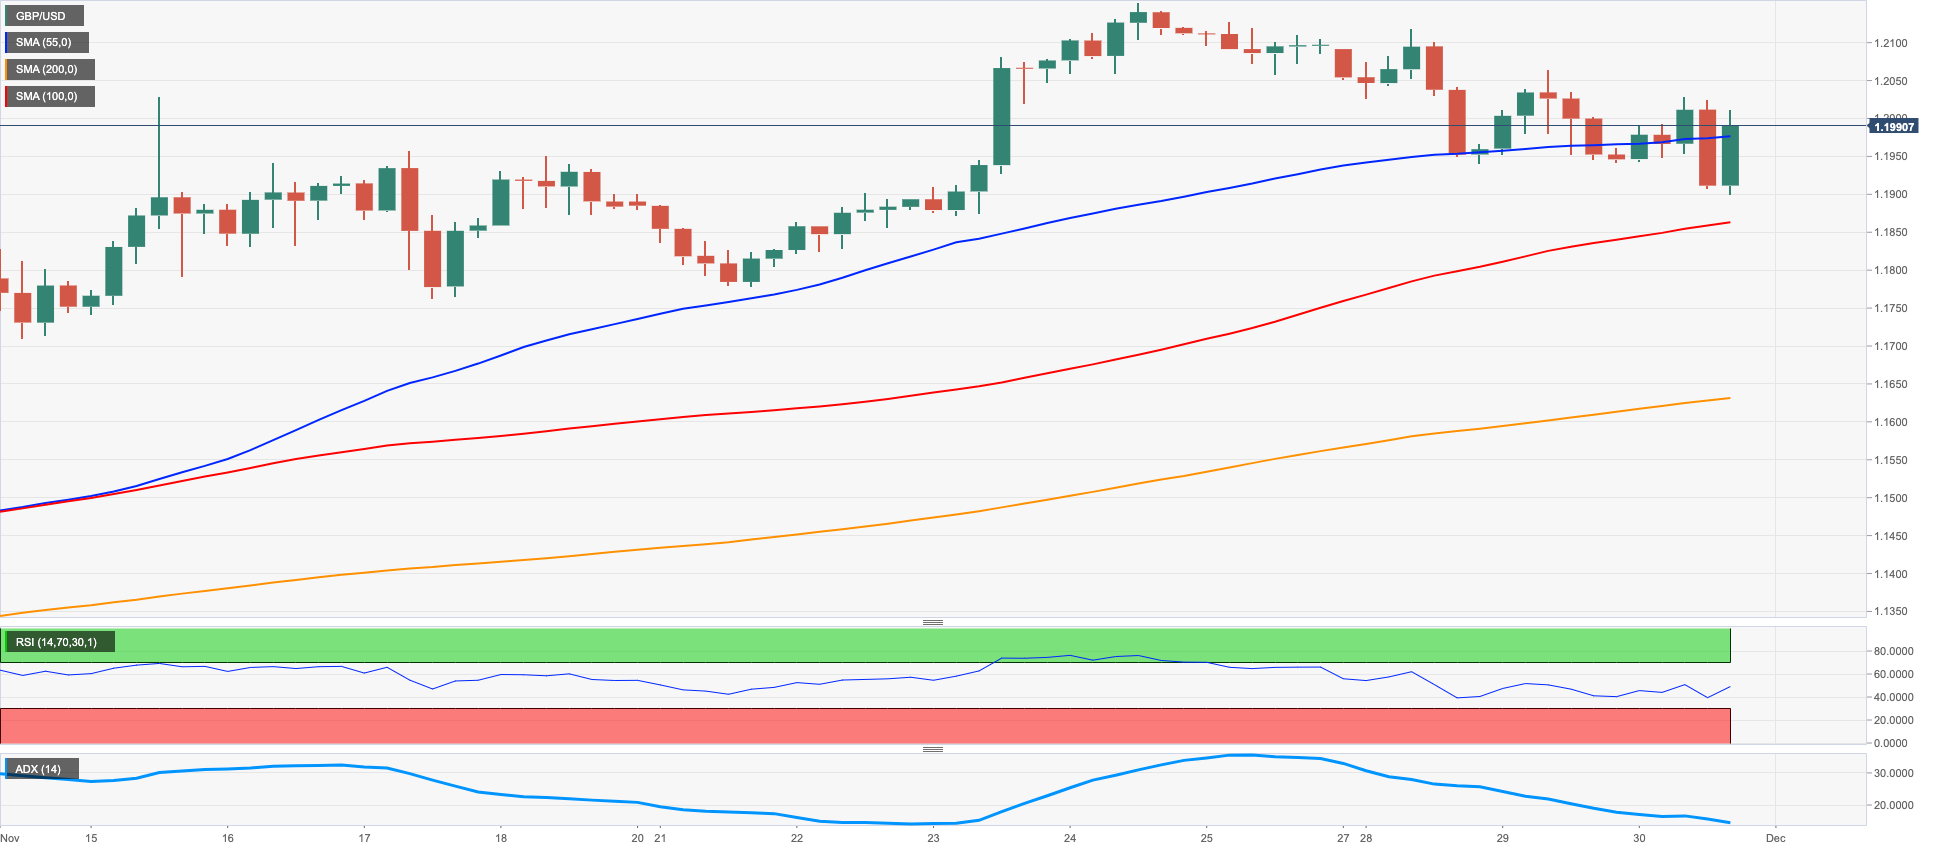
GBPUSD
GBP/USD followed the rest of the risk-linked assets and eroded part of the recent weakness on Wednesday, managing to once again surpass the key barrier at 1.2000 the figure.
The downside bias in the dollar forced the USD Index (DXY) to give away part of the recent upside amidst directionless US yields and swelling prudence ahead of the release of November’s Payrolls later in the week.
There were no data releases scheduled in the UK docket on Wednesday other than the speech by BoE’s Chief Economist H.Pill, who expects inflation to rapidly fall in H2 2023, at the time when he stressed that the labour market remains very tight. In addition, Pill suggested that the BoE has more to do on rates in the next meetings, although the base case does not involve rates climbing to the 5.25%.
GBP/USD continues to target the next up barrier at the November high at 1.2153 (November 24), which appears reinforced by the key 200-day SMA at 1.2157. If Cable breaks above this region, it could then put a probable test of the August top at 1.2293 (August 1) back on the radar prior to the weekly peak at 1.2405 (June 16) and the May high at 1.2666 (May 27). In the opposite direction, there is an initial contention at the 100- and 55-day SMAs at 1.1644 and 1.1445, respectively, before the November low at 1.1142 (November 4) and the weekly low at 1.1059 (October 21). The daily RSI advanced slightly above 60.
Resistance levels: 1.2064 1.2117 1.2153 (4H chart)
Support levels: 1.1900 1.1778 1.1762 (4H chart)
AUDUSD
The negative performance of the greenback lent extra legs to the upside momentum in AUD/USD on Wednesday. Indeed, spot managed to clinch the second straight session with gains and reclaim the area beyond 0.6700 the figure midweek.
Further strength in the Aussie dollar came from the commodity complex, where copper prices rose to multi-day highs and the iron ore gapped higher past the $100.00 mark per tonne, levels last seen back in late August.
In Oz, preliminary results expect Building Permits to contract 6.0% MoM in October and the Monthly CPI Indicator came at 6.9% in the same month.
The continuation of the rebound in AUD/USD should meet the next obstacle at the weekly peak at 0.6780 (November 25), which is closely followed by the November high at 0.6797 (November 15). Once cleared, the pair could dispute the September top at 0.6916 (September 13) prior to the key 200-day SMA at 0.6925 and seconded by the psychological 0.7000 yardstick. The surpass of the latter should give way to the weekly peak at 0.7008 (August 26) followed by the August high at 0.7136 (August 11). Just the opposite, the weekly low at 0.6584 (November 21) should initially hold the downside ahead of the 55-day SMA at 0.6506 and the weekly low at 0.6386 (November 10). The daily RSI prolonged the upside north of the 58 level.
Resistance levels: 0.6748 0.6780 0.6797 (4H chart)
Support levels: 0.6670 0.6640 0.6584 (4H chart)
-638054318963913417.png)
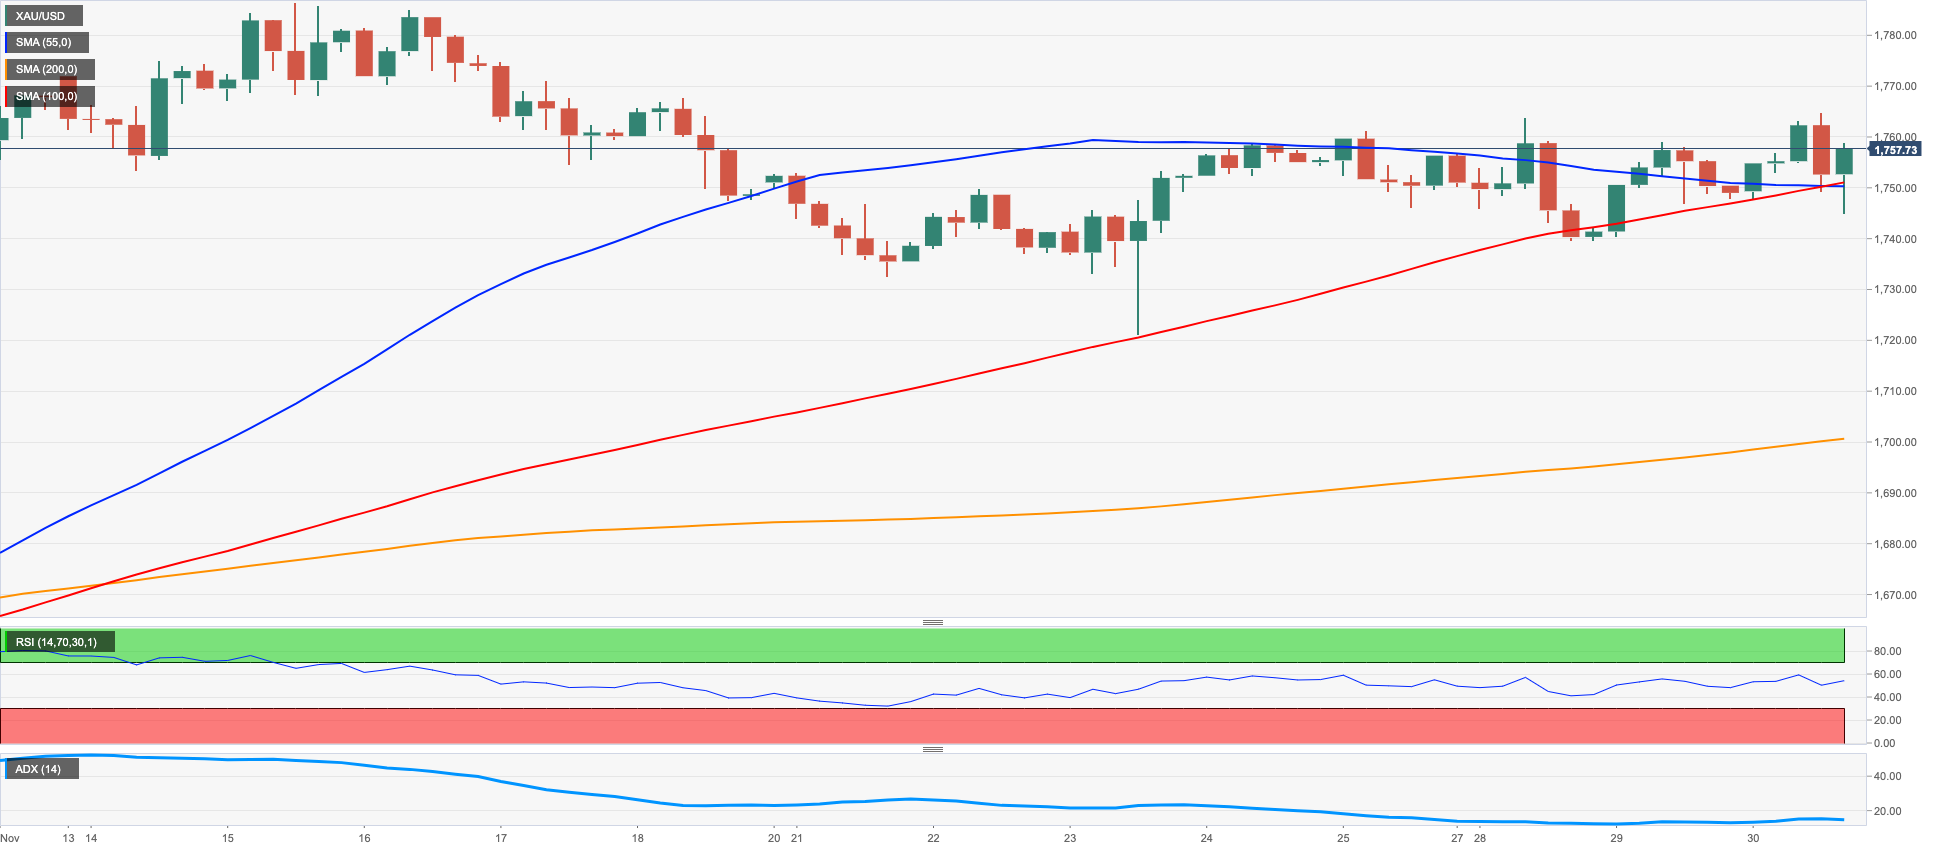
GOLD
Prices of the yellow metal climbed to multi-day highs around $1,765 on the back of the selling bias around the greenback midweek.
Indeed, while the USD Index (DXY) gave away part of the recent intense gains, US yields reversed earlier gains after Powell’s speech left no room for surprises and once again favoured slowing the pace of future interest rate hikes.
Following a new weekly high at $1,764 (November 30), gold prices now look poised to confront the November top at $1,786 (November 15) before the critical $1,800 region. This area appears bolstered by the proximity of the key 200-day SMA ($1,796) and the August peak at $1,807 (August 10). The surpass of this region leaves bullion en route to a probable visit to the June high at $1,879 (June 13). On the flip side, the next contention turns up at the weekly low at $1,732 (November 21) ahead of the interim 100- and 55-day SMAs at $1,712 and $1,689, respectively. A deeper drop could open the door to a test of the 2022 low at $1,614 (September 28) prior to the round level at $1,600.
Resistance levels: $1,764 $1,786 $1,802 (4H chart)
Support levels: $1,739 $1,727 $1,698 (4H chart)
CRUDE WTI
WTI price added to Tuesday’s rebound and surpassed the key $80.00 mark per barrel on Wednesday, reaching fresh multi-session highs around $81.30.
Indeed, traders’ sentiment improved midweek on the back of renewed supply concerns, while auspicious news coming from China citing a potential easing of the current COVID restrictions supported the commodity from the demand side.
Extra optimism also came after the EIA reported a huge 12.580M barrels drop in US crude oil supplies in the week to November 25, while inventories at Cushing shrank by 0.415M barrels, distillate stocks rose 3.547M barrels and gasoline stockpiles increased by 2.769M barrels.
However, rumours that the OPEC+ could refrain from announcing further output cuts at its December 4 meeting seem to have capped the daily gains. According to CME Group’s OPEC+ Watch Tool, the probability of an output cut is nearly 35%.
If the WTI manages to extend the bounce, it should then face temporary barriers at the 55- and 100-day SMAs at $84.70 and $87.99, respectively, prior to the $90.08 level (November 11) and the November peak at $93.73. Above the latter comes the weekly high at $97.65 (August 30), which looks propped up by the key 200-day SMA at $97.67 and emerges ahead of the psychological $100.00 mark per barrel. On the other hand, the 2022 low at $73.62 (November 28) stands as the immediate support in case sellers regain the upper hand before the round level at $70.00. The breakdown of this level could put the weekly low at $66.15 (December 20 2021) back on the traders’ radar ahead of the December 2021 low at $62.46 (December 2).
Resistance levels: $81.36 $82.35 $84.83 (4H chart)
Support levels: $77.07 $73.59 $70.79 (4H chart)
-638054319778176052.png)
DOW JONES
US stocks tracked by the three major indices rapidly returned to the positive territory after Chair Powell favoured a moderated increase of interest rate hikes going forward.
Powell reiterated that inflation stays elevated and further evidence that it is running out of steam remains to be seen, particularly after October’s lower-than-expected CPI results.
All in all, the Dow Jones rose 0.15% to 33,907, the S&P500 advanced 0.61% to 3,981 and the tech-reference Nasdaq Composite gained 1.01% to 11,094.
Further losses in the Dow Jones could retest the weekly low at 33,239 (November 17) before the key 200-day SMA at 32,460 and the interim 100-day SMA at 31,894. A deeper decline could introduce a probable move to the November low at 31,727 (November 3) just ahead of the temporary 55-day SMA at 31,516. Still on the downside, the 30,206 level (October 21) should come next followed by the psychological 30,000 mark and the 2022 low at 28,660 (October 13). Contrarily, the November peak at 34,386 (November 25) turns up as the initial obstacle prior to the April high at 35,492 and seconded by the February top at 35,824 (February 9). The daily RSI deflated below the 60 mark.
Top Performers: UnitedHealth, Microsoft, Salesforce Inc
Worst Performers: 3M, Dow, JPMorgan
Resistance levels: 34,386 35,492 35,824 (4H chart)
Support levels: 33,583 33,239 32,478 (4H chart)
-638054320083150886.png)
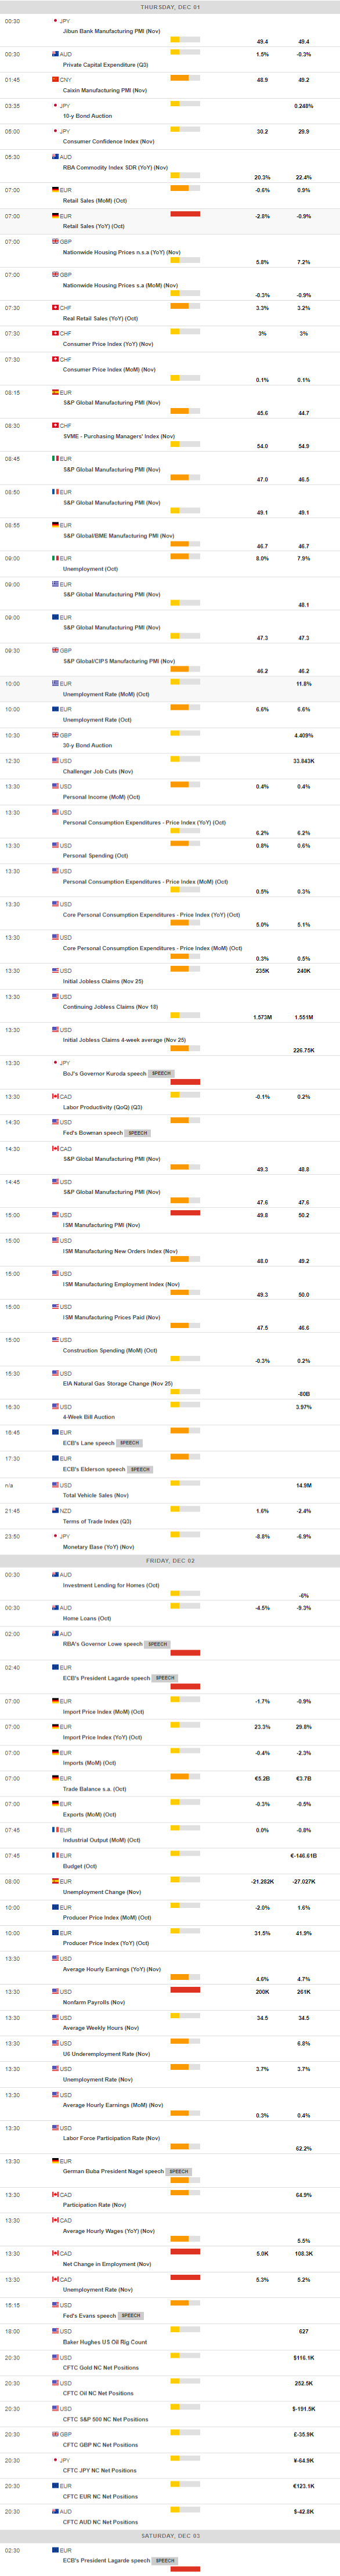
MACROECONOMIC EVENTS
All Information & Updates provided by:

All information relating to the financial markets available on this page has been prepared and issued by FXStreet (Forexstreet SL, Spain, Reg: B62498233) on the basis of publicly available information and all information believed to be reliable and does not conflict with Kuwaiti local laws, and all necessary care has been taken to before the company to ensure that the facts mentioned are correct from the source.
NCM Investment nor any of its directors or employees shall in any way be held responsible for the contents of this news, and the information contained on this page is intended only to provide clients with publicly available information and should not be construed as investment advice, report or analysis and/or constitute an offer or invitation to buy or sell financial instruments of any kind.
RISK WARNING: Forex and CFDs are highly risky leveraged products, as losses can exceed deposits. Please ensure you understand all the risks and take independent advice if necessary. NCM will segregate the clients based on the criteria of the regulator and its bylaws. NCM does not provide any advisory service; the material published does not constitute advice or a recommendation for a transaction in any financial instrument. NCM accepts no responsibility for any use of the content presented and any consequences of that use. Anyone acting on the information provided does so at their own risk.