
- Contact Us:
-

-

-

-


Daily Market Updates
02 Dec 2022
EURUSD
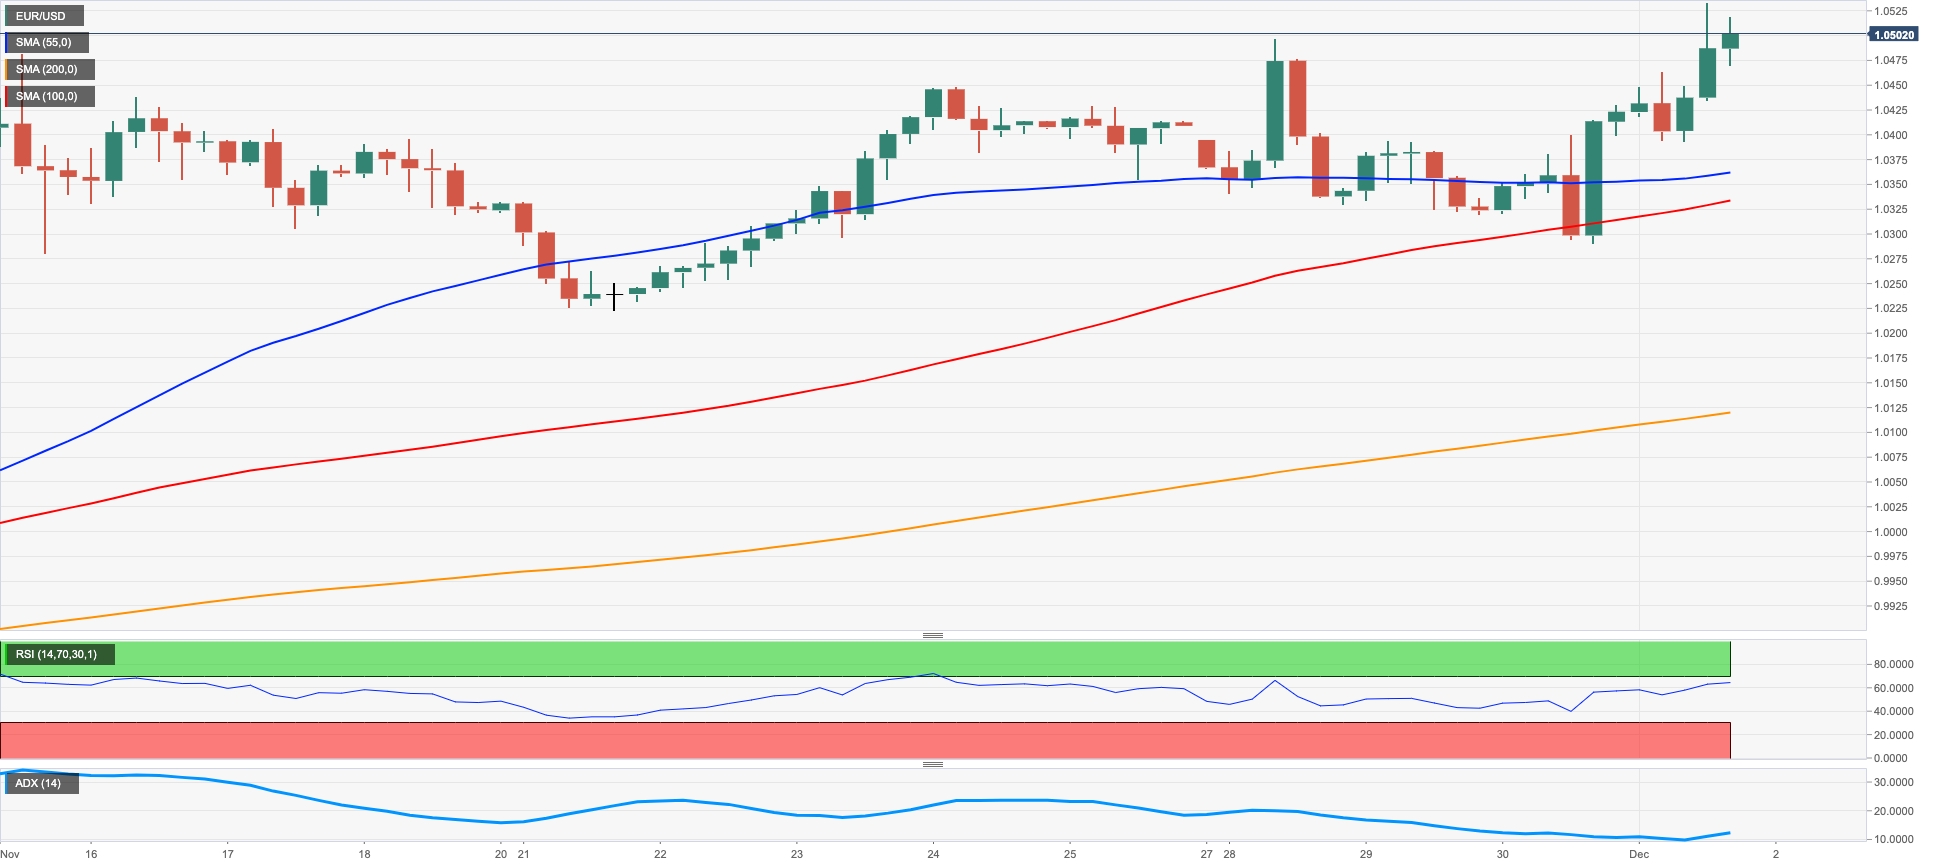
EUR/USD charted the second session in a row with gains and revisited the area north of 1.0500 the figure for the first time since late June, always on the back of the swelling downside pressure in the greenback.
Indeed, there was no respite to the greenback’s sell-off on Thursday, forcing the USD Index (DXY) to break below the 105.00 support and record fresh 4-month lows in the 104.70/65 band.
It is worth recalling that the extra weakness in the dollar was reinforced after Chair Powell reiterated at his speech on Wednesday that it would be appropriate to moderate the pace of the future interest rate hikes, a decision that could be debated as soon as at the next meeting later in the month. Falling in line with this view, FOMC’s Governor M.Bowman also advocated earlier on Thursday for a slower pace of rate increases to better assess the impact of the Fed’s normalization process.
Collaborating with the decline in the greenback emerged the broad-based decline in US yields across the curve. Same trend was also witnessed in the German money markets, where the 10-year bund yields dropped to multi-week lows around 1.80%.
In the calendar, Germany’s Retail Sales contracted at an annualized 5.0% in October, while the final Manufacturing PMI improved to 46.2 for the month of November. In the broader euro area, the Unemployment Rate ticked lower to 6.5% in October, while the final Manufacturing PMI rose to 47.1 during last month.
In the US data space, inflation figures measured by the PCE rose 6.0% YoY in October and 5.0% YoY when it came to the Core PCE. In addition, Initial Jobless Claims rose by 225K in the week to November 26, Personal Income expanded 0.7% MoM in October and Personal Spending rose 0.8% MoM. Finally, the S&P Global Manufacturing PMI came at 47.7 in November, the ISM Manufacturing PMI eased to 49.0 and Construction Spending contracted 0.3% MoM in October.
Further upside in EUR/USD now targets the weekly peak at 1.0534 (December 1). Beyond this level, there are no relevant hurdles of note until the weekly high at 1.0614 (June 27) ahead of the June top at 1.0773 (June 9) and the May peak at 1.0786 (May 30). Contrarily, the weekly low at 1.0290 (November 30) should return to the radar in case sellers regain control followed by another weekly low at 1.0222 (November 21). South from here comes the temporary 100- and 55-day SMAs at 1.0043 and 0.9993, respectively before the 0.9935 level (November 10) and the November low at 0.9730 (November 3). The daily RSI climbed further and surpassed the 67 mark.
Resistance levels: 1.0534 1.0614 1.0642 (4H chart)
Support levels: 1.0290 1.0226 1.0107 (4H chart)
USDJPY
The intense and so far unabated sell-off in the greenback in combination with renewed weakness in US yields forced USD/JPY to rapidly gather downside traction and breach the 136.00 support on Thursday.
Indeed, the pair probed the area of 4-month lows near 135.30 in line with multi-week lows in the USD Index (DXY) and US yields across the curve.
From the BoJ, Board member Noguchi advocated for the continuation of the current accommodative stance regarding monetary policy and deemed it critical to have the wage growth exceeding the inflation rate. He also noted that higher yields would clearly have a negative impact on the economy.
In the Japanese calendar, Capital Spending increased 9.8% YoY in Q3, Foreign Bond Investment shrank to ¥51.2B in the week to November 26 and the Consumer Confidence receded to 28.6 during last month (from 29.9).
A deeper drop in USD/JPY is now expected to challenge the key 200-day SMA at 134.39 ahead of the August low at 130.39 (August 2) and prior to the round level at 130.00. In the opposite direction, the weekly high at 139.89 (November 30) should offer initial resistance seconded by the interim 100-day SMA at 141.16. North from here comes the weekly top at 142.25 (November 21) prior to the temporary 55-day SMA at 144.21. Once cleared, the pair could challenge the weekly peak at 148.84 (October 31) before the 2022 high at 151.94 (October 21). The daily RSI sank to the oversold territory near 27.
Resistance levels: 139.89 141.61 142.25 (4H chart)
Support levels: 135.32 134.64 133.90 (4H chart)
-638055191363282317.png)
GBPUSD
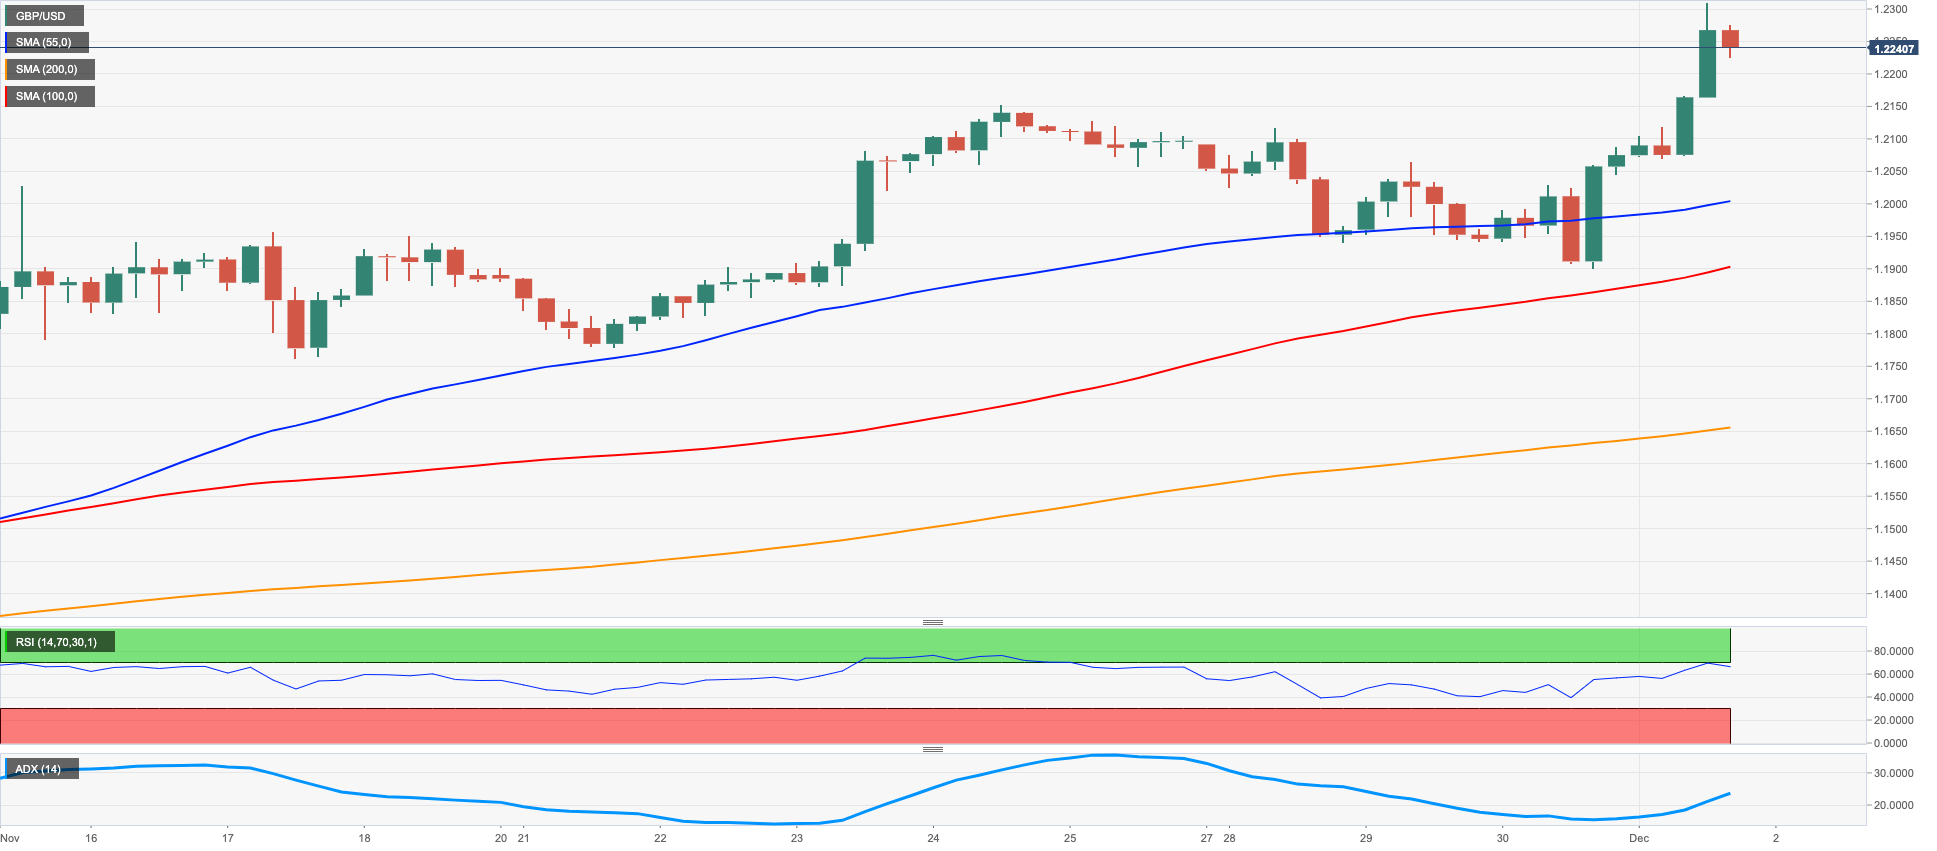
The slump in the dollar allowed GBP/USD to accelerate gains to new 6-month highs past the 1.2300 hurdle on Thursday. The sharp advance, however, fizzled out somewhat afterwards and Cable returned to the sub-1.2300 region.
Indeed, market participants continued to dump the greenback, particularly after Chief Powell stepped on the brakes of the normalization process and signaled that a slower pace of rate hikes could be up for discussion at the December 14 gathering.
In the UK, house prices gauged by the Nationwide Housing Prices rose 4.4% in the year to November, while the final S&P Global Manufacturing PMI rose to 46.5 in November (from 46.2).
Following Thursday’s intense advance, GBP/USD now needs to clear the weekly peak at 1.2311 (December 1) to allow for a potential visit to the weekly high at 1.2405 (June 16) followed by the May top at 1.2666 (May 27). Alternatively, there is a minor support at the weekly low at 1.1900 (November 30) prior to the 100- and 55-day SMAs at 1.1649 and 1.1460, respectively, ahead of the November low at 1.1142 (November 4) and the weekly low at 1.1059 (October 21). The daily RSI leapt to the area past the 67 level.
Resistance levels: 1.2311 1.2332 1.2405 (4H chart)
Support levels: 1.2069 1.1900 1.1778 (4H chart)
AUDUSD
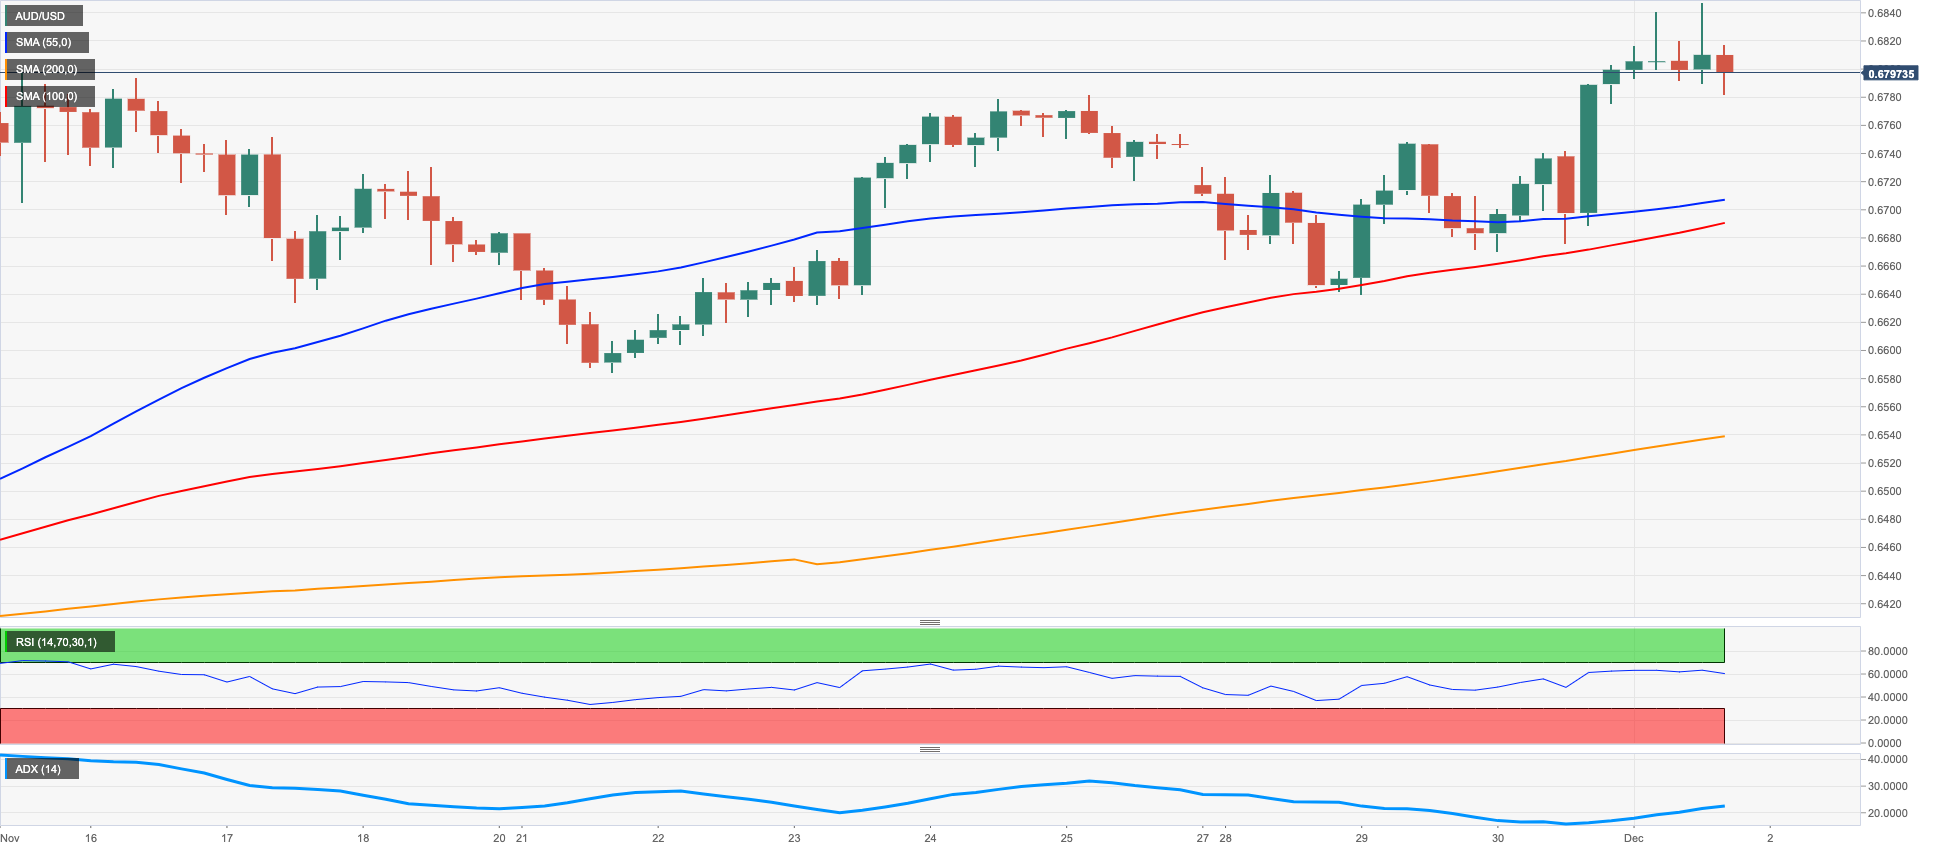
The weekly rebound in AUD/USD just picked up extra pace and advanced past 0.6800 the figure for the first time since mid-September on Thursday.
Indeed, another strong daily pullback in the dollar lent fresh wings to the Aussie dollar and the rest of the risk-linked assets, while the generalized solid performance of the commodity galaxy added to the upbeat mood in the pair.
In addition, rumours/speculation that China could ease its current zero-COVID policy at some point in the not-so-distant future also collaborated with the buying interest in copper and iron ore, which in turn morphed into further support for AUD.
In Australia, Commodity Prices rose at an annualized 19.1% in the year to November.
If AUD/USD breaks above the weekly top at 0.6844, it could then extend the recovery to the September peak at 0.6916 (September 13) ahead of the key 200-day SMA at 0.6924 and followed by the psychological 0.7000 mark. Further north turns up the weekly high at 0.7008 (August 26) prior to the August top at 0.7136 (August 11). By contrast, sellers are expected to meet initial contention at the weekly low at 0.6640 (November 29) ahead of another weekly low at 0.6584 (November 21). The breakdown of the latter could prompt spot to test the 55-day SMA at 0.6510 followed by the weekly low at 0.6386 (November 10). The daily RSI improved to the boundaries of the 63 region.
Resistance levels: 0.6844 0.6916 0.6956 (4H chart)
Support levels: 0.6782 0.6676 0.6640 (4H chart)
GOLD
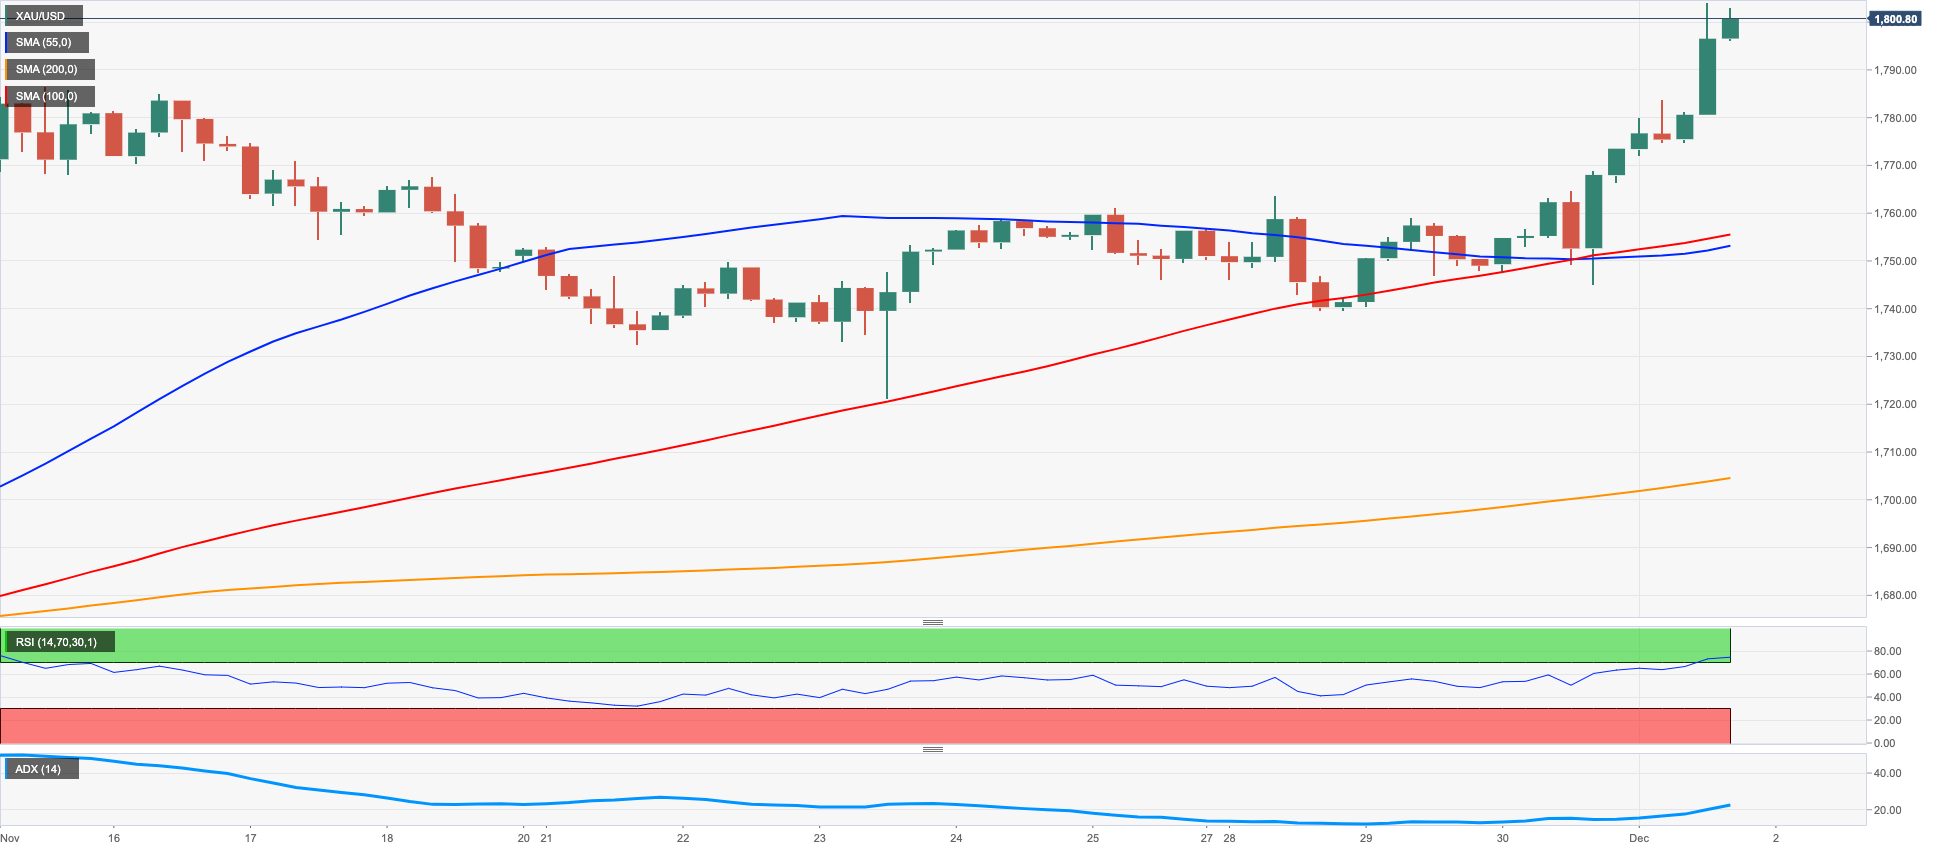
Finally, gold prices managed to return to the key $1,800 area per ounce troy on Thursday, always accompanied by the increasingly deteriorating price action around the US dollar.
On the latter, the dollar succumbed to further selling pressure as market participants continued to digest Powell’s remarks on Wednesday, which were also bolstered by Thursday’s speech by FOMC’s Governor M.Bowman.
Adding to the upbeat momentum in the precious metal, US yields dropped further and recorded new multi-week lows across the curve.
Immediately to the upside for bullion now comes the August high at $1,807 (August 10) ahead of the June top at $1,879 (June 13) and followed by the May peak at $1,909 (May 5). Just the opposite, there are no support levels of note until the weekly low at $1,732 (November 21) prior to the interim 100- and 55-day SMAs at $1,713 and $1,692, respectively. The loss of this region could put a probable visit to the 2022 low at $1,614 (September 28) back on the traders’ radar ahead of the round level at $1,600.
Resistance levels: $1,804 $1,807 $1,814 (4H chart)
Support levels: $1,744 $1,739 $1,727 (4H chart)
CRUDE WTI
Prices of the barrel of the West Texas Intermediate (WTI) rose for the third straight session and surpassed the $83.00 mark on Thursday.
The continuation of the rebound from the new 2022 low recorded on November 28 near $73.60 came on the back of positive news saying that two big cities in China managed to suppress COVID restrictions, fuelling speculation that demand for crude oil could start recovering in the short term.
In addition, the weaker dollar underpinned the upside in prices of the commodity, while traders appear to keep on the table a potential output cut by the OPEC+ at its December 4 gathering.
Further gains in WTI could confront interim hurdles at the 55- and 100-day SMAs at $84.64 and $87.84, respectively, ahead of a probable visit to the $90.08 level (November 11) and the November high at $93.73. The surpass of this level exposes the weekly top at $97.65 (August 30), which appears underpinned by the key 200-day SMA and lies before the psychological $100.00 mark per barrel. On the contrary, there is initial support at the 2022 low at $73.62 (November 28) seconded by the round level at $70.00 and the weekly low at $66.15 (December 20 2021). The breach of the latter could pave the way for a move to the December 2021 low at $62.46 (December 2).
Resistance levels: $83.32 $84.65 $88.65 (4H chart)
Support levels: $79.92 $77.07 $73.59 (4H chart)
-638055192871129949.png)
DOW JONES
Equities traded in a mixed note after investors digested Powell’s speech on Wednesday and some prudence emerged ahead of the release of Nonfarm Payrolls on Friday, while some profit taking was also in play considering Thursday’s sharp gains.
In addition, the weak result from November’s ISM Manufacturing reignited recession fears and thus weighed on traders’ sentiment.
Against that, the Dow Jones retreated 0.81% to 34,305, the S&P500 dropped 0.28% to 4,068 and the tech-heavy Nasdaq Composite advanced 0.08% to 11,477.
Despite the corrective decline, the Dow Jones remains firm and is expected to extend gains once the November high at 34,386 (November 25) is cleared. North from here aligns the April top at 35,492 ahead of the February peak at 35,824 (February 9). On the other hand, the weekly low at 33,585 (November 30) offers near-term contention prior to the weekly low at 33,239 (November 17) and the key 200-day SMA at 32,461. The breach of this zone exposes the temporary 100-day SMA at 31,936 before the November low at 31,727 (November 3) and the 55-day SMA at 31,590. The daily RSI slipped back to the sub-65 area.
Top Performers: Nike, Home Depot, Cisco
Worst Performers: Salesforce Inc, Verizon, Boeing
Resistance levels: 34,595 35,492 35,824 (4H chart)
Support levels: 33,583 33,239 32,478 (4H chart)
-638055193324318700.png)
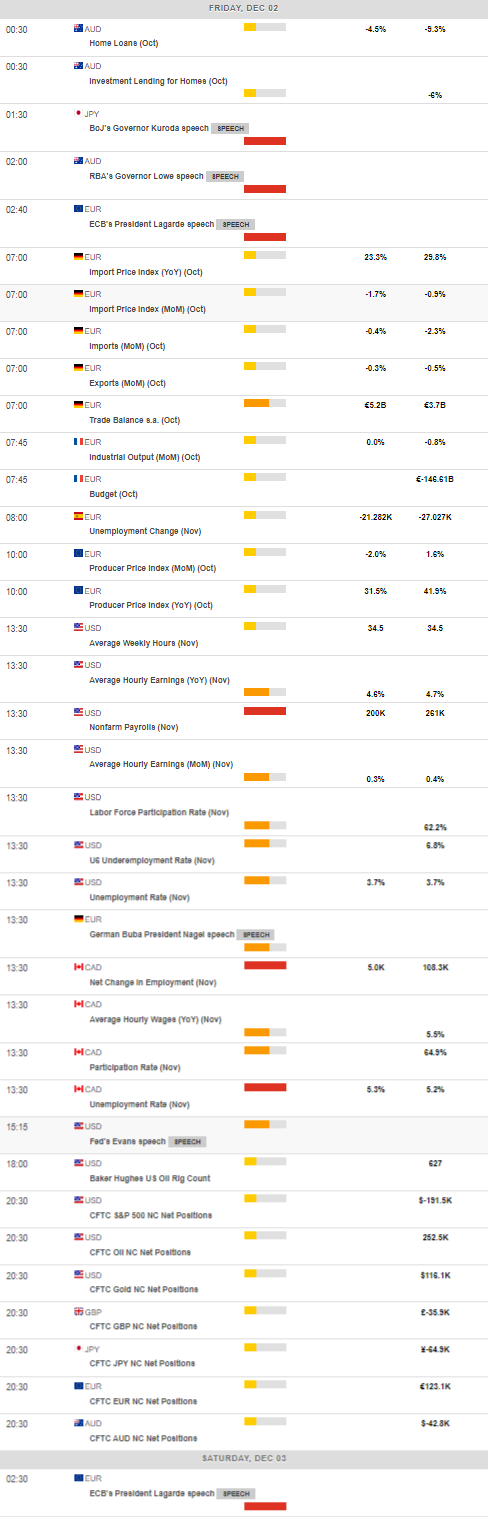
MACROECONOMIC EVENTS
All Information & Updates provided by:

All information relating to the financial markets available on this page has been prepared and issued by FXStreet (Forexstreet SL, Spain, Reg: B62498233) on the basis of publicly available information and all information believed to be reliable and does not conflict with Kuwaiti local laws, and all necessary care has been taken to before the company to ensure that the facts mentioned are correct from the source.
NCM Investment nor any of its directors or employees shall in any way be held responsible for the contents of this news, and the information contained on this page is intended only to provide clients with publicly available information and should not be construed as investment advice, report or analysis and/or constitute an offer or invitation to buy or sell financial instruments of any kind.
RISK WARNING: Forex and CFDs are highly risky leveraged products, as losses can exceed deposits. Please ensure you understand all the risks and take independent advice if necessary. NCM will segregate the clients based on the criteria of the regulator and its bylaws. NCM does not provide any advisory service; the material published does not constitute advice or a recommendation for a transaction in any financial instrument. NCM accepts no responsibility for any use of the content presented and any consequences of that use. Anyone acting on the information provided does so at their own risk.