
- Contact Us:
-

-

-

-


Daily Market Updates
05 Dec 2022
EURUSD
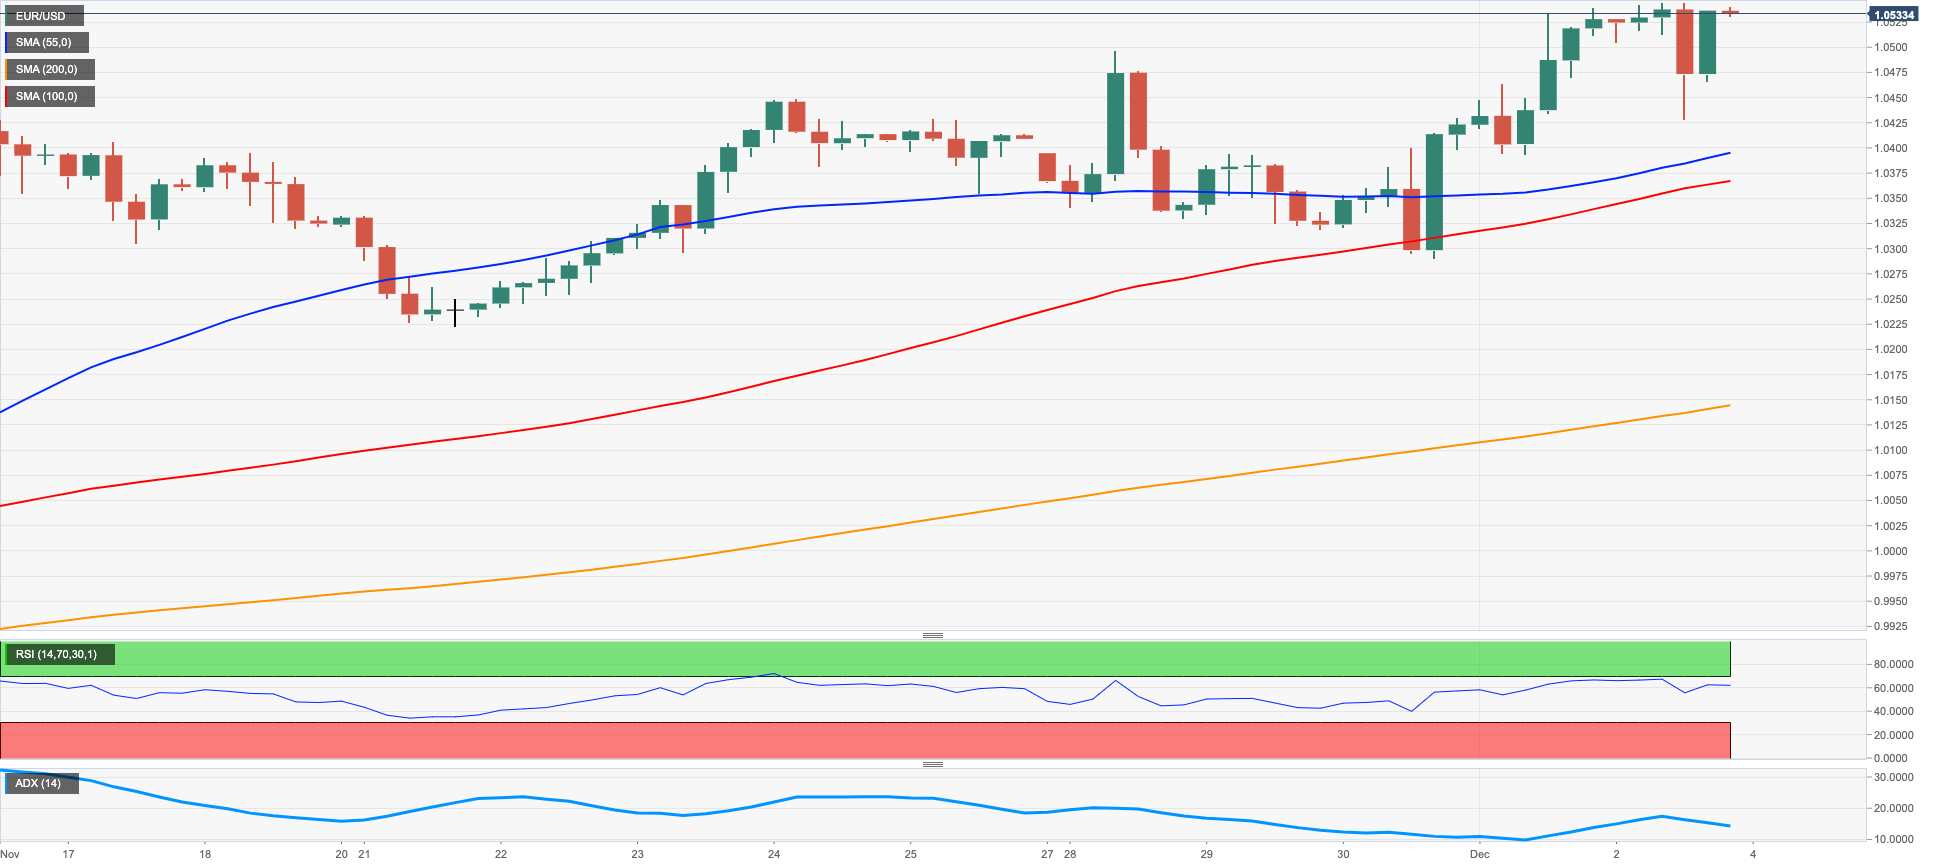
EUR/USD clinched a fresh 6-month high near 1.0550 on Thursday, although it came under some mild pressure afterwards, and particularly following another solid result from the US jobs report.
In fact, the greenback rebounded from multi-month lows near 104.30 when gauged by the USD Index (DXY) after the US economy created 263K jobs in November and the Unemployment Rate held steady at 3.7%. The index, however, succumbed to the eventual resumption of the selling pressure and ended the week well south of the 105.00 mark and in levels last seen in late June.
The pair’s decent gains also came amidst a humble bounce in the short end of the US yield curve vs. the continuation of the decline in the belly and the long end, always against the backdrop of the investors’ preference for a 50 bps interest rate hike by the Fed later in the month.
Data wise in Germany, October’s trade surplus widened to €6.9B (from €3.7B).
Across the pond, the US labour market report also showed Average Hourly Earnings rising 0.3% MoM and 4.6% over the last twelve months, while the Participation Rate rose a tad to 62.4% (from 62.2%).
EUR/USD seems to have convincingly broken above the 200-day SMA and the 10-month resistance line near 1.0420. That said, once the December high at 1.0544 (December 2) is cleared, then the next target of note is seen at the weekly top at 1.0614 (June 27) prior to the June peak at 1.0773 (June 9) and the May high at 1.0786 (May 30). On the other hand, there is initial contention at the weekly low at 1.0290 (November 30) ahead of another weekly low at 1.0222 (November 21). The loss of the latter exposes the interim 100- and 55-day SMAs at 1.0047 and 1.0003, respectively prior to the 0.9935 level (November 10) and the November low at 0.9730 (November 3). The daily RSI flirted with the overbought zone near 69.
Resistance levels: 1.0544 1.0614 1.0642 (4H chart)
Support levels: 1.0428 1.0290 1.0222 (4H chart)
USDJPY
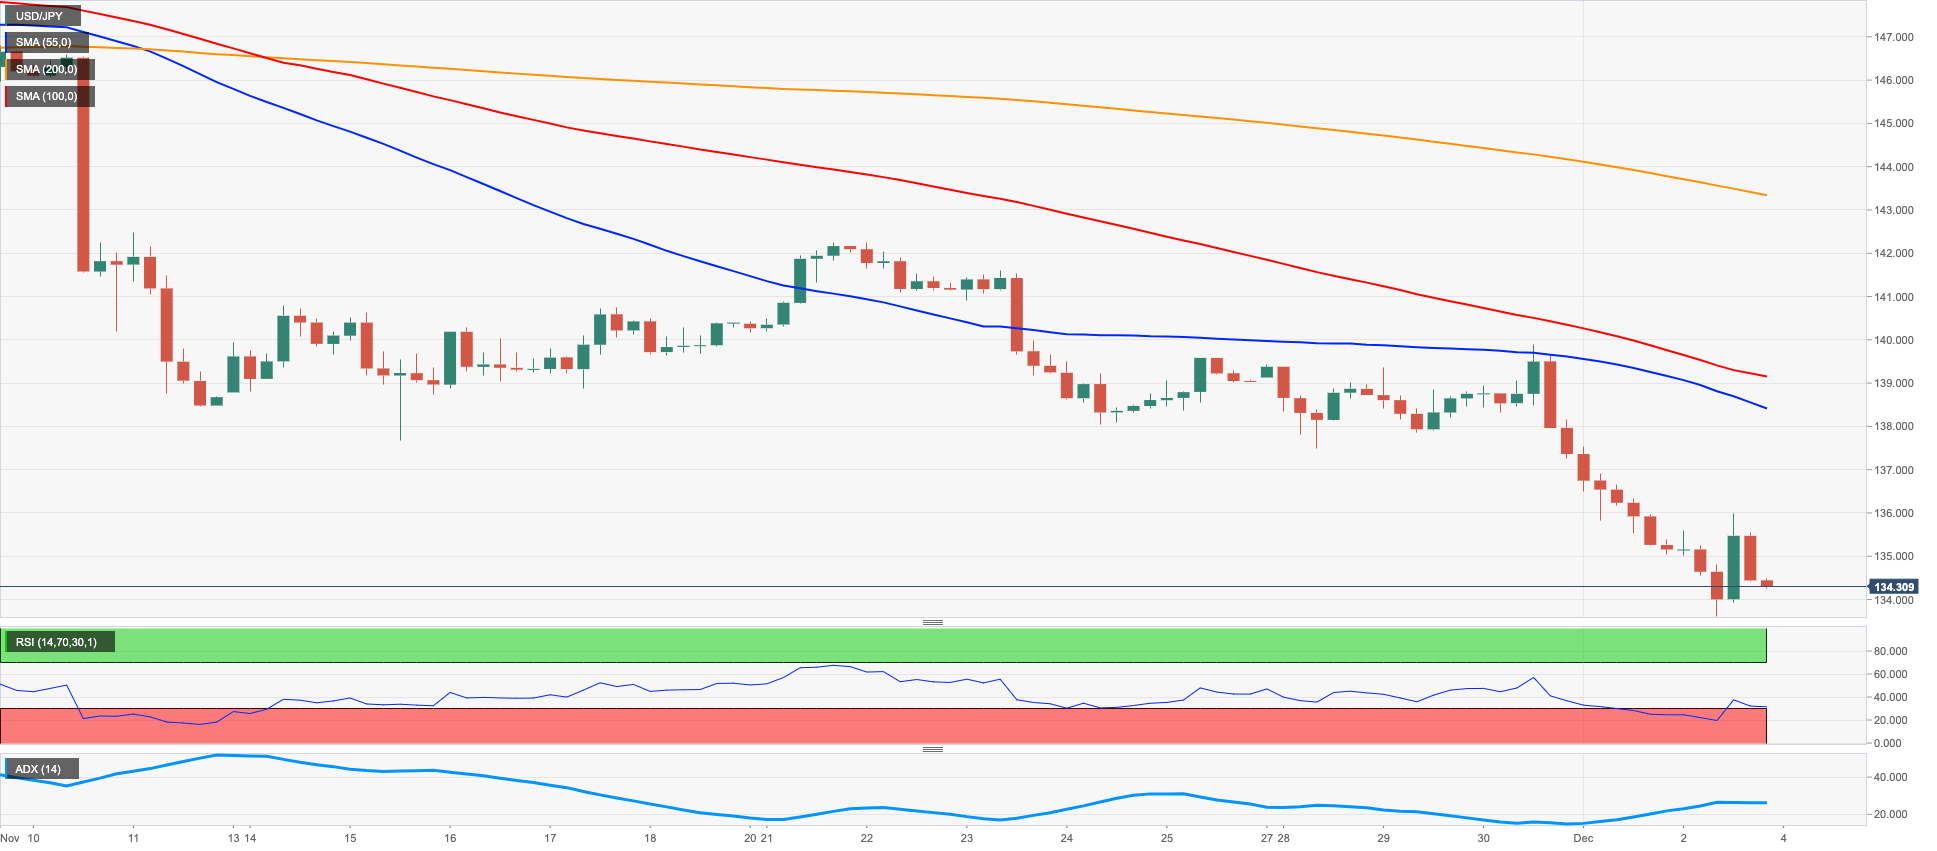
USD/JPY probed lows in a region last seen in mid-August around 133.60 during the worst moment of Friday’s session, just to bounce afterwards in line with some recovery in the dollar in the wake of the release of US November Payrolls (+263K).
The rebound in US yields in the short end of the curve also collaborated with the bounce in the pair, although it did not prevent the spot from closing for the fifth consecutive day in the red territory.
It is worth noting that the pair shed nearly six big figures since Wednesday’s peak near the 140.00 barrier to Friday’s low near 133.60.
News from the BoJ cited Governor H.Kuroda reiterating that domestic inflation is expected to start losing traction in 2023 along with global inflation.
The next release in the Japanese calendar will be the final reading of the Jibun Bank Services PMI for the month of November, due on November 5.
The breach of the December low at 133.61 (December 2) should force USD/JPY to confront the August low at 130.39 (August 2) before the round level at 130.00. Alternatively, occasional bullish attempts are expected to meet the next hurdle at the weekly top at 139.89 (November 30) followed by the temporary 100-day SMA at 141.12 and the weekly peak at 142.25 (November 21). North from here comes the provisional 55-day SMA at 144.06 ahead of the weekly high at 148.84 (October 31) and the 2022 top at 151.94 (October 21). The daily RSI dropped further into the oversold area near 25.
Resistance levels: 135.97 139.89 141.61 142.25 (4H chart)
Support levels: 133.61 132.55 131.73 (4H chart)
GBPUSD
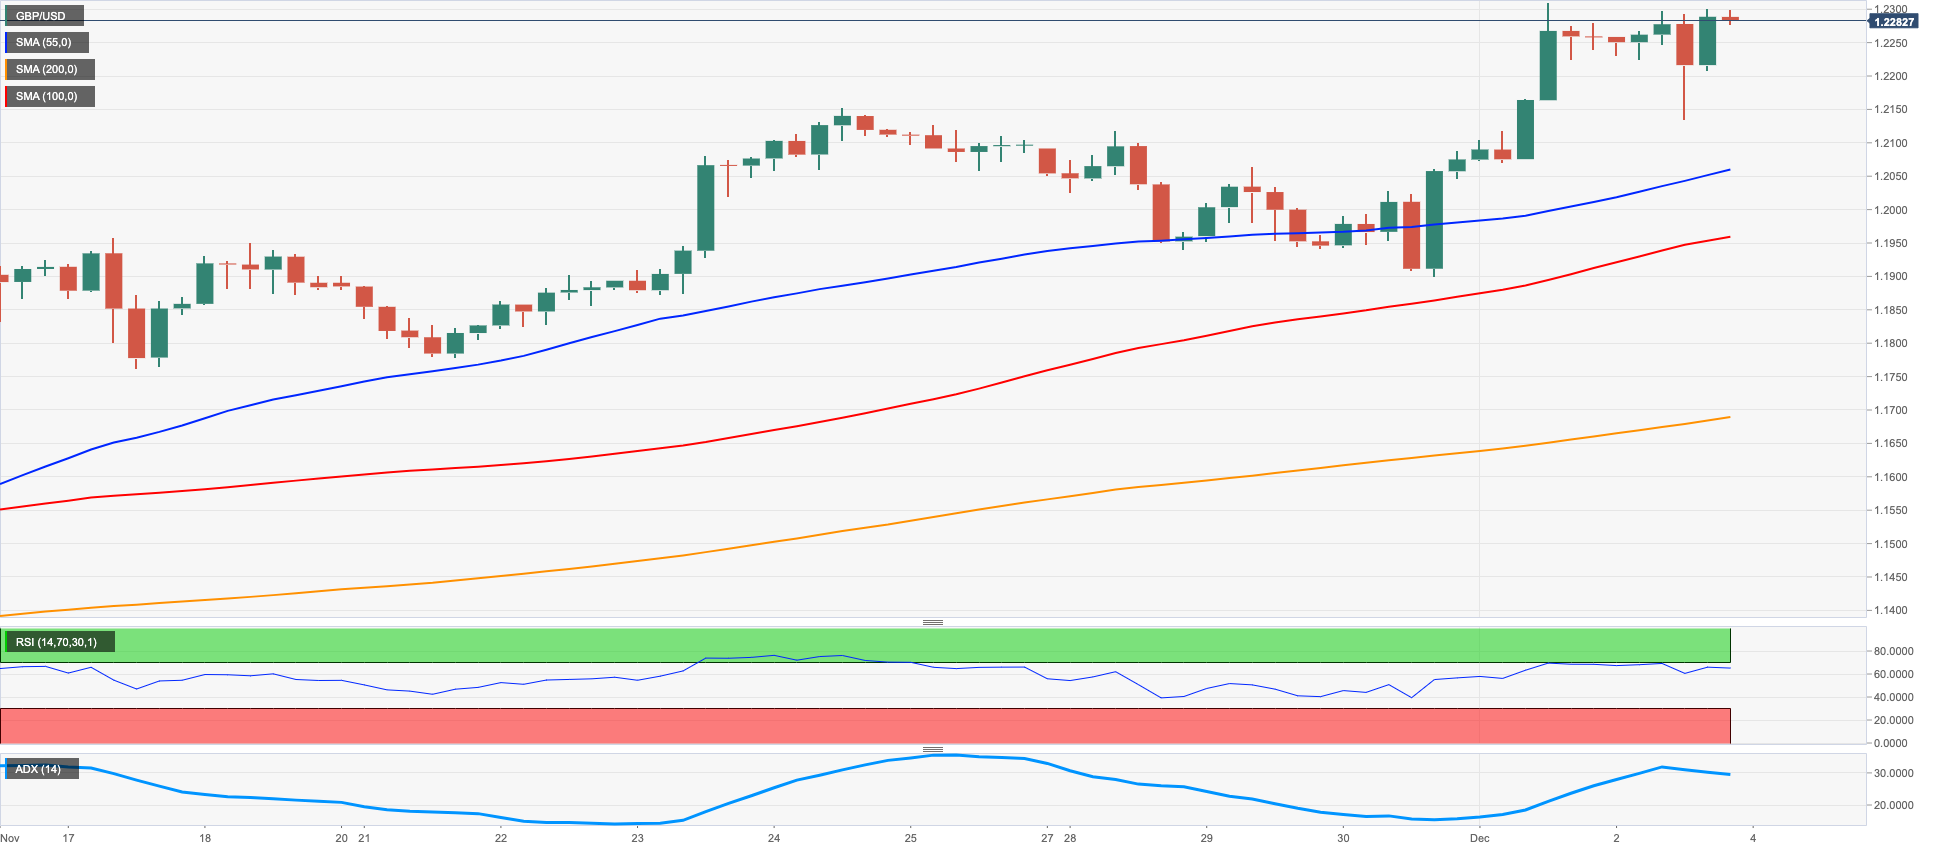
GBP/USD advanced for the third consecutive session and ended the week in the area of 6-month highs at shouting distance from 1.2300 the figure on Friday. Additionally, Cable closed the fourth week in a row with gains and entered the third month in a row in the positive territory.
Once again, the intense retracement in the greenback lent extra legs to the risk complex and helped the pair surpassing the key 200-day SMA at 1.2146. A sustained advance beyond the latter should allow Cable to extend further the current optimism.
There were no data releases scheduled in the UK on Friday. The next publication of note will be the always relevant final S&P Global Services and New Car Sales, both out on December 5.
The so far December high at 1.2311 (December 1) emerges as the immediate hurdle for GBP/USD bulls in the near term. The trespass of this level should open the door to Thursday’s intense advance, GBP/USD now needs to clear the weekly peak at 1.2311 (December 1) to allow for a potential visit to the weekly high at 1.2405 (June 16) followed by the May top at 1.2666 (May 27). Contrarily, initial contention turns up at the weekly low at 1.1900 (November 30) seconded by the 100- and 55-day SMAs at 1.1653 and 1.1476, respectively, before the November low at 1.1142 (November 4) and the weekly low at 1.1059 (October 21). The daily RSI improved past the 68 level.
Resistance levels: 1.2311 1.2332 1.2405 (4H chart)
Support levels: 1.2133 1.1900 1.1778 (4H chart)
AUDUSD
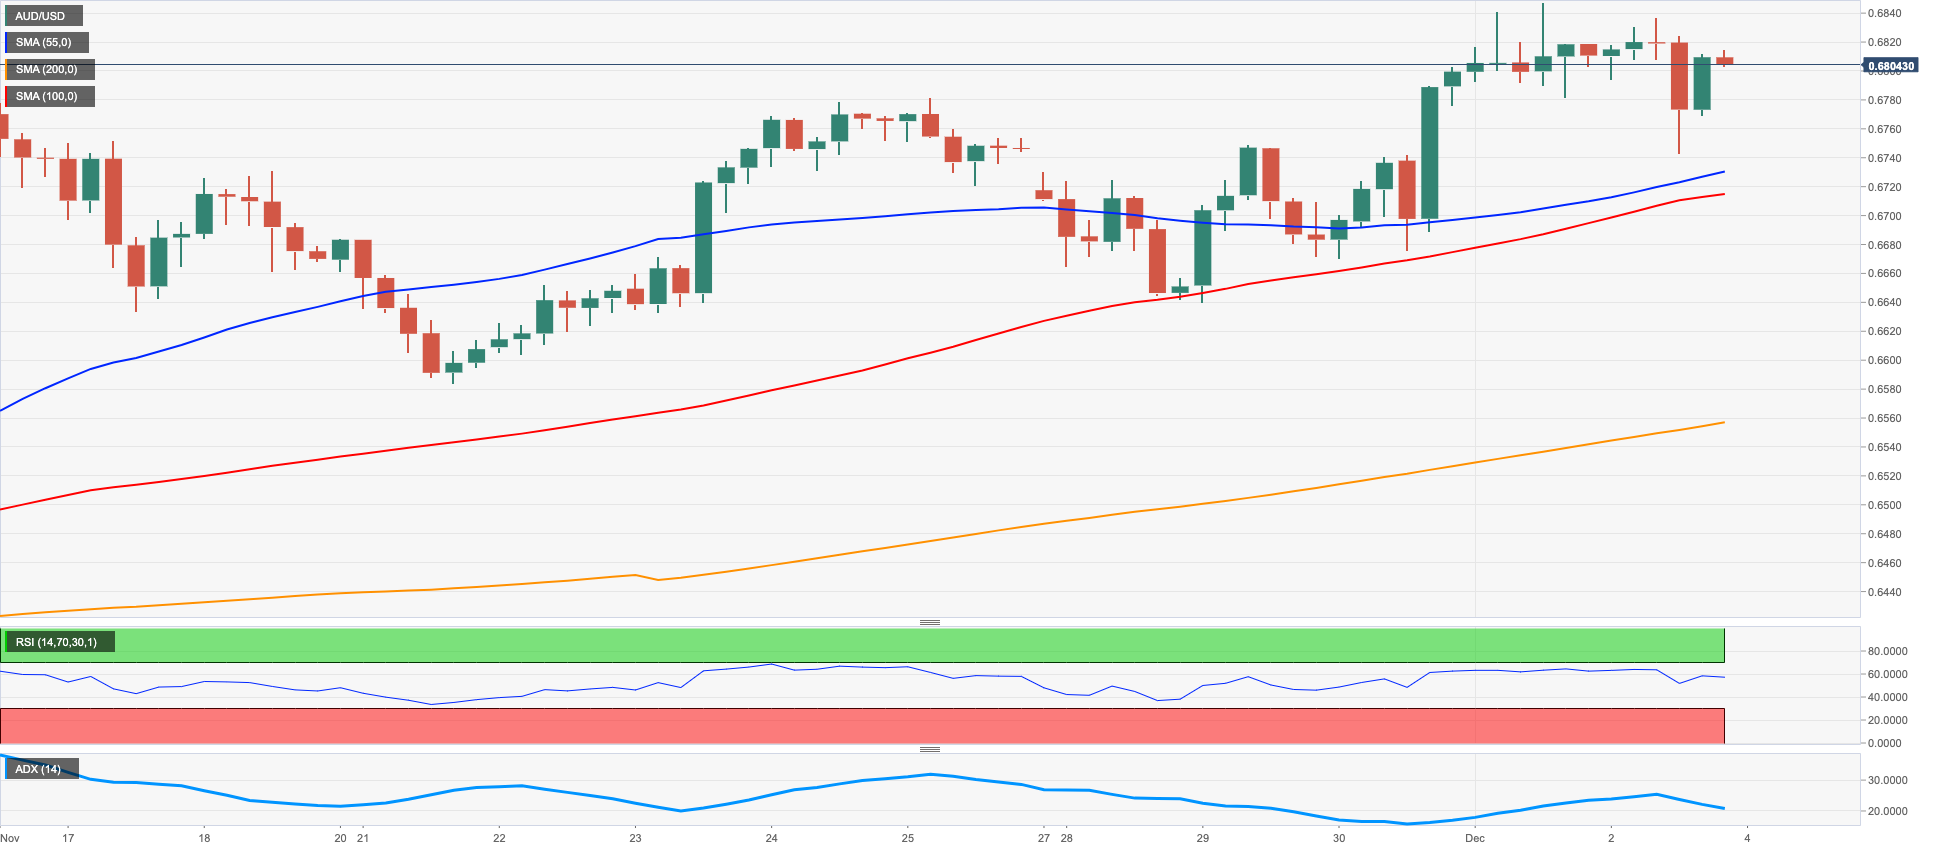
AUD/USD halted a 3-session positive streak and printed modest losses around the 0.6800 neighbourhood at the end of the week.
The pair failed to capitalize on the continuation of the downside pressure around the greenback and gave away part of the recent sharp advance past the 0.6800 mark, or 3-month highs.
The rebound from daily lows near 0.6740 came in response to the solid performance in the commodity complex and following another positive price action in copper and the iron ore, which remained propped up by auspicious news regarding potential easing COVID restriction in China.
From the RBA, Governor P.Lowe suggested that an impasse in the hiking cycle comes in response to monetary policy lags, which are expected to be longer than usual during this cycle.
Results from the calendar Down Under saw Home Loans contract 2.9% MoM in October, Investment Lending for Homes drop 2.2% and final Retail Sales shrank 0.2% in October vs. the previous month.
Despite the daily knee-jerk, the outlook for AUD/USD remains positive for the time being. That said, the surpass of the weekly peak at 0.6844 could pave the way for a visit to the September high at 0.6916 (September 13) prior to the key 200-day SMA at 0.6921 and seconded by the psychological 0.7000 mark. Beyond the latter comes the weekly top at 0.7008 (August 26) prior to the August peak at 0.7136 (August 11). In the opposite direction, initial contention emerges at the weekly low at 0.6640 (November 29) before another weekly low at 0.6584 (November 21). South from here appears the 55-day SMA at 0.6511 ahead of the weekly low at 0.6386 (November 10). The daily RSI grinded marginally lower below the 62 yardstick.
Resistance levels: 0.6844 0.6916 0.6956 (4H chart)
Support levels: 0.6742 0.6676 0.6640 (4H chart)
GOLD
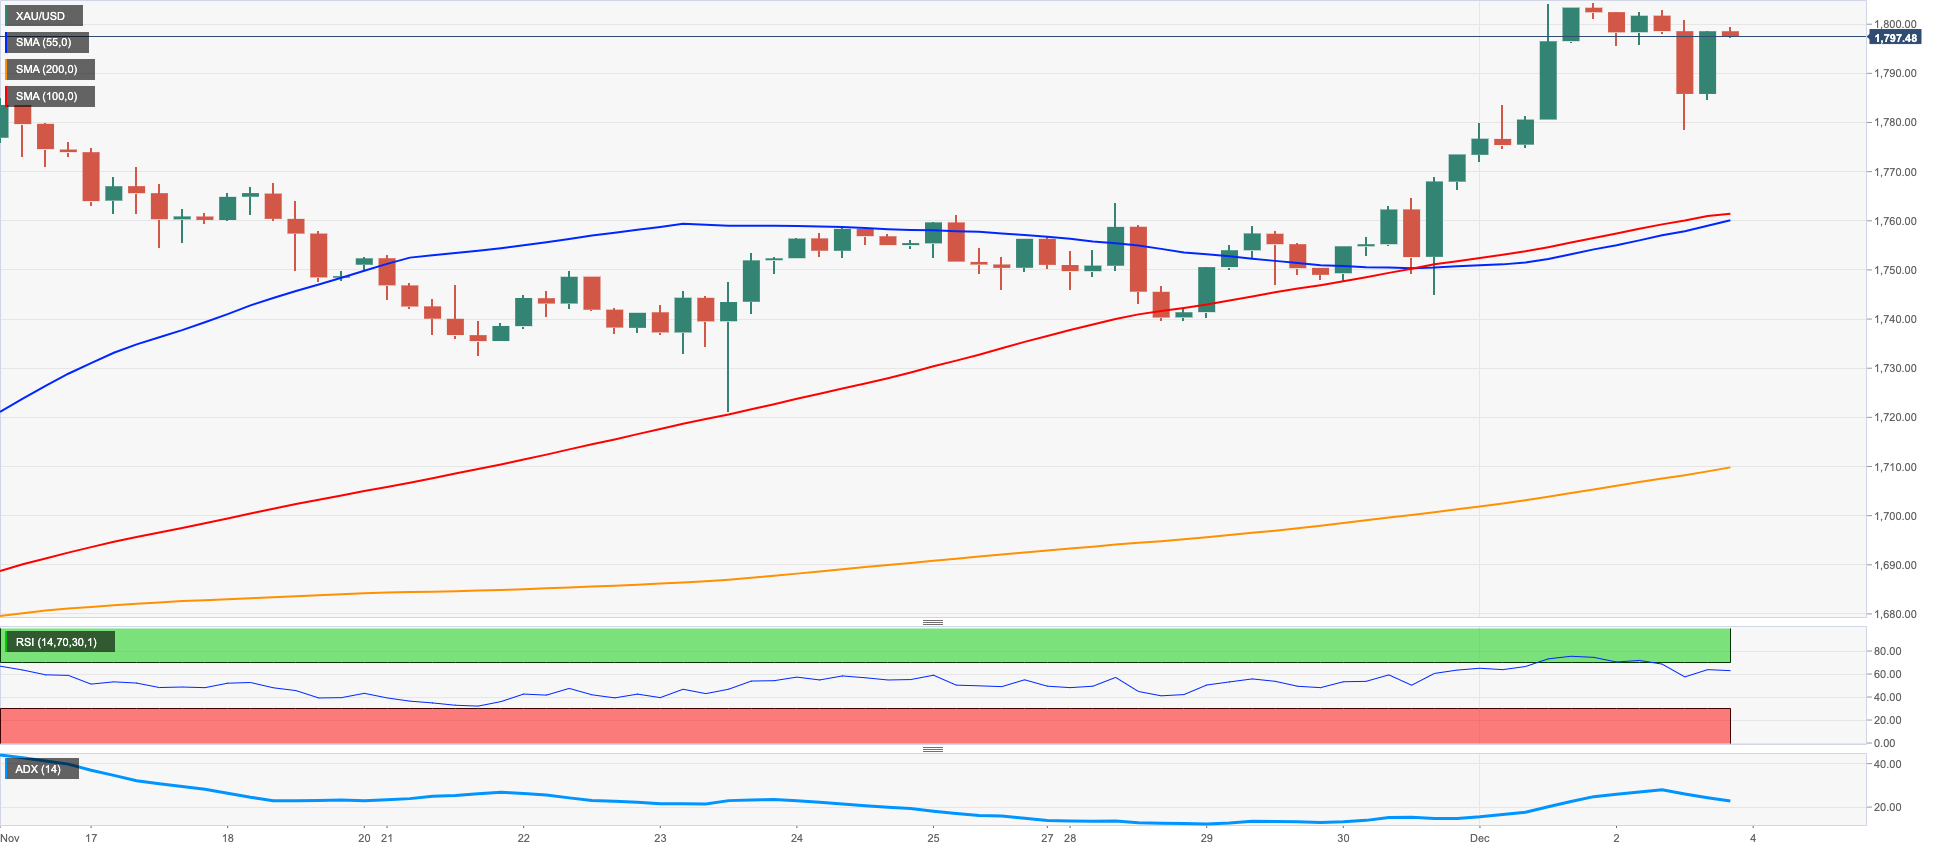
Gold prices managed to almost fully reverse the post-Payrolls strong drop to the sub-$1,780 area and closed Friday’s session around the critical $1,800 mark. Despite the daily knee-jerk, the precious metal closed the second week in a row with gains and started the second consecutive month in the positive territory.
Indeed, the greenback quickly faded the NFP-led bullish attempt and returned to the area of multi-month lows, helping at the same time with the rebound in the yellow metal. Collaborating with the latter, the mixed performance of US yields saw the belly and the long end of the curve extend the recent bearishness vs. a modest uptick in the short end.
Gold faces an immediate up barrier at the so far December high at $1,804 (December 1,2) closely followed by the August top at $1,807 (August 10). The surpass of this region puts a potential visit to the June peak at $1,879 (June 13) back on the traders’ radar ahead of the May high at $1,909 (May 5). By contrast, the weekly low at $1,732 (November 21) emerges as the next magnet for gold bears followed by the temporary support levels at the 100- and 55-day SMAs at $1,714 and $1,694, respectively. South from here turns up the 2022 low at $1,614 (September 28) prior to the round level at $1,600.
Resistance levels: $1,804 $1,807 $1,814 (4H chart)
Support levels: $1,778 $1,744 $1,739 (4H chart)
CRUDE WTI
WTI prices traded on the defensive for the first time after three consecutive daily advances on Friday, settling just cents above the key $80.00 mark per barrel. Despite the retracement, crude oil prices managed to finally close a week with gains following three drops in a row.
In fact, prices of the commodity closely followed speculation of a potential oil output cut from the OPEC+ at its meeting on December 4, at the time when traders continued to digest the EU/G7 $60/barrel cap on Russian oil.
In addition, news that China could finally start curbing some COVID restrictions also helped the WTI limiting losses.
In the docket, driller Baker Hughes said the US oil rig count showed no variation in the week to December 2, maintaining the total US active oil rigs at 627.
The December high at $83.32 (December 1) appears as the initial up barrier in case the WTI resumes the upside. Beyond that level comes the provisional hurdles at the 55- and 100-day SMAs at $84.54 and $87.67, respectively, prior to the $90.08 level (November 11) and the November high at $93.73. Further north aligns the 200-day SMA at $97.55, which precedes the weekly peak at $97.65 (August 30), all ahead of the psychological $100.00 mark per barrel. On the flip side, the 2022 low at $73.62 (November 28) emerges as the next target for sellers followed by the round level at $70.00 and the weekly low at $66.15 (December 20 2021). A deeper correction could see the December 2021 low at $62.46 (December 2) revisited.
Resistance levels: $83.32 $84.52 $88.65 (4H chart)
Support levels: $79.66 $77.07 $73.59 (4H chart)
-638057634778433888.png)
DOW JONES
Equities traded in a mixed note when measured by the three major US stock indices at the end of the week. All three indices, however, managed to close the second week in a row with gains.
In fact, investors’ mood vacillated amidst the still strong US labour market – as per November’s Payrolls figures – and the tangible likelihood that the Fed could start discussing a slower pace of future interest rate hikes as soon as at the December meeting.
Supporting the modest gains in the Dow emerged the weaker dollar and lower yields in the belly and the long end of the curve.
That said, the Dow Jones gained 0.10% to 34,429, the S&P500 deflated 0.12% to 4,071 and the tech-reference Nasdaq Composite dropped 0.18% to 11,461.
The Dow Jones clinched a new December high at 34,595 (December 1) and the break above this level could pave the way for a potential test of the April top at 35,492 prior to the February peak at 35,824 (February 9). On the contrary, bears are expected to meet initial contention at the weekly low at 33,585 (November 30) just ahead of the weekly low at 33,239 (November 17). The breakdown of this area exposes a deeper drop to the key 200-day SMA at 32,458 followed by the interim 100-day SMA at 31,974 and the November low at 31,727 (November 3). The daily RSI appeared stable around 66.
Top Performers: Boeing, Nike, Dow
Worst Performers: Salesforce Inc, Intel, Goldman Sachs
Resistance levels: 34,595 35,492 35,824 (4H chart)
Support levels: 33,583 33,239 32,478 (4H chart)
-638057635112654926.png)
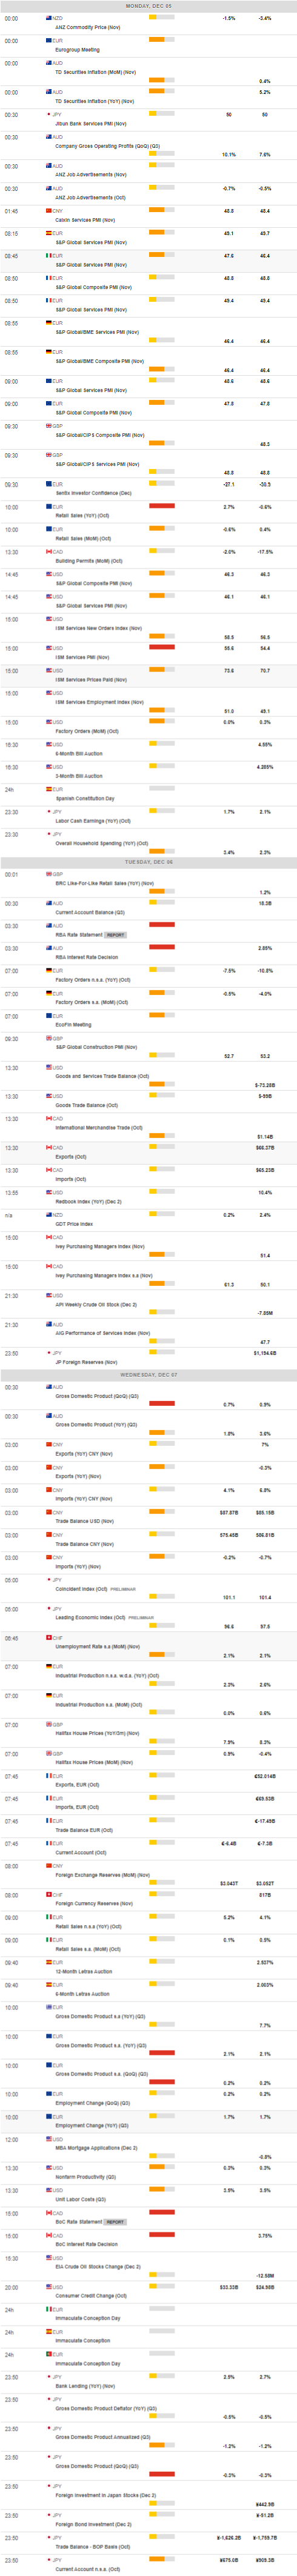
MACROECONOMIC EVENTS
All Information & Updates provided by:

All information relating to the financial markets available on this page has been prepared and issued by FXStreet (Forexstreet SL, Spain, Reg: B62498233) on the basis of publicly available information and all information believed to be reliable and does not conflict with Kuwaiti local laws, and all necessary care has been taken to before the company to ensure that the facts mentioned are correct from the source.
NCM Investment nor any of its directors or employees shall in any way be held responsible for the contents of this news, and the information contained on this page is intended only to provide clients with publicly available information and should not be construed as investment advice, report or analysis and/or constitute an offer or invitation to buy or sell financial instruments of any kind.
RISK WARNING: Forex and CFDs are highly risky leveraged products, as losses can exceed deposits. Please ensure you understand all the risks and take independent advice if necessary. NCM will segregate the clients based on the criteria of the regulator and its bylaws. NCM does not provide any advisory service; the material published does not constitute advice or a recommendation for a transaction in any financial instrument. NCM accepts no responsibility for any use of the content presented and any consequences of that use. Anyone acting on the information provided does so at their own risk.