
- Contact Us:
-

-

-

-


Daily Market Updates
06 Dec 2022
EURUSD
EUR/USD reached fresh tops in the 1.0580/85 band, extending at the same time the optimism seen in past sessions and revisiting an area last seen in late June just pips away from the 1.0600 barrier. The joy, however, was short-lived, as the data-led bounce in the dollar weighed on traders and dragged spot back to the sub-1.0500 region on Monday.
On the other side of the coin, the greenback started the week on the defensive just to make a solid U-turn following better-than-expected results in the US docket, which in turn motivated the USD Index (DXY) to reverse course markedly.
The downtick in the pair also came in line with the positive performance in US and German yields, as investors seem to have fully priced in a 50 bps rate hike at the Fed’s gathering on December 14, while speculation of a half-point rate hike by the ECB at the following day remained on the rise.
On the latter, ECB Board member Villeroy favoured a 50 bps rate hike and added that inflation should peak at some point in H1 2023 and that a recession in the region now appears unlikely.
In the euro calendar, final results saw Services PMI at 46.1 and 48.5 in Germany and the euro area, respectively, for the month of November; while Retail Sales in the Euroland contracted 1.8% MoM in October.
Across the pond, final Services PMI came at 46.2during last month, Factory Orders expanded 1.0% MoM in October and the key ISM Non-Manufacturing improved to 56.5 in November (from 54.4).
EUR/USD continues to target the weekly peak at 1.0614 (June 27) ahead of the June high at 1.0773 (June 9) and the May top at 1.0786 (May 30). On the contrary, there is an immediate support at the key 200-day SMA at 1.0362 ahead of the weekly low at 1.0290 (November 30) and another weekly low at 1.0222 (November 21). The breakdown of this level could open the door to a test of the provisional 100- and 55-day SMAs at 1.0052 and 1.0013, respectively, before the parity level and the 0.9935 level (November 10). The daily RSI came under pressure and retested the 65 zone.
Resistance levels: 1.0584 1.0614 1.0642 (4H chart)
Support levels: 1.0428 1.0290 1.0222 (4H chart)
-638058648795966573.png)
USDJPY
OriginalFinally, some respite for USD/JPY after the pair managed to set aside five consecutive daily pullbacks and advance strongly well past the 136.00 mark on Monday, up nearly 2% for the day.
The uptick in spot came on the back of robust gains in the dollar and a firm recovery in US yields across the curve, while expectations of a 50 bps interest rate by the Fed next week appear more consolidated.
In Japan, final readings saw the Jibun Bank Services PMI at 50.3 for the month of November (from 53.2).
Despite the daily bounce, USD/JPY remains well under pressure and a drop below the December low at 133.61 (December 2) could open the door to a visit to the August low at 130.39 (August 2) ahead of the key round level at 130.00. Contrarily, the weekly peak at 139.89 (November 30) is expected to offer initial resistance prior to the interim 100-day SMA at 141.10 and the weekly high at 142.25 (November 21). The surpass of this level exposes the 55-day SMA at 143.92 before the weekly top at 148.84 (October 31) and the 2022 peak at 151.94 (October 21). The daily RSI bounced off the oversold territory and trespassed 36.
Resistance levels: 136.71 139.89 141.61 142.25 (4H chart)
Support levels: 133.61 132.55 131.73 (4H chart)
-638058649879062841.png)
GBPUSD
GBP/USD could not sustain further gains above the new high near 1.2345 at the beginning of the week and ended the session with strong well south of the 1.2200 yardstick at the beginning of the week.
The sharp recovery in the dollar coupled with some profit taking in the British pound seems to have been enough to drag Cable lower and halt at the same time three consecutive sessions with gains.
In the US calendar, New Car Sales expanded 23.5% in the year to November and the final S&P Global Services PMI came in at 48.8 during last month.
Next on the upside for GBP/USD emerges at the so far December top at 1.2344 (December 5) ahead of the weekly peak at 1.2405 (June 16). Beyond the latter, the next up barrier of note is seen at the May high at 1.2666 (May 27). On the other hand,
the key 200-day SMA at 1.2141 turns up first prior to the weekly low at 1.1900 (November 30) and the 100- and 55-day SMAs at 1.1656 and 1.1492, respectively. South from here appears the November low at 1.1142 (November 4) before the weekly low at 1.1059 (October 21). The daily RSI eased sharply below 63.
Resistance levels: 1.2344 1.2405 1.2599 (4H chart)
Support levels: 1.2133 1.1900 1.1778 (4H chart)
-638058649364037288.png)
AUDUSD
AUD/USD added to Friday’s retracement and revisited the area below 0.6700 on the back of the resumption of the buying interest in the greenback, particularly in response to better-than-expected US data.
In fact, the pair dropped to 3-day lows amidst mixed performance from the commodity complex, where copper prices and the iron ore retreated moderately.
In the meantime, the Aussie dollar is expected to remain under scrutiny in the next couple of sessions, as the RBA meets on December 6 and is expected to raise the OCR by 25 bps to 3.10%.
AUD/USD now looks under some downside pressure and further weakness could prompt the pair to test the provisional 100-day SMA at 0.6685 ahead of the weekly low at 0.6640 (November 29) and another weekly low at 0.6584 (November 21). The breach of this level could revisit the 55-day SMA at 0.6511 prior to the weekly low at 0.6386 (November 10). Alternatively, the December high at 0.6850 (December 5) aligns as the immediate up barrier seconded by the September top at 0.6916 (September 13), which appears underpinned by the key 200-day SMA (0.6919). Beyond this region comes the psychological 0.7000 mark closely followed by the weekly peak at 0.7008 (August 26) and the August high at 0.7136 (August 11). The daily RSI dropped further near the 54 level.
Resistance levels: 0.6850 0.6916 0.6956 (4H chart)
Support levels: 0.6697 0.6676 0.6640 (4H chart)
-638058650456168476.png)
GOLD
Prices of the ounce troy of gold dropped markedly at the beginning of the week, revisiting the $1,770/65 region on the back of the bout of strength in the dollar and higher US yields across the curve.
Indeed, the greenback left behind the initial inconclusive performance and edged higher after auspicious results from US fundamentals (ISM Non-Manufacturing and Factory Orders), which at the same time lent extra support to the idea that the Fed could keep the restrictive policy for longer in order to tame inflation.
By the same token, US yields rose across the curve, encouraging the belly and the long end to leave behind part of the recent weakness.
In case sellers regain the initiative, gold is expected to meet the initial support at the weekly low at $1,732 (November 21) prior to the provisional 100- and 55-day SMAs at $1,715and $1,696, respectively. The breach of this region could put a drop to the 2022 low at $1,614 (September 28) back on the traders’ radar ahead of the round level at $1,600. In the opposite direction, the December top at $1,810 (December 5) should offer initial resistance before the June high at $1,879 (June 13) and the May top at $1,909 (May 5).
Resistance levels: $1,807 $1,810 $1,814 (4H chart)
Support levels: $1,765 $1,744 $1,739 (4H chart)
-638058650969603135.png)
CRUDE WTI
Prices of the WTI retreated to 3-day lows south of the $78.00 mark per barrel at the beginning of the week, adding to Friday’s pullback and extending further the rejection from last week’s peaks past the $83.00 yardstick.
Indeed, the commodity left behind the initial optimism following the dynamics around the recent EU cap on prices of Russian crude oil, giving way instead to renewed recession concerns in response to solid readings from the US services and manufacturing sectors, all morphing into further speculation that the Fed might not enter any impasse in the next months.
The strong rebound in the dollar in the wake of those data releases was enough to put prices of the WTI to the test and spark a deeper correction on Monday.
Further weakness in prices of the WTI could well revisit the 2022 low at $73.62 (November 28) ahead of the round level at $70.00 and the weekly low at $66.15 (December 20 2021). Down from here should come the December 2021 low at $62.46 (December 2). Just the opposite, the next up barrier emerges at the December top at $83.32 (December 1) followed by interim hurdles at the 55- and 100-day SMAs at $84.41 and $87.43, respectively, before the $90.08 level (November 11) and the November top at $93.73. Once cleared, further recovery could then target the 200-day SMA at $97.48 seconded by the weekly high at $97.65 (August 30) and the psychological $100.00 mark per barrel.
Resistance levels: $83.32 $84.42 $88.65 (4H chart)
Support levels: $77.52 $73.59 $72.55 (4H chart)
-638058652339319075.png)
DOW JONES
The three main US stock indices started the week on the back foot and extended the so far monthly decline to new 3-day lows on Monday.
This time, US equities suffered the strong bounce in the dollar and higher US yields, while investors’ sentiment soured after results from the US docket hinted at the idea that the Fed might keep the hiking cycle well in place for longer.
All in all, the Dow Jones retreated 1.32% to 33,981, the S&P500 dropped 1.71% to 4,002 and the tech-heavy Nasdaq Composite deflated 1.60% to 11,277.
Next on the downside in case the retracement in the Dow Jones gathers further impulse emerges the weekly low at 33,585 (November 30) prior to the weekly low at 33,239 (November 17). The breach of the latter could see the key 200-day SMA at 32,457 revisited before the temporary 100-day SMA at 32,007 and the November low at 31,727 (November 3). On the flip side, the December top at 34,595 (December 1) comes first before the April peak at 35,492 and the February high at 35,824 (February 9). The daily RSI ticked lower to the 58 region.
Top Performers: Boeing, Amgen, American Express
Worst Performers: Salesforce Inc, Verizon, JP Morgan
Resistance levels: 34,595 35,492 35,824 (4H chart)
Support levels: 33,583 33,239 32,478 (4H chart)
-638058652782333593.png)
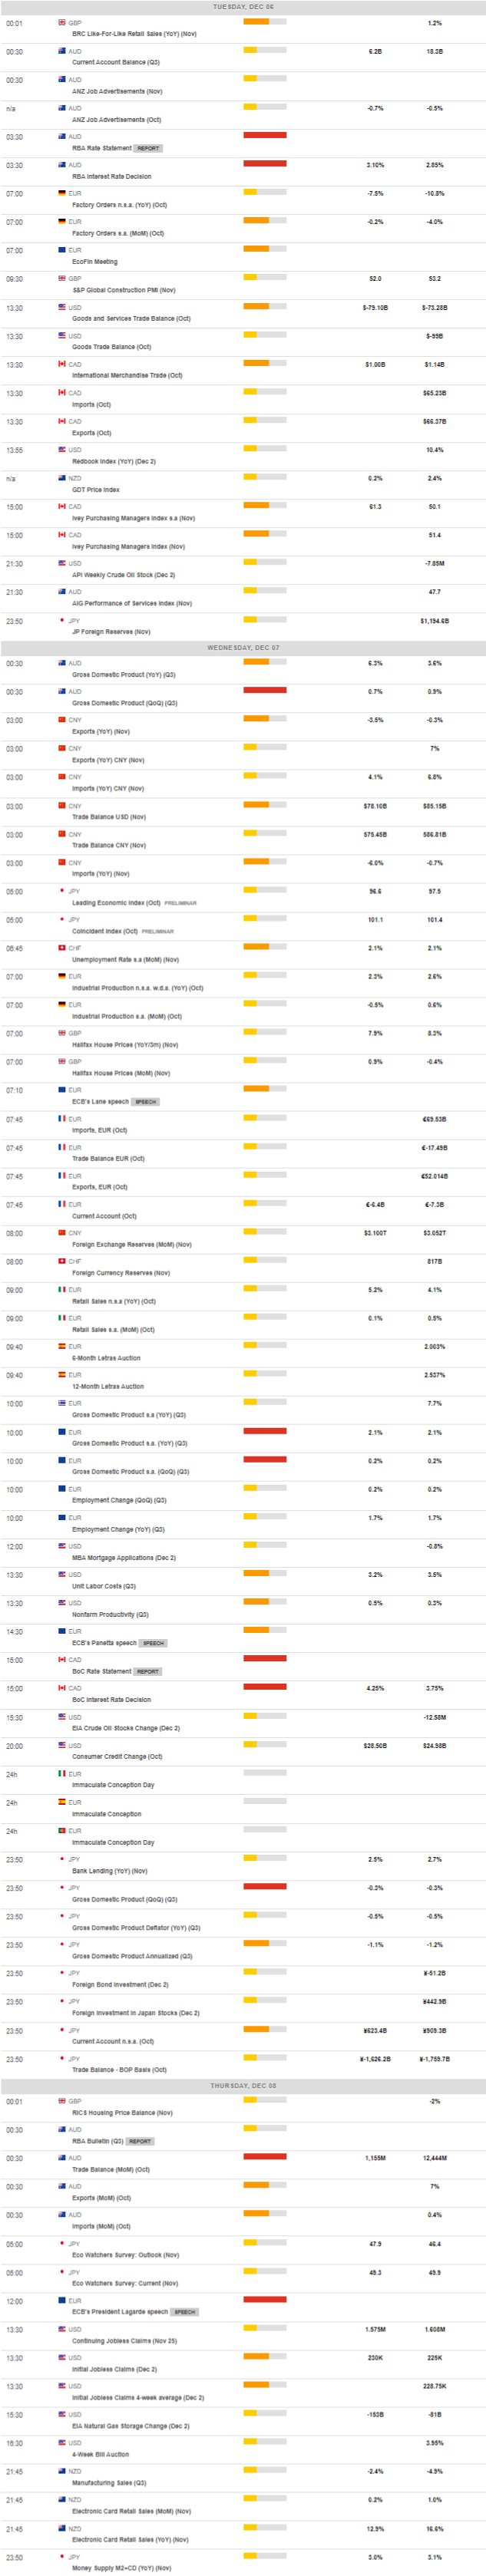
MACROECONOMIC EVENTS
All Information & Updates provided by:

All information relating to the financial markets available on this page has been prepared and issued by FXStreet (Forexstreet SL, Spain, Reg: B62498233) on the basis of publicly available information and all information believed to be reliable and does not conflict with Kuwaiti local laws, and all necessary care has been taken to before the company to ensure that the facts mentioned are correct from the source.
NCM Investment nor any of its directors or employees shall in any way be held responsible for the contents of this news, and the information contained on this page is intended only to provide clients with publicly available information and should not be construed as investment advice, report or analysis and/or constitute an offer or invitation to buy or sell financial instruments of any kind.
RISK WARNING: Forex and CFDs are highly risky leveraged products, as losses can exceed deposits. Please ensure you understand all the risks and take independent advice if necessary. NCM will segregate the clients based on the criteria of the regulator and its bylaws. NCM does not provide any advisory service; the material published does not constitute advice or a recommendation for a transaction in any financial instrument. NCM accepts no responsibility for any use of the content presented and any consequences of that use. Anyone acting on the information provided does so at their own risk.