
- Contact Us:
-

-

-

-


Daily Market Updates
07 Dec 2022
EURUSD
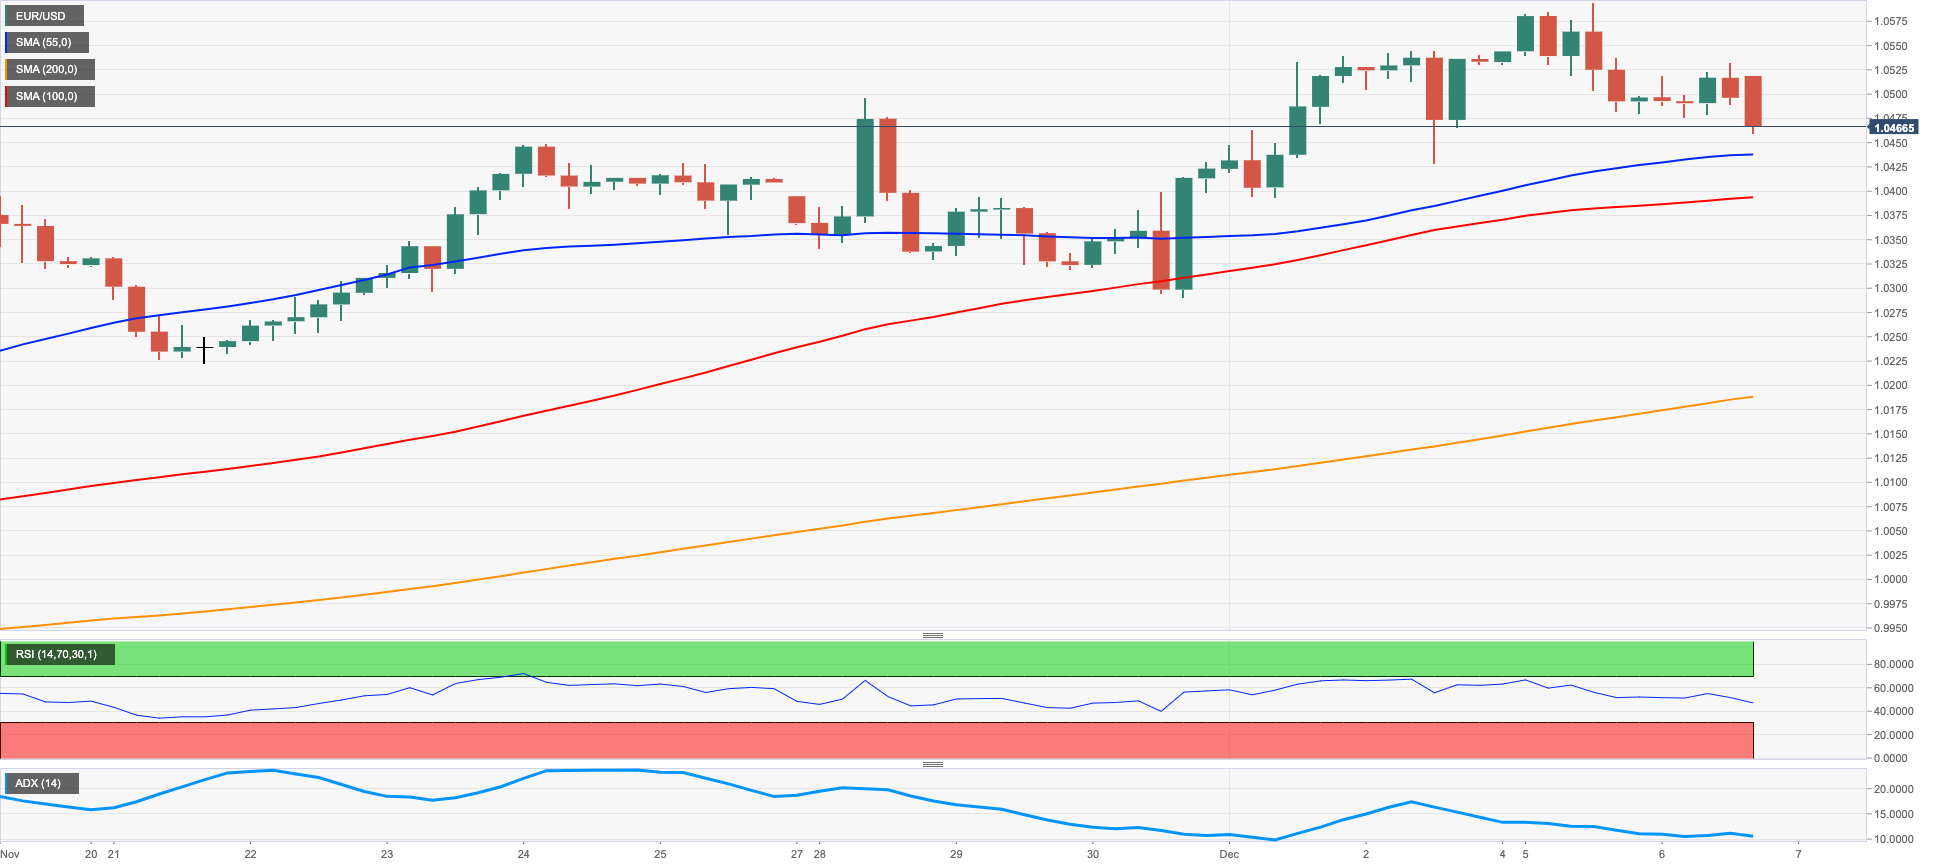
EUR/USD added to Monday’s decline and dropped to new 2-day lows in the proximity of the 1.0460 region on Tuesday, quickly fading the earlier climb to the 1.0530/35 band.
The continuation of the buying pressure around the greenback was behind the second consecutive daily retracement in the pair, as the USD Index (DXY) once again staged a marked comeback just after the European midday.
In addition, the decline in yields on both sides of the Atlantic accompanied the pullback in the pair amidst the most likely 50 bps interest rate hike by both the Federal Reserve and the ECB on December 14th and 15th, respectively.
As the Fed’s blackout period kept Fed speakers silent on Tuesday, on the ECB’s front Board member Herodotou suggested that further rate hikes are coming and hinted at the view the rates are very close to the terminal level. He also ruled out a hard landing in the region’s economy.
In the euro calendar, Germany’s Construction PMI eased to 41.5 in November (from 43.8) in what was the sole release on Tuesday.
Across the pond, Balance of Trade figures showed the deficit widened to $78.2B in October.
In case bulls regain the upper hand, EUR/USD is expected to revisit the December peak at 1.0594 (December 5) prior to the weekly high at 1.0614 (June 27). North of the latter comes the June top at 1.0773 (June 9) followed by the May peak at 1.0786 (May 30). On the flip side, the key 200-day SMA at 1.0358 should hold the initial downside prior to the weekly low at 1.0290 (November 30) and another weekly low at 1.0222 (November 21). South of this region emerges the temporary 100- and 55-day SMAs at 1.0054 and 1.0022, respectively, all ahead of the parity level. The daily RSI deflated to the vicinity of the 62 zone.
Resistance levels: 1.0532 1.0594 1.0614 (4H chart)
Support levels: 1.0463 1.0428 1.0392 (4H chart)
USDJPY
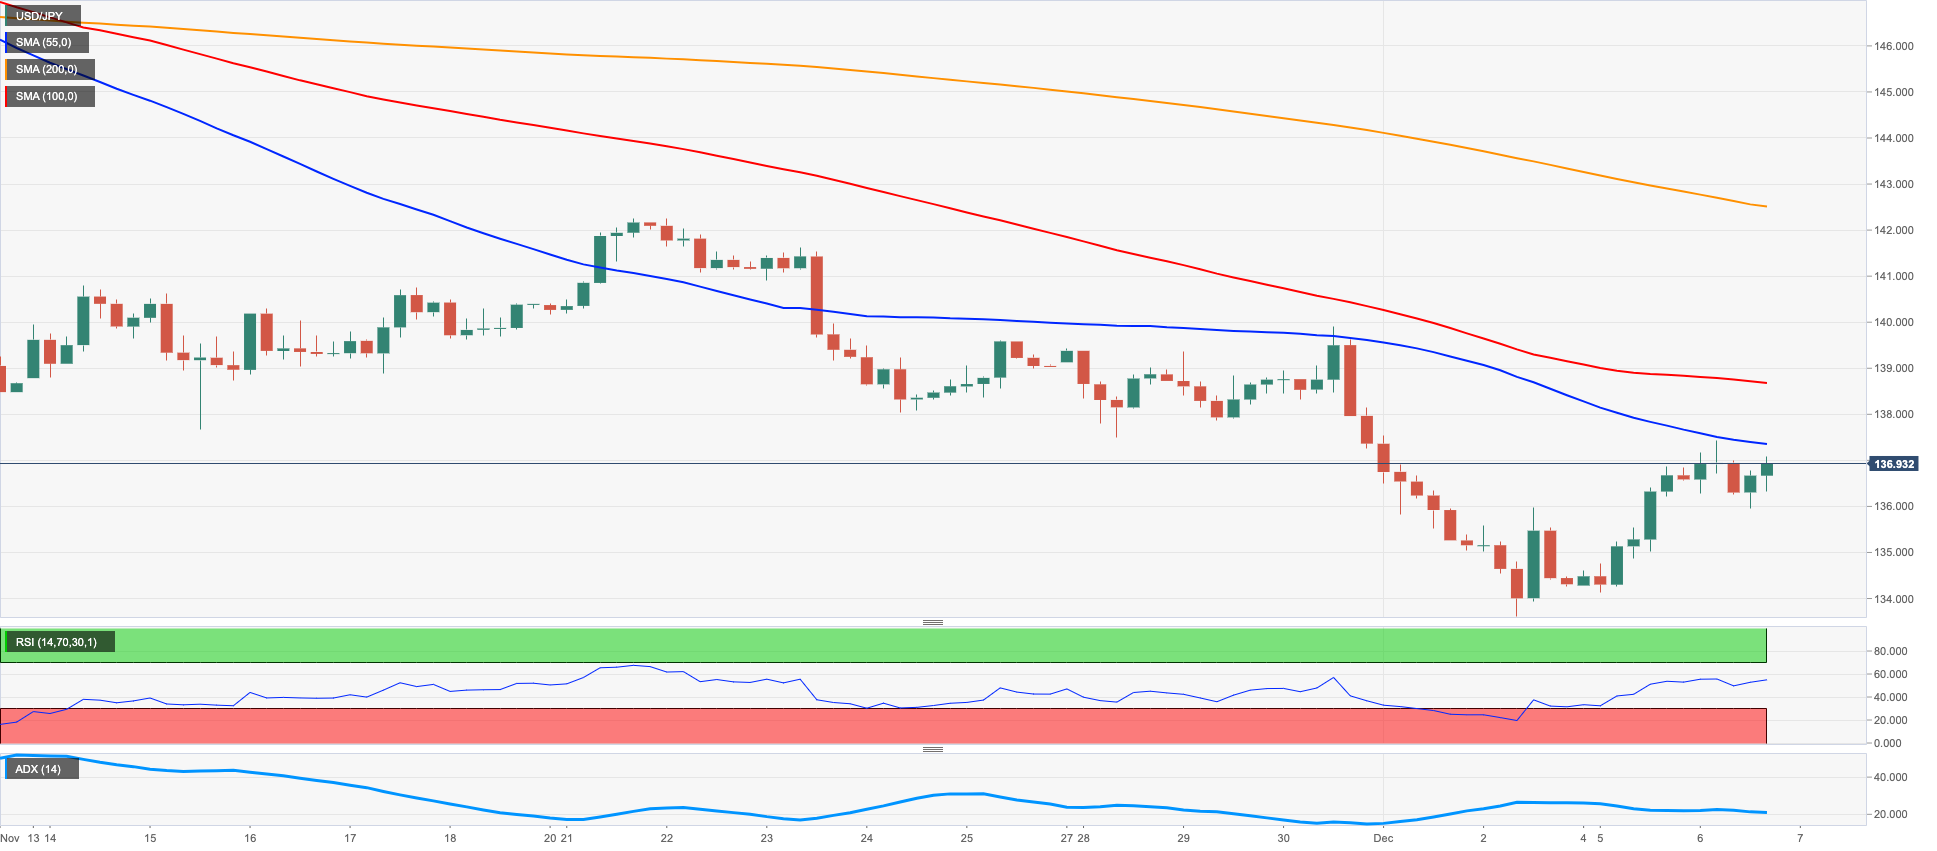
The second straight daily advance in the dollar encouraged bulls to return to the market, motivating USD/JPY to climb to 3-day highs past 137.40 on Tuesday.
Indeed, the pair charted decent gains in tandem with the move higher in the greenback and managed to bypass a mild retracement in US yields across the curve.
In Japan, the only scheduled release saw Household Spending expand at an annualized 1.2% in October.
USD/JPY still risks further losses in the near term. That said, the next support of note is expected at the December low at 133.61 (December 2) prior to the August low at 130.39 (August 2) and just ahead of the key round level at 130.00. On the other hand, there is an immediate resistance at the weekly high at 139.89 (November 30) seconded by the round level at 140.00 and the provisional 100-day SMA at 141.09. The surpass of this region paves the way for a move to the weekly top at 142.25 (November 21) ahead of the 55-day SMA at 143.81 and the weekly peak at 148.84 (October 31). The latter precedes the 2022 high at 151.94 (October 21). The daily RSI climbed slightly to the 38 region.
Resistance levels: 137.42 139.89 141.61 (4H chart)
Support levels: 135.96 133.61 132.55 (4H chart)
GBPUSD
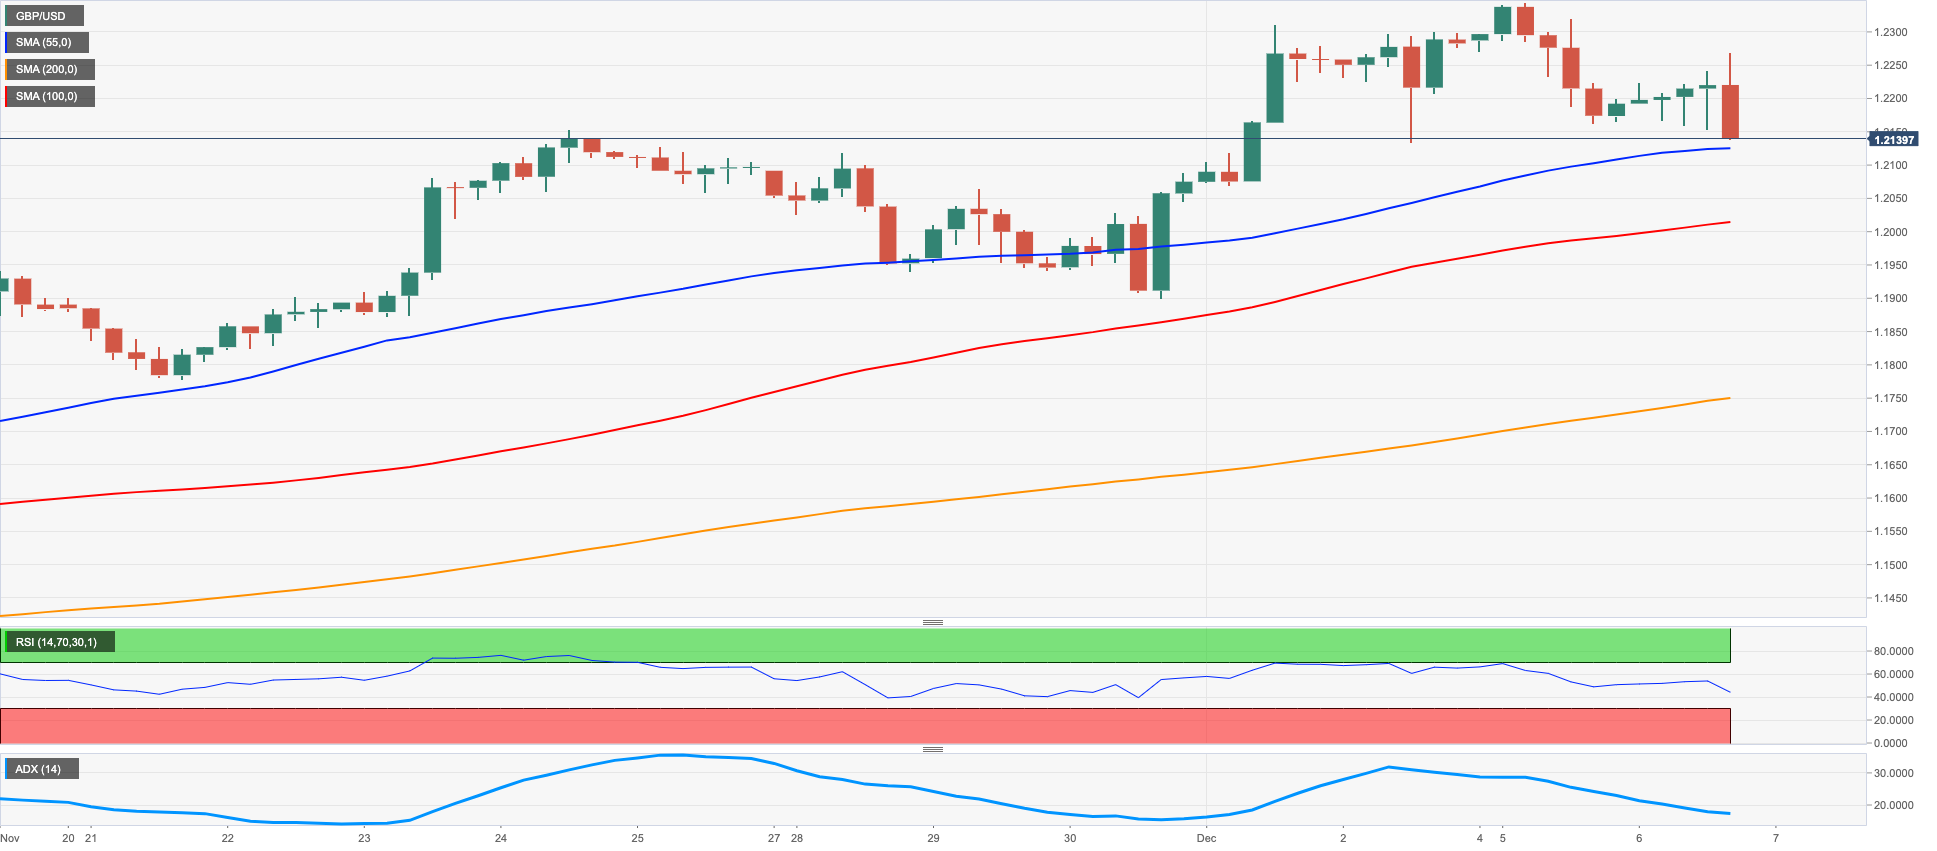
GBP/USD failed to sustain an earlier advance to the 1.2270 region, succumbing afterwards to another bounce in the greenback on Tuesday.
Indeed, the bid bias in the buck motivated the USD Index (DXY) to extend the positive momentum after Monday’s strong rebound, all despite the poor performance of US yields.
Data wise in the UK, the BRC Retail Sales Monitor expanded 4.1% in the year to November and the Construction PMI receded to 50.4 in the same month (from 53.2).
The continuation of the uptrend in GBP/USD needs to leave behind the December peak at 1.2344 (December 5) to allow for a potential visit to the weekly high at 1.2405 (June 16) in the near term. Once cleared, Cable could attempt to retest the May top at 1.2666 (May 27) ahead of the psychological 1.3000 hurdle. On the contrary, significant contention turns up at the 200-day SMA at 1.2134 ahead of the weekly low at 1.1900 (November 30) and the 100- and 55-day SMAs at 1.1657 and 1.1505, respectively. A deeper drop could then put a test of the November low at 1.1142 (November 4) back on the investors’ radar before the weekly low at 1.1059 (October 21). The daily RSI broke below the 61 mark.
Resistance levels: 1.2241 1.2344 1.2405 (4H chart)
Support levels: 1.2140 1.2133 1.1900 (4H chart)
AUDUSD
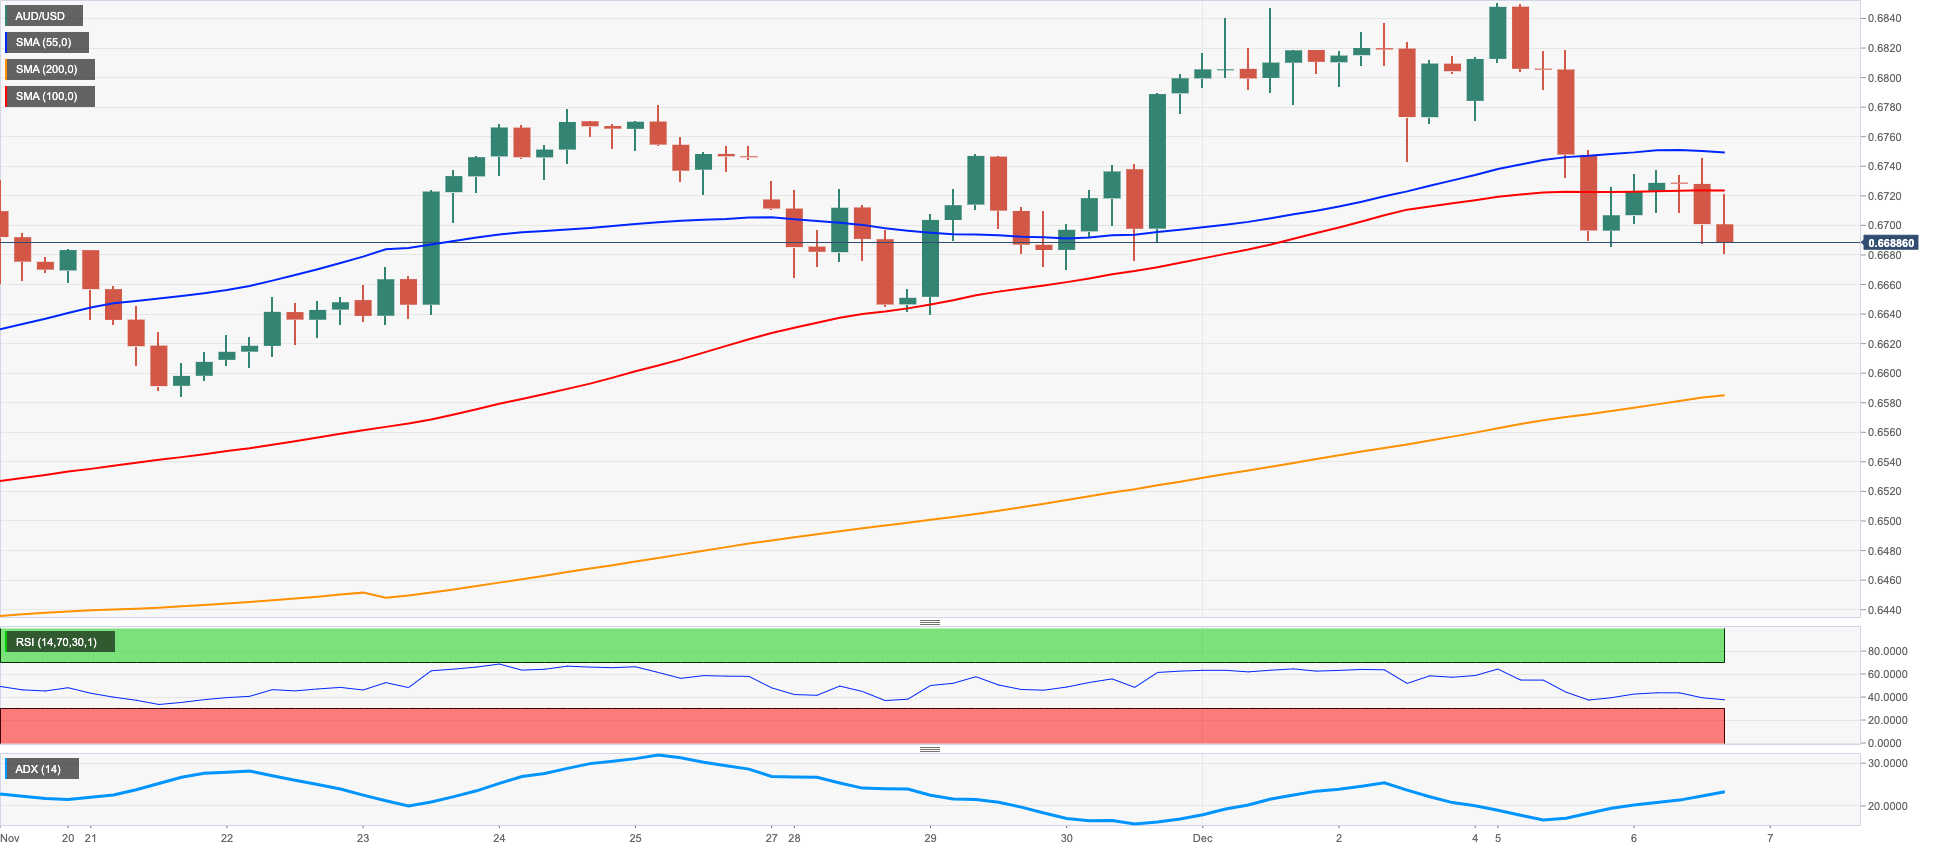
AUD/USD shed ground for the third session in a row and probed multi-session lows in the 0.6680 zone on Tuesday, an area coincident with the 100-day SMA.
The daily drop in the pair came in line with extra buying pressure around the buck, while mixed developments from the commodity complex also put the Aussie dollar to the test. On this, copper prices faded the pessimism seen at the beginning of the week and the iron ore approached the $110.00 mark per tonne, also setting aside Monday’s small decline.
There was no news from the RBA after it raised the OCR by 25 bps to 3.10% as widely anticipated. In the statement, the central bank suggested that further decisions on the interest rate will depend on data. While the Board sees further rate raises in the next period, these are not on a pre-set course.
In case the recovery regains traction, AUD/USD should meet the next up barrier at the December top at 0.6850 (December 5) prior to the September peak at 0.6916 (September 13). The latter coincides with the key 200-day SMA and precedes the psychological 0.7000 mark. Beyond the latter comes the weekly high at 0.7008 (August 26) followed by the August top at 0.7136 (August 11). Contrarily, there is a minor support at the weekly low at 0.6640 (November 29) ahead of another weekly low at 0.6584 (November 21). The loss of this level could spark further weakness to the 55-day SMA at 0.6511 ahead of the weekly low at 0.6386 (November 10). The daily RSI slipped back to the 53 region.
Resistance levels: 0.6744 0.6850 0.6916 (4H chart)
Support levels: 0.6680 0.6676 0.6640 (4H chart)
GOLD
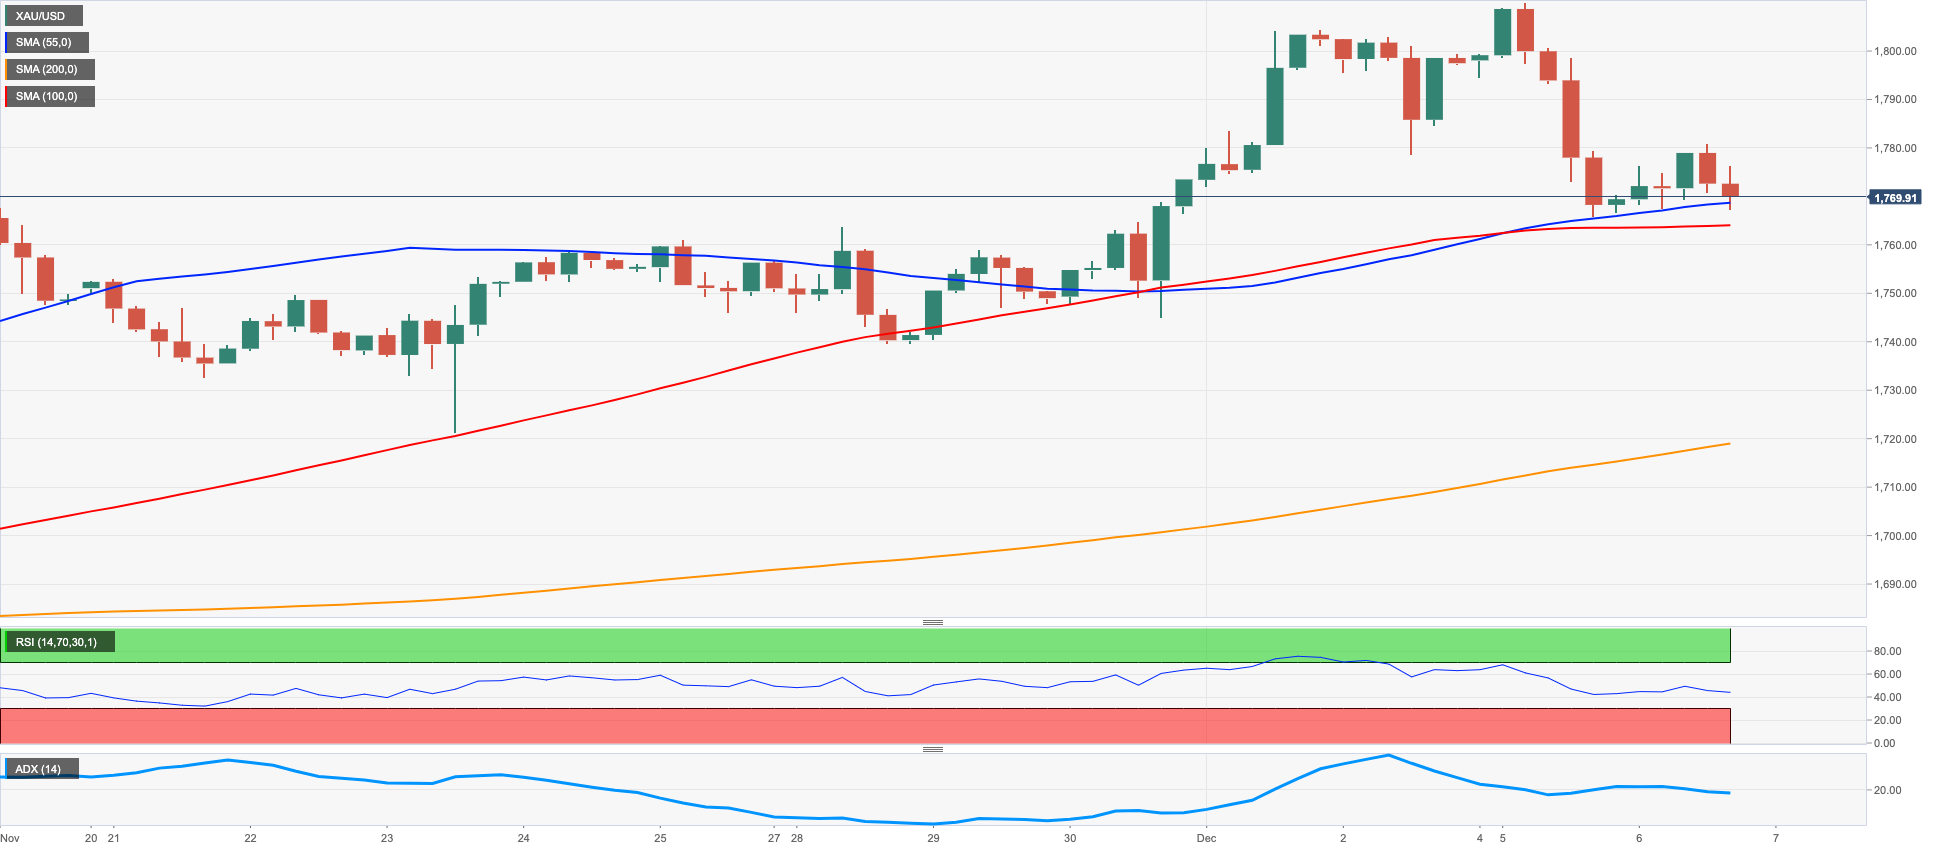
Gold prices advanced modestly on Tuesday, although it seems to have been enough to offset two daily pullbacks in a row and keep business around the $1,770 region per ounce troy.
Once again, the late recovery in the greenback forced bullion to give away part of the earlier gains, while the absence of traction in US yields somewhat moderated the corrective knee-jerk.
The precious metal, in the meantime, remains exposed to the ongoing up & downs surrounding the next steps by the Fed when it comes to the continuation of the normalization process. So far, a 50 bps rate raise at the December 14 event remains the most likely scenario among investors, with nearly 80% probability according to CME Group’s FedWatch Tool.
Further upside in prices of the yellow metal is expected to meet the next hurdle at the 200-day SMA at $1,794 just ahead of the December peak at $1,810 (December 5). If gold leaves behind this level, it could prompt a test of the June top at $1,879 (June 13) to emerge on the horizon prior to the May peak at $1,909 (May 5). Alternatively, the weekly low at $1,732 (November 21) should hold the initial downside test before the temporary 100- and 55-day SMAs at $1,715 and $1,698, respectively. The loss of the latte could open the door to the 2022 low at $1,614 (September 28) prior to the round level at $1,600.
Resistance levels: $1,807 $1,810 $1,814 (4H chart)
Support levels: $1,765 $1,744 $1,739 (4H chart)
CRUDE WTI
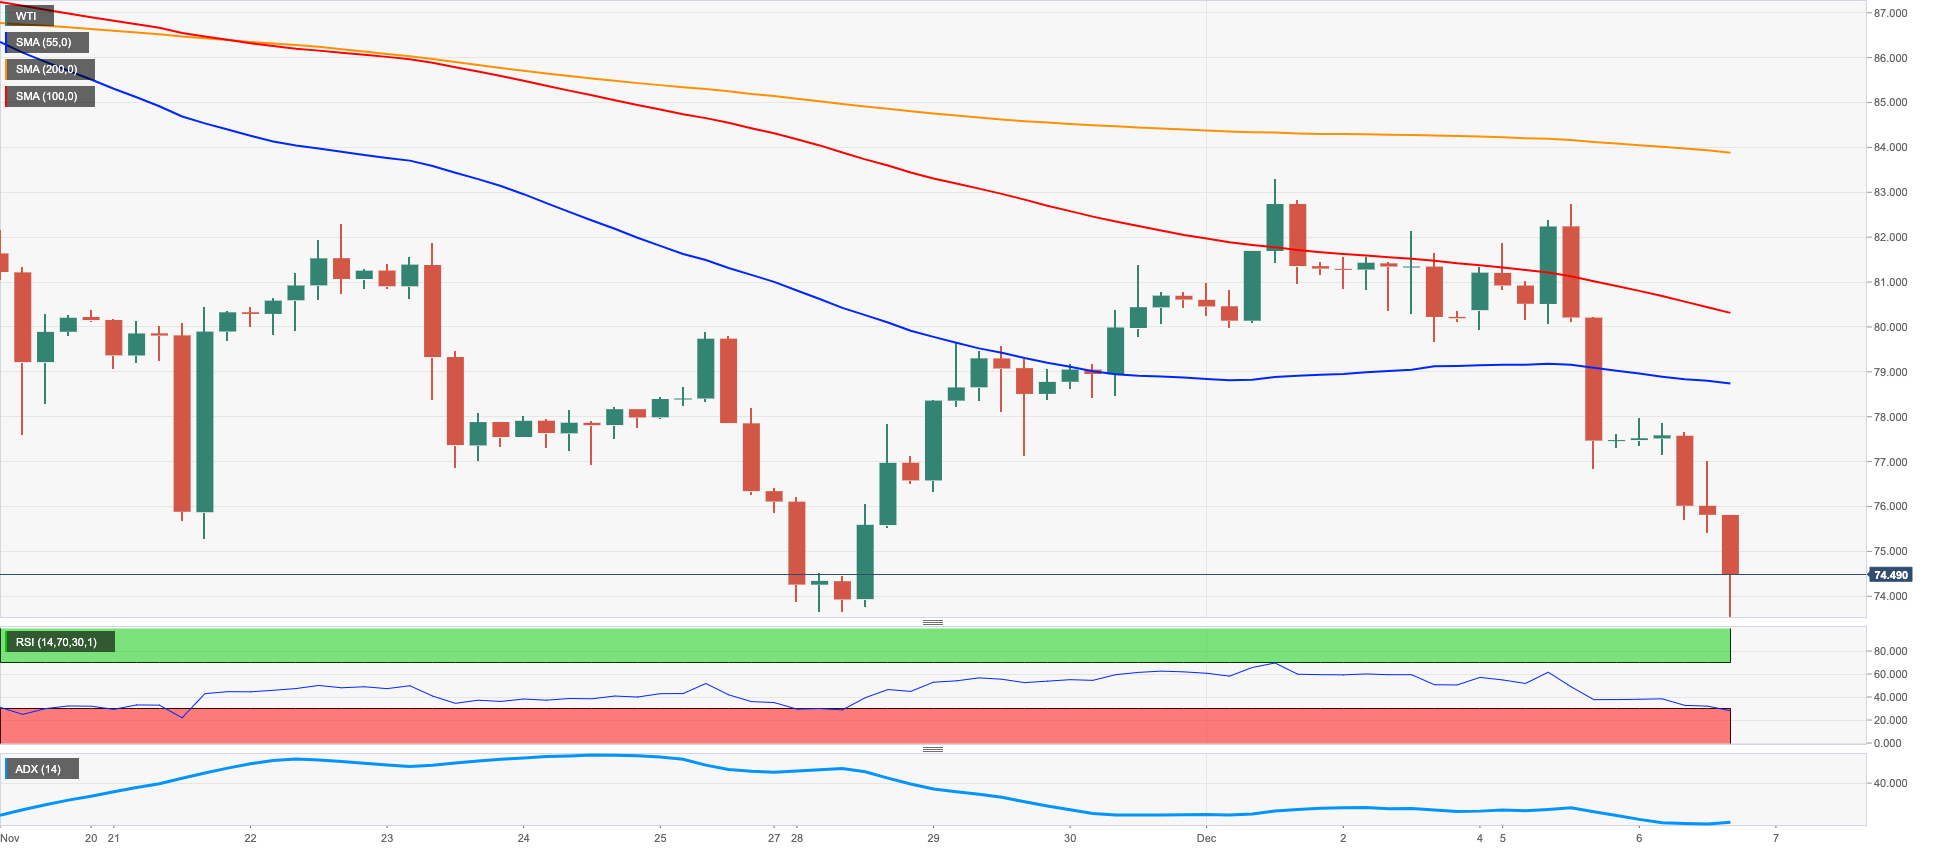
Prices of the American benchmark for the sweet light crude oil retreated for the third session in a row and revisited levels last seen back in late December 2021 on turnaround Tuesday.
Indeed, renewed concerns around the likelihood of a global slowdown weighed on traders and set aside bullish signals from the EU/G7 price cap on Russian crude oil as well as curbing COVID restrictions in China, which should bode well when it comes to demand prospects.
Also adding to the sour sentiment in the commodity appeared another late rebound in the dollar, always underpinned by speculation of a tighter-for-longer stance from the Fed.
Later in the NA session, the American Petroleum Institute will report on US crude oil supplies in the week to December 2.
If sellers remain in control, the WTI appears en route to challenge the round level at $70.00 prior to the weekly low at $66.15 (December 20 2021) and the December 2021 low at $62.46 (December 2). By contrast, there is a minor hurdle at the $80.00 mark per barrel ahead of the December peak at $83.32 (December 1). Once cleared, the WTI could attempt a move to the 55- and 100-day SMAs at $84.21 and $87.12, respectively, ahead of the $90.08 level (November 11) and the November peak at $93.73. Further up turns up the 200-day SMA at $97.37 ahead of the weekly top at $97.65 (August 30) and the psychological $100.00 mark per barrel.
Resistance levels: $82.70 $83.32 $84.42 (4H chart)
Support levels: $73.44 $72.55 $70.79 (4H chart)
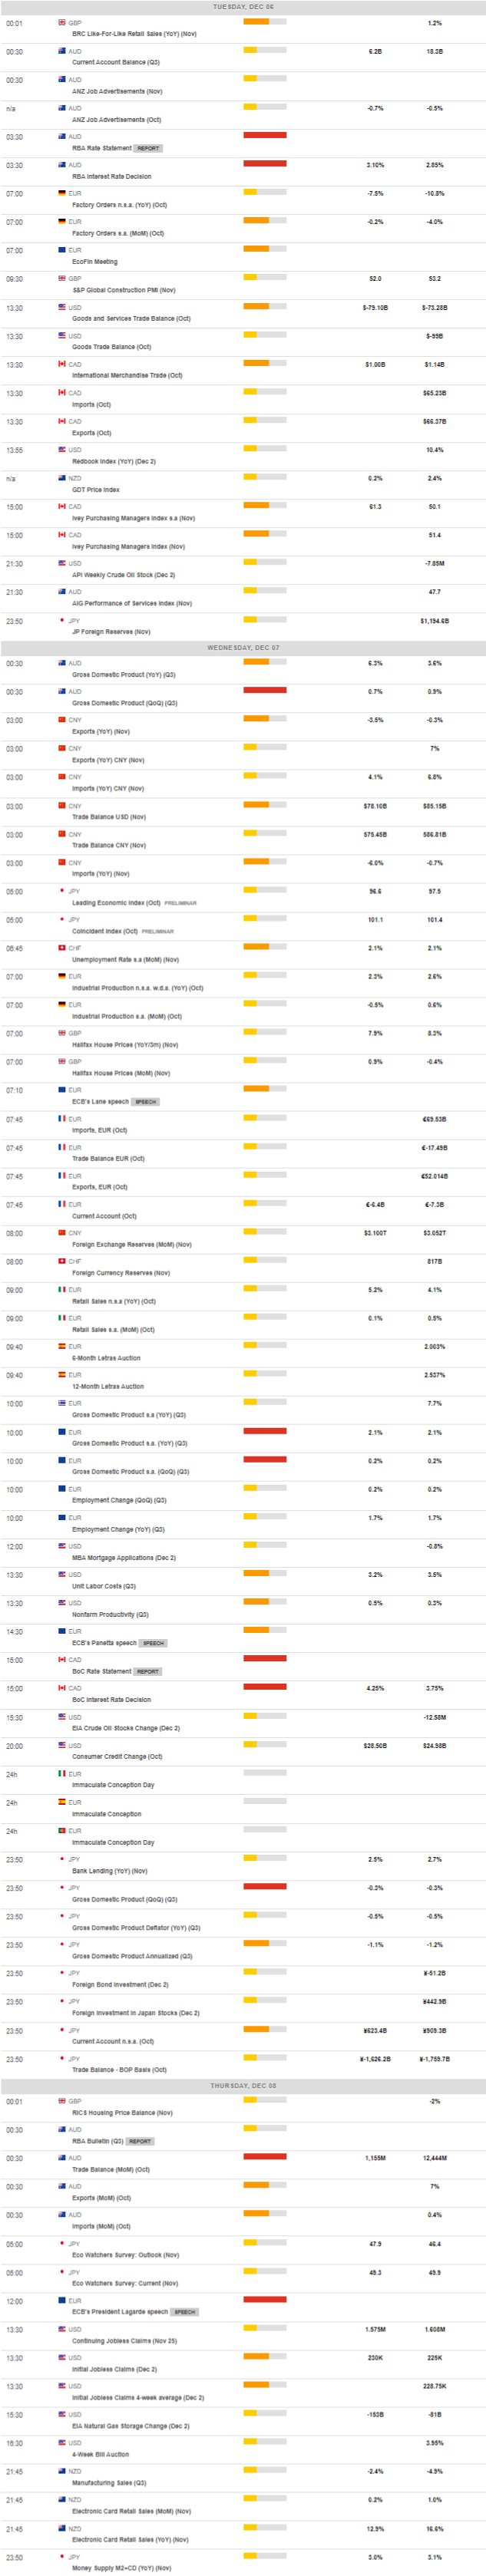
MACROECONOMIC EVENTS
All Information & Updates provided by:

All information relating to the financial markets available on this page has been prepared and issued by FXStreet (Forexstreet SL, Spain, Reg: B62498233) on the basis of publicly available information and all information believed to be reliable and does not conflict with Kuwaiti local laws, and all necessary care has been taken to before the company to ensure that the facts mentioned are correct from the source.
NCM Investment nor any of its directors or employees shall in any way be held responsible for the contents of this news, and the information contained on this page is intended only to provide clients with publicly available information and should not be construed as investment advice, report or analysis and/or constitute an offer or invitation to buy or sell financial instruments of any kind.
RISK WARNING: Forex and CFDs are highly risky leveraged products, as losses can exceed deposits. Please ensure you understand all the risks and take independent advice if necessary. NCM will segregate the clients based on the criteria of the regulator and its bylaws. NCM does not provide any advisory service; the material published does not constitute advice or a recommendation for a transaction in any financial instrument. NCM accepts no responsibility for any use of the content presented and any consequences of that use. Anyone acting on the information provided does so at their own risk.