
- Contact Us:
-

-

-

-


Daily Market Updates
08 Dec 2022
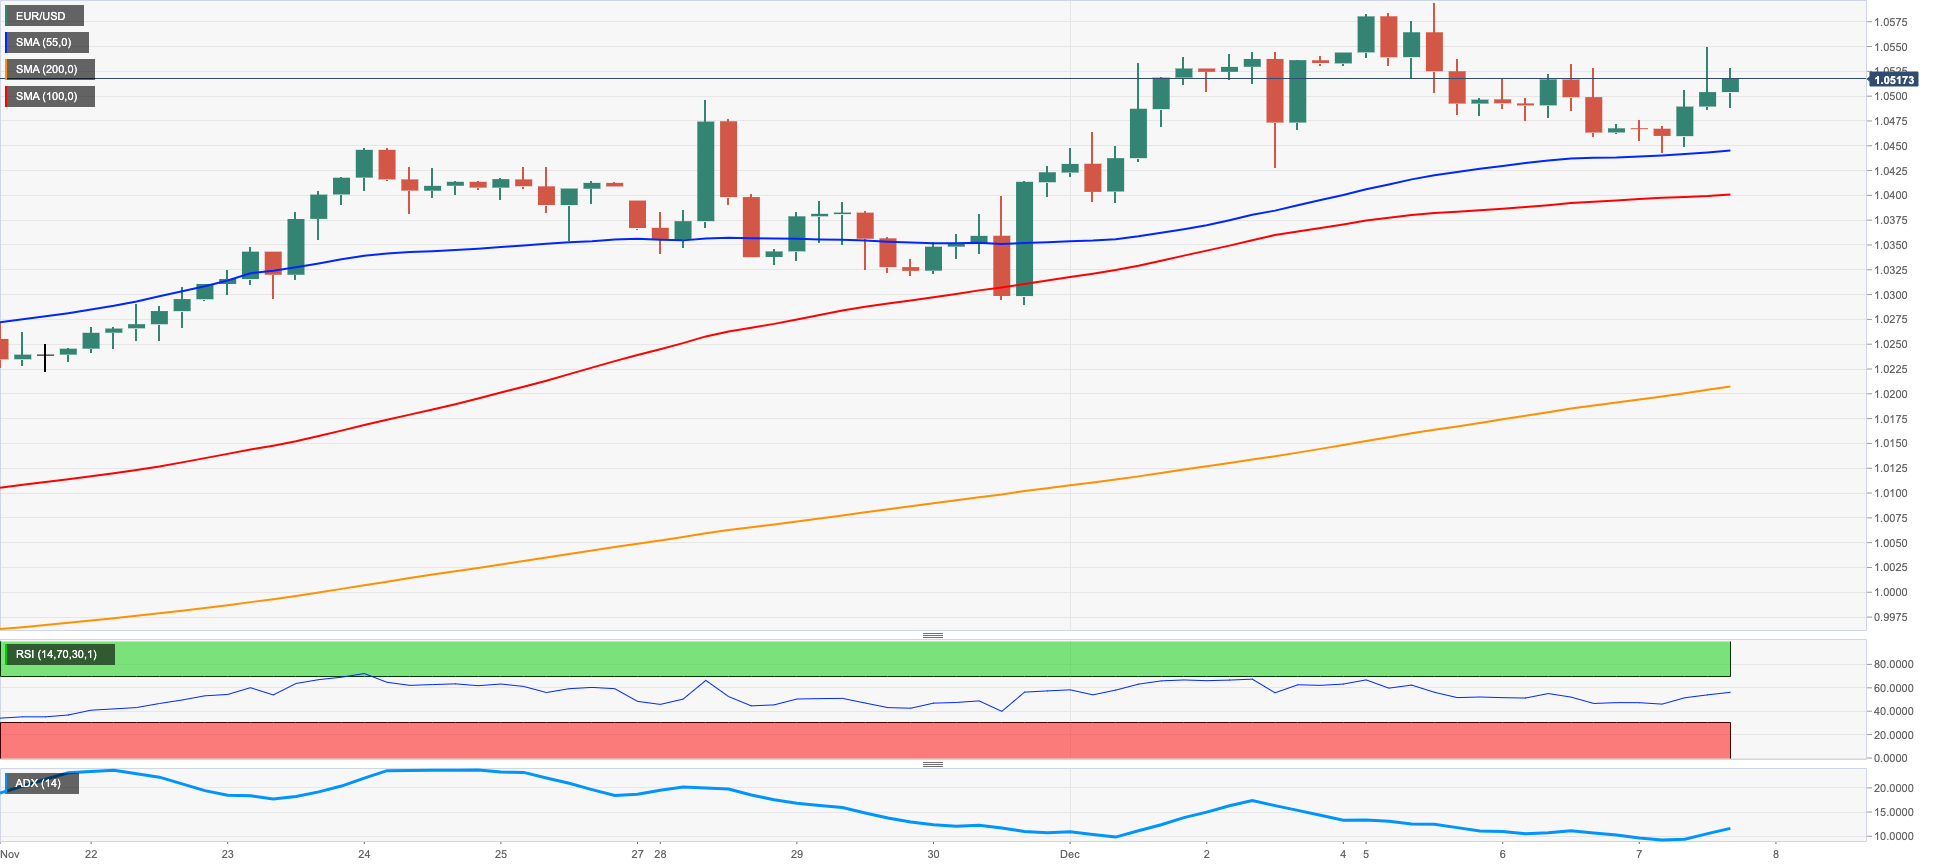
EURUSD
Following two consecutive daily pullbacks, EUR/USD advanced markedly and surpassed the 1.0500 mark on Wednesday on the back of a noticeable improvement in the sentiment around the risk complex, mainly in response to news of a reopening in China after easing the zero-COVID policy.
Against the backdrop of the prevailing risk-on mood, the corrective decline in the greenback forced the USD Index (DXY) to recede part of the recent gains after a failed attempt to advance north of the critical 200-day SMA, today at 105.67.
No news from the German and US money markets, where yields traded in a negative fashion amidst the prevailing multi-session consolidative theme.
In the domestic docket, Industrial Production in Germany contracted at a monthly 0.1% and another revision of Q3 GDP Growth Rate in the broader Euroland showed the economy is expected to have expanded 0.3% QoQ and 2.3% YoY, both prints surprising to the upside.
Across the pond, MBA Mortgage Applications contracted 1.9% in the week to December 2.
The rebound in EUR/USD appears under way and should meet the next up barrier at the December high at 1.0594 (December 5) ahead of the weekly top at 1.0614 (June 27). Once cleared, there are no resistance levels of note until the June peak at 1.0773 (June 9) and the May high at 1.0786 (May 30). Just the opposite, there is immediate contention at the key 200-day SMA at 1.0355 ahead of the weekly low at 1.0290 (November 30) and another weekly low at 1.0222 (November 21). The loss of the latter exposes a test of the provisional 100- and 55-day SMAs at 1.0057 and 1.0034, respectively, before the critical parity level. The daily RSI bounced to the area near 65.
Resistance levels: 1.0549 1.0594 1.0614 (4H chart)
Support levels: 1.0443 1.0428 1.0392 (4H chart)
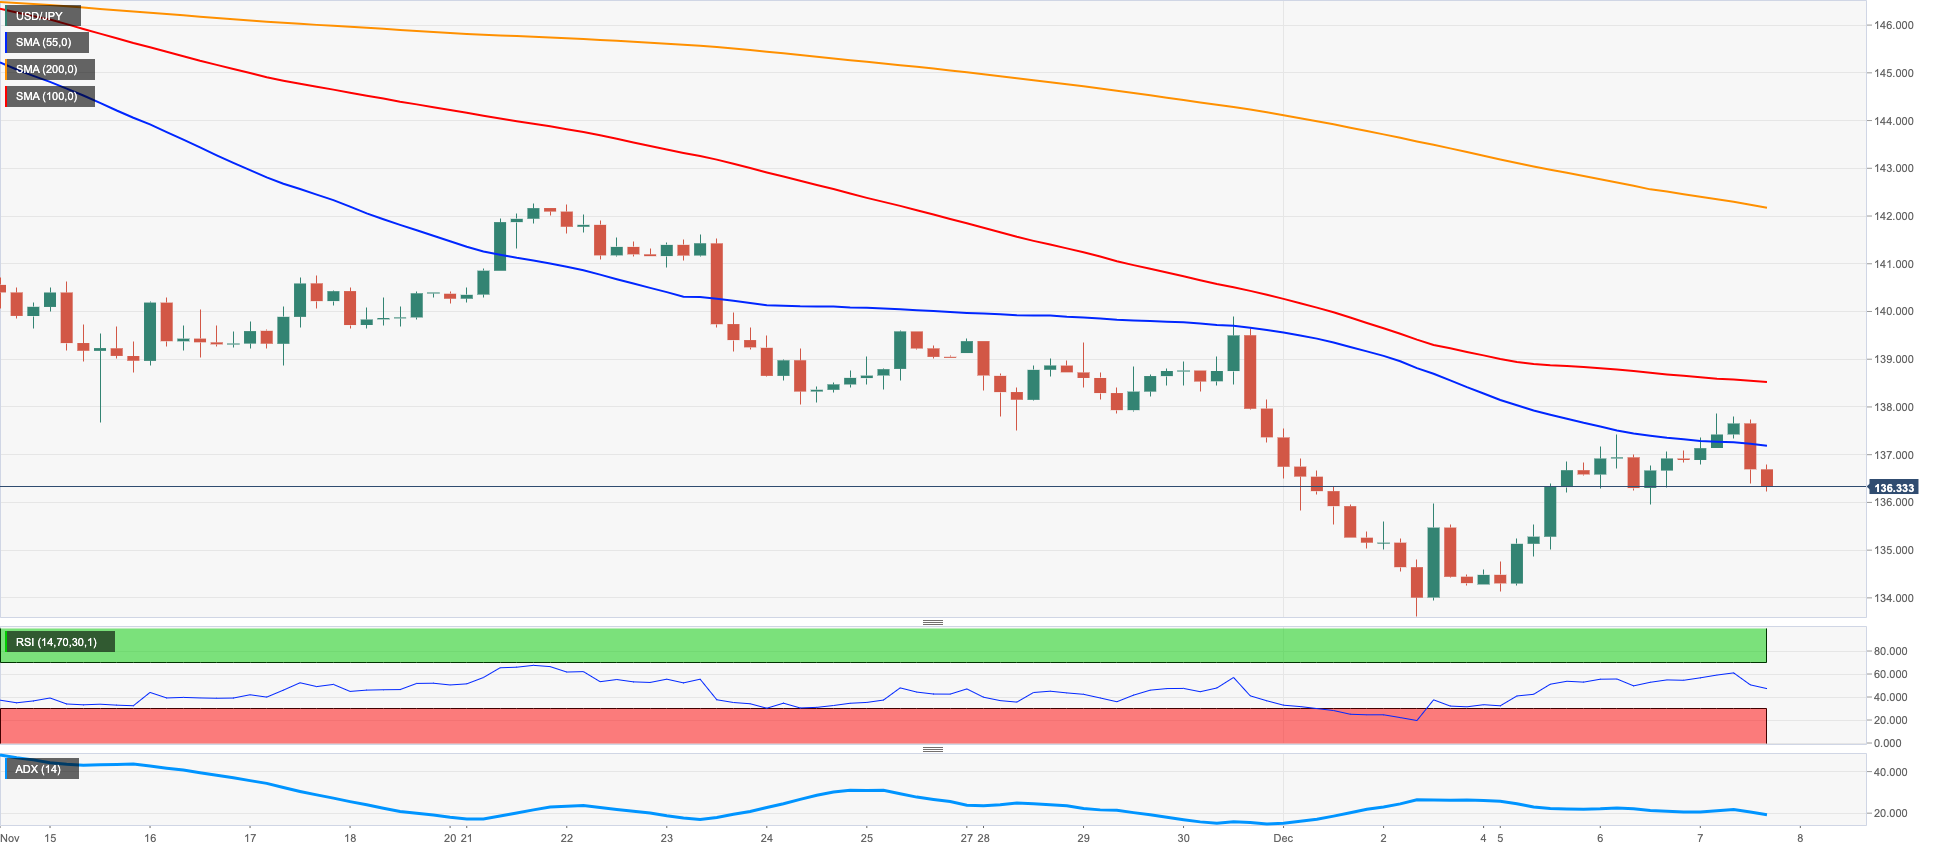
USDJPY
USD/JPY faltered ahead of the 138.00 mark and sparked a corrective move pari passu with the intense sell-off in the greenback and another negative session in US yields.
Certainly, the greenback suffered the better tone in the risk-associated universe, which was in turn supported by auspicious news from China, while US yields extended the negative performance across the curve.
From the BoJ, Board member Nakamura said the economy is still recovering from the pandemic and added that tightening could reintroduce deflation.
In the Japanese calendar, the Reuters Tankan Index improved to 8 in December (from 2) and preliminary readings saw the Leading Economic Index at 99.0 and the Coincident Index at 99.9, both for the month of October.
USD/JPY keeps the next down barrier at the 200-day SMA at 134.81 seconded by the December low at 133.61 (December 2). Next on the downside aligns the August low at 130.39 (August 2) prior to the key round level at 130.00. On the contrary, the so far weekly high at 137.85 emerges as the next hurdle followed by another weekly top at 139.89 (November 30). If the pair leaves this level behind it could then confront the round level at 140.00 seconded by the provisional 100-day SMA at 141.08 and the weekly peak at 142.25 (November 21). The daily RSI deflated marginally to the 36 area.
Resistance levels: 137.85 139.89 141.61 (4H chart)
Support levels: 135.96 133.61 132.55 (4H chart)
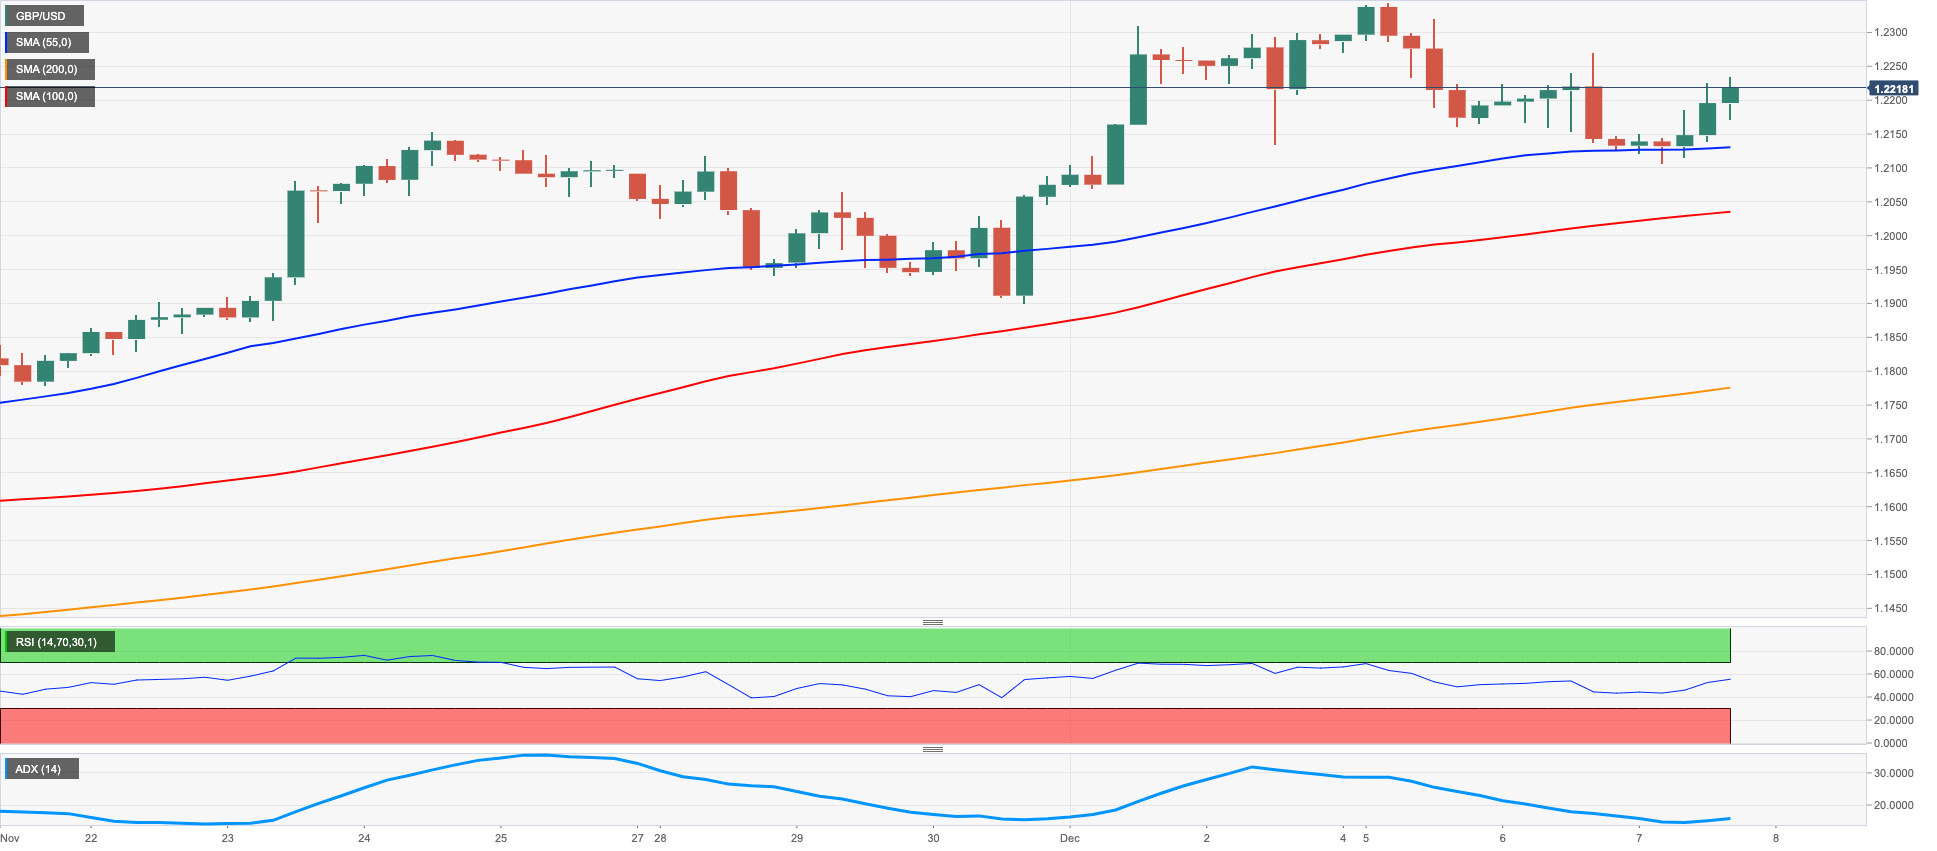
GBPUSD
GBP/USD followed the generalized improvement in the risk-linked galaxy and revisited the 1.2200 hurdle and beyond on Wednesday.
The better note in the risky assets came on the back of the renewed offered stance in the dollar, particularly following news that China will announce re-opening measures and start leaving behind its zero-COVID policy.
In the UK docket, house prices tracked by the Halifax House Price Index dropped 2.3% from a month earlier in November and rose 4.7% over the last twelve months.
If GBP/USD resumes the uptrend on a solid note, then the next target of relevance is seen at the December high at 1.2344 (December 5) ahead of the weekly top at 1.2405 (June 16). The breakout of the latter could prompt Cable to dispute the May peak at 1.2666 (May 27) prior to the psychological 1.3000 yardstick. On the flip side, the weekly low at 1.1900 (November 30) emerges as the next support of significance seconded by the interim 100- and 55-day SMAs at 1.1659 and 1.1521, respectively. South of here, a test of the November low at 1.1142 (November 4) could start emerging on the horizon ahead of the weekly low at 1.1059 (October 21). The daily RSI leapt to the proximity of 63.
Resistance levels: 1.2234 1.2269 1.2344 (4H chart)
Support levels: 1.2106 1.1900 1.1778 (4H chart)
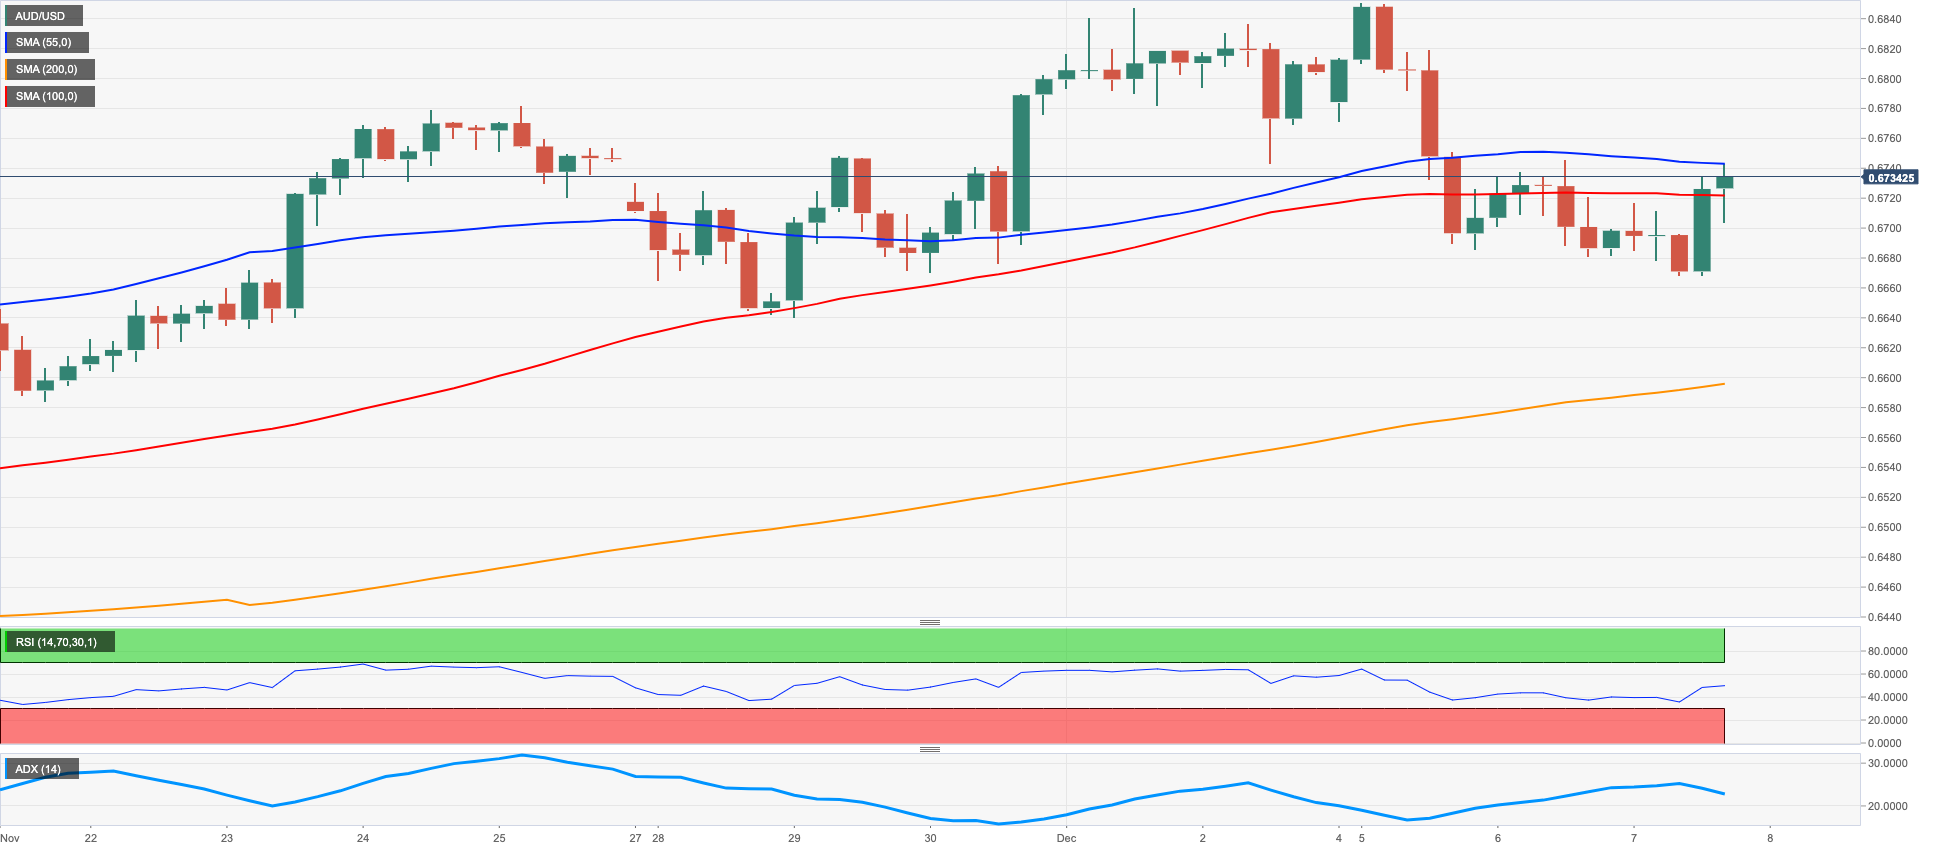
AUDUSD
Finally, AUD/USD regained the smile and left behind three straight sessions with losses on Wednesday, trespassing at the same time the 9-month resistance line near 0.6720.
The weaker greenback in combination with news that China could start easing its zero-COVID policy and somehow allow a return to normal activity helped the Aussie dollar to rebound from recent lows.
By the same token, the broad-based recovery in the commodity space also added to the upbeat tone in the pair on Wednesday.
In Oz, the GDP Growth Rate expanded 5.3% YoY in the July-September period and 0.6% vs. the previous quarter. Additional data saw the final Building Permits contract 6.4% in the year to October.
Extra gains in AUD/USD face the next hurdle at the December peak at 0.6850 (December 5) ahead of the September high at 0.6916 (September 13), which remains bolstered by the key 200-day SMA and comes before the psychological 0.7000 yardstick. Further up appears the weekly top at 0.7008 (August 26) prior to the August peak at 0.7136 (August 11). On the other hand, the weekly low at 0.6640 (November 29) offers initial support seconded by another weekly low at 0.6584 (November 21) and the 55-day SMA at 0.6512, all prior to the weekly low at 0.6386 (November 10). The daily RSI edged higher and flirted with 56.
Resistance levels: 0.6744 0.6850 0.6916 (4H chart)
Support levels: 0.6668 0.6640 0.6584 (4H chart)
GOLD
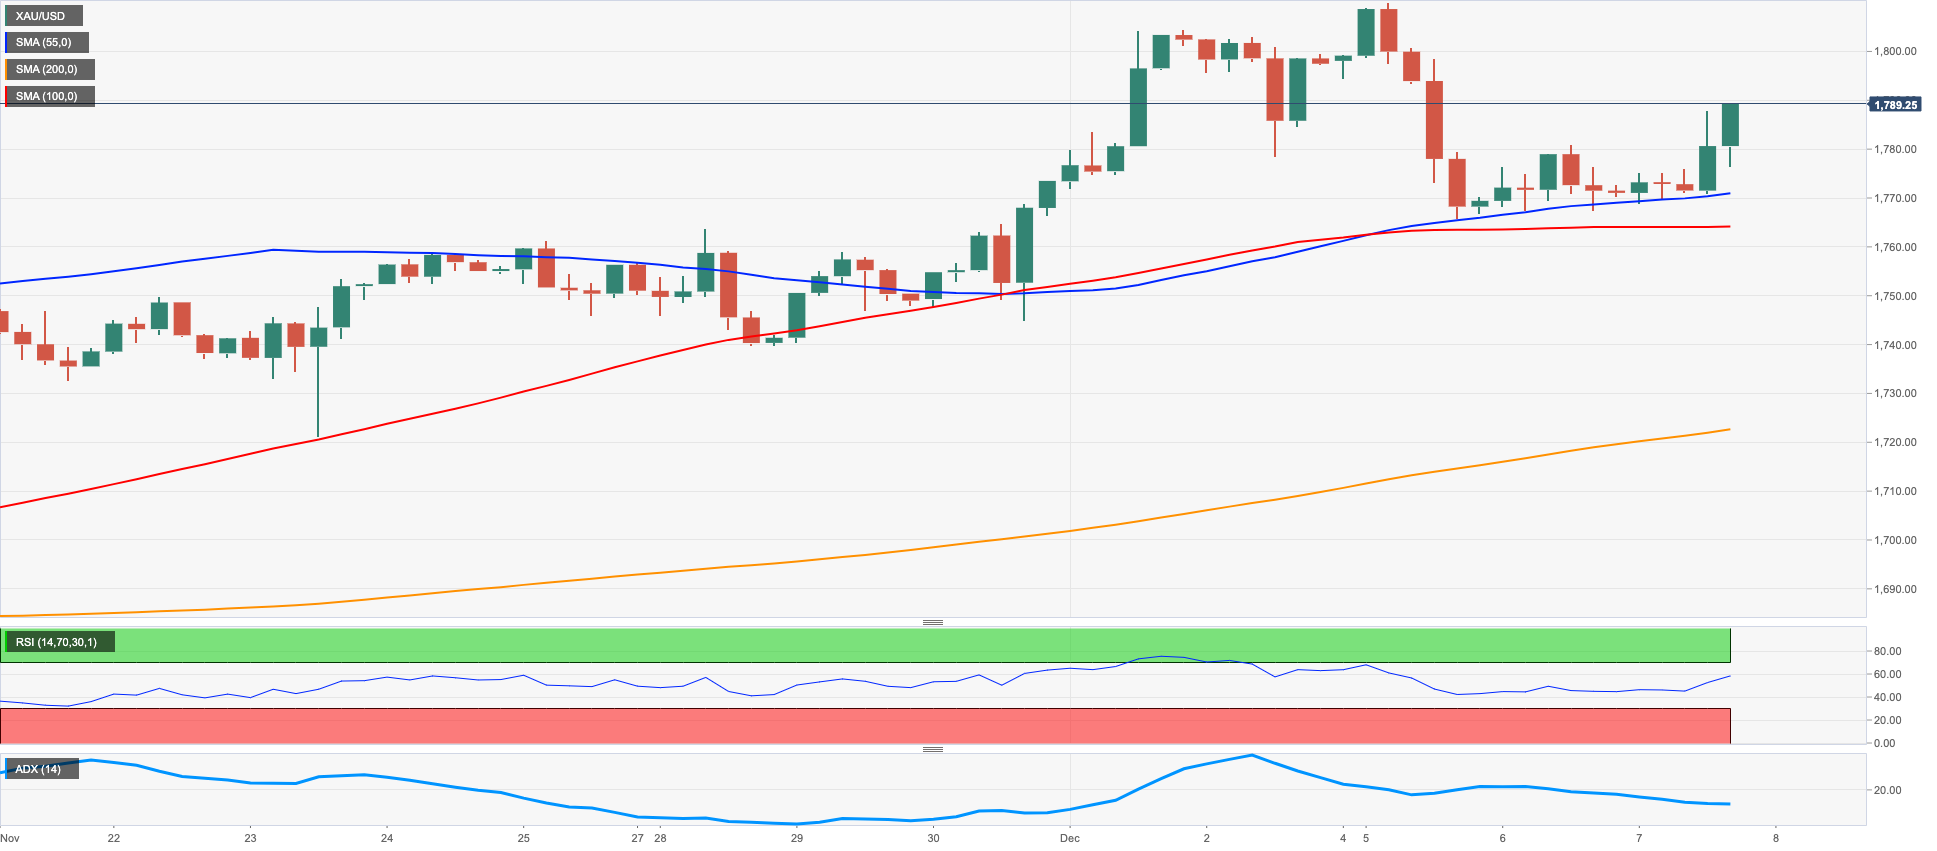
The daily pullback in the dollar allowed prices of the ounce troy of the precious metal to re-test the $1,790 zone on Wednesday.
Indeed, the China-led risk-on sentiment weighed on the buck and kept the price action in the USD Index (DXY) depressed, while the second daily drop in US yields across the curve also underpinned the upside momentum in bullion.
Looking at the macro scenario, namely the upcoming Fed and ECB interest rate decisions, both central banks are expected to hike rates by 50 bps, although the recent positive results from key US fundamentals seem to prop up the view that the Fed could keep the restrictive stance for longer.
In case bulls push harder, gold could revisit the 200-day SMA at $1,793 before the December high at $1,810 (December 5). Once the yellow metal clears the latter, it could then dispute the June peak at $1,879 (June 13) ahead of the May high at $1,909 (May 5). Contrarily, there is an initial contention at the weekly low at $1,727 (November 23) ahead of the interim 100- and 55-day SMAs at $1,716 and $1,700, respectively. South from here, a test of the 2022 low at $1,614 (September 28) could start shaping up before the round level at $1,600.
Resistance levels: $1,789 $1,807 $1,810 (4H chart)
Support levels: $1,765 $1,744 $1,739 (4H chart)
CRUDE WTI
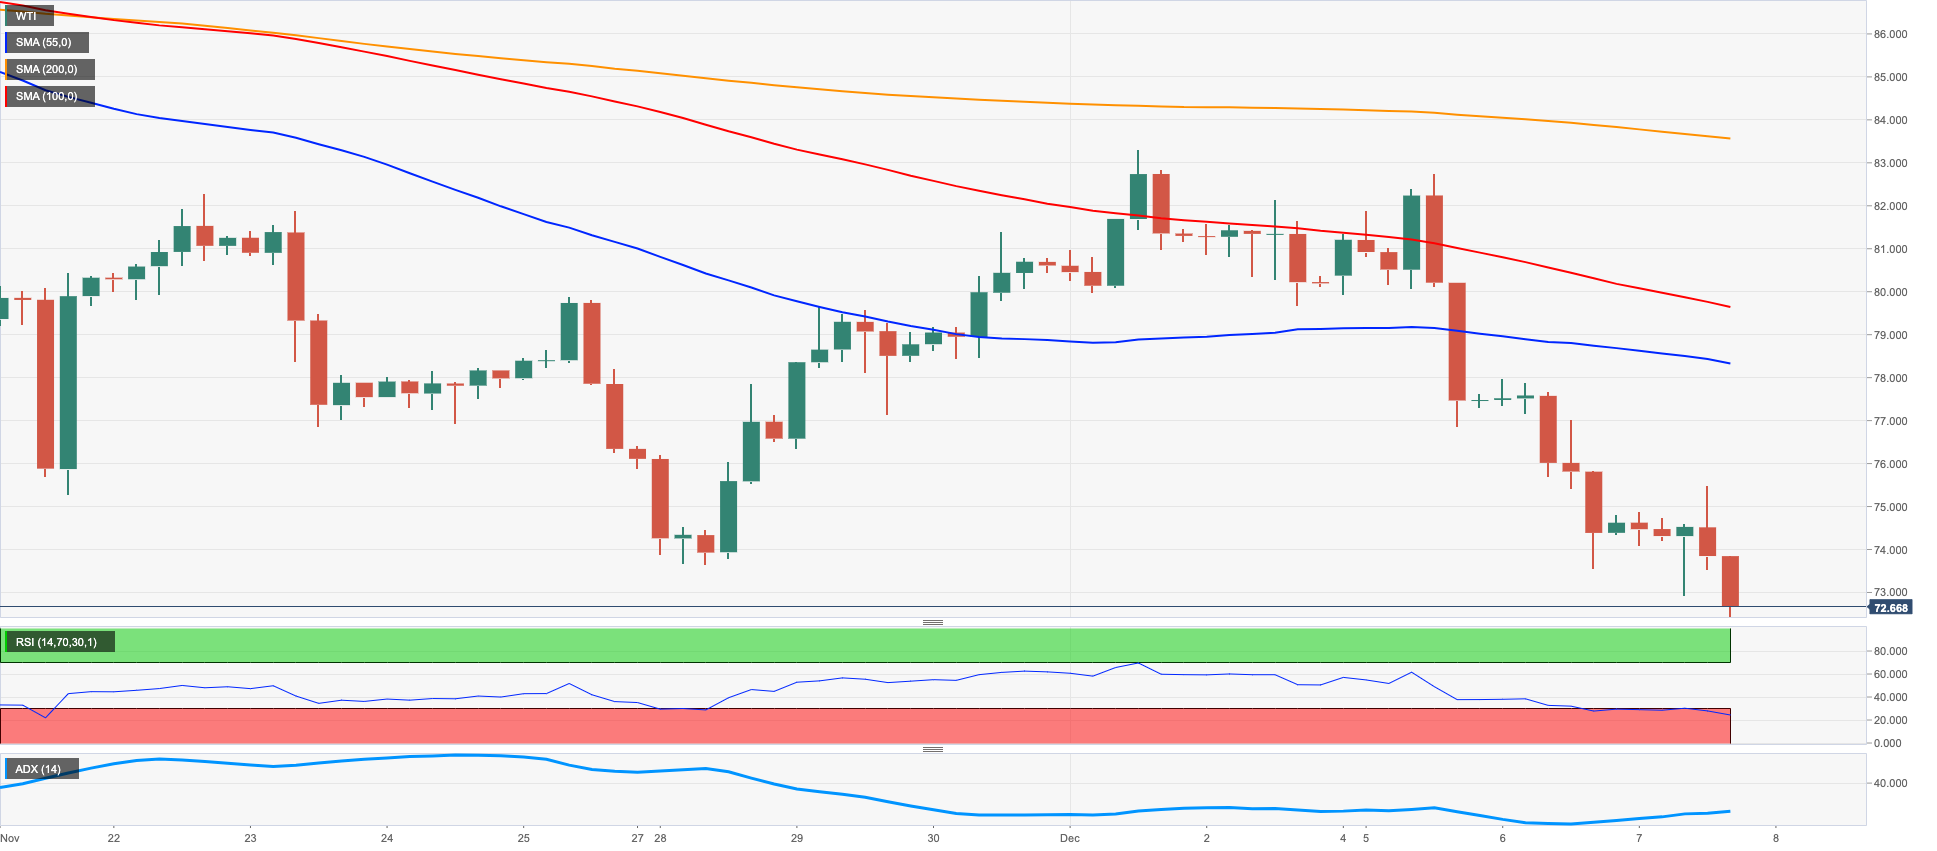
Prices of the WTI dropped to levels last seen back in late December 2021 near the $72.00 mark per barrel on Wednesday.
Recession fears and another strong build in US fuel products kept demand concerns well in place for yet another session and left the sentiment among traders well depressed.
On the latter, the EIA informed that US crude oil stockpiles shrank by5.187M barrels in the week to December 2, while supplies at Cushing decreased by 0.373M barrels, distillate stocks increased by 6.159M barrels and gasoline inventories rose by5.320M barrels.
The WTI slowly approaches the round level at $70.00. The breach of this key region could open the door to the weekly low at $66.15 (December 20 2021) prior to the December 2021 low at $62.46 (December 2). In the opposite direction, the key $80.00 mark per barrel emerges as the immediate obstacle for the resumption of the bullish bias ahead of the December high at $83.32 (December 1) and the 55- and 100-day SMAs at $84.04 and $86.86, respectively. North from here appears the $90.08 level (November 11) seconded by the November high at $93.73 and the 200-day SMA at $97.20.
Resistance levels: $75.36 $77.86 $82.70 (4H chart)
Support levels: $72.22 $70.79 $68.55 (4H chart)
DOW JONES
Equities traded in a mixed note on Wednesday, as investors’ worries kept gyrating around fears that the US economy could slip into recession in the next months.
Those concerns have been exacerbated as of late in response to better-than-expected results from key US fundamentals, which at the same time highlighted the resilience of the economy and might prompt the Fed to keep the restrictive policy for longer.
All in all, the Dow Jones rose 0.15% to 33,646, the S&P500 dropped 0.03% to 3,940 and the tech-heavy Nasdaq Composite retreated 0.19% to 10,994.
The Dow Jones seems to have met decent contention at the so far December low at 33,418 (December 6), which is closely followed by another weekly low at 33,239 (November 17). The loss of this level could pave the way for a deeper decline to the key 200-day SMA at 32,454 ahead of the provisional 100-day SMA at 32,056 and the November low at 31,727 (November 3). By contrast, bulls need to clear the December high at 34,595 (December 1) to allow for the rebound to challenge the April top at 35,492 prior to the February peak at 35,824 (February 9). The daily RSI edged a tad higher and poked with 54.
Top Performers: Home Depot, 3M, Merck&Co
Worst Performers: Salesforce Inc, Apple, Dow
Resistance levels: 34,595 35,492 35,824 (4H chart)
Support levels: 33,418 33,239 32,478 (4H chart)
-638060369543533975.png)
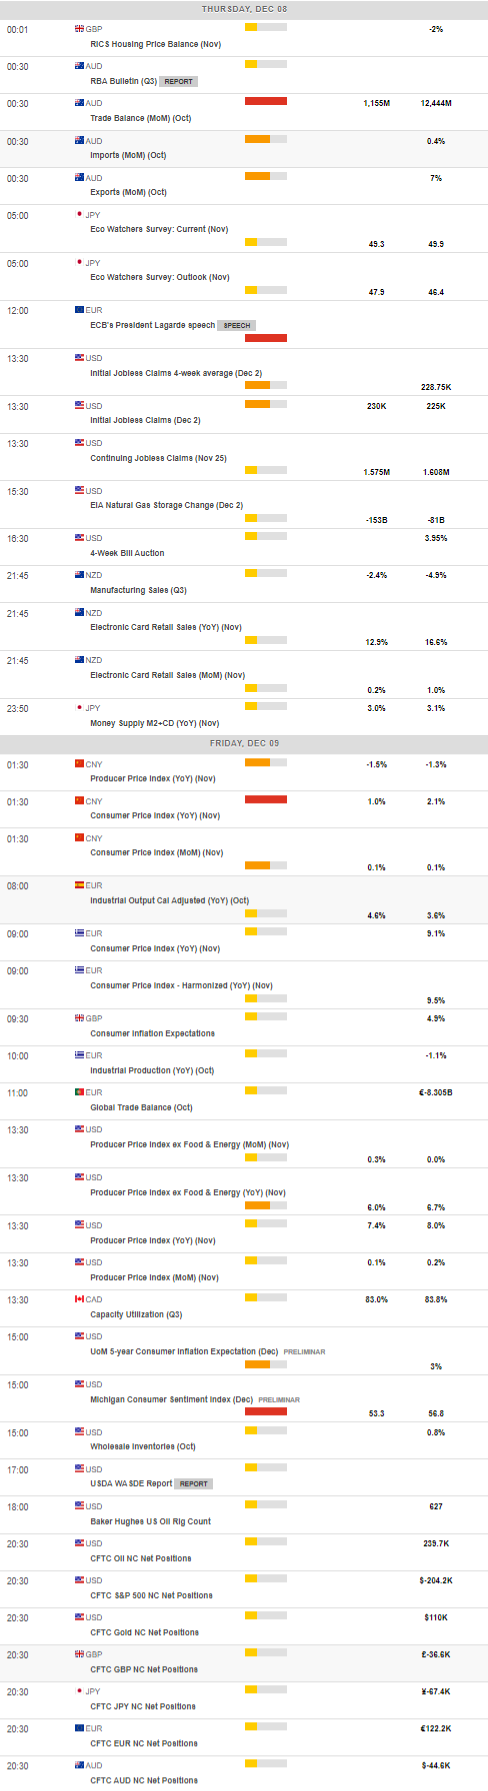
MACROECONOMIC EVENTS
All Information & Updates provided by:

All information relating to the financial markets available on this page has been prepared and issued by FXStreet (Forexstreet SL, Spain, Reg: B62498233) on the basis of publicly available information and all information believed to be reliable and does not conflict with Kuwaiti local laws, and all necessary care has been taken to before the company to ensure that the facts mentioned are correct from the source.
NCM Investment nor any of its directors or employees shall in any way be held responsible for the contents of this news, and the information contained on this page is intended only to provide clients with publicly available information and should not be construed as investment advice, report or analysis and/or constitute an offer or invitation to buy or sell financial instruments of any kind.
RISK WARNING: Forex and CFDs are highly risky leveraged products, as losses can exceed deposits. Please ensure you understand all the risks and take independent advice if necessary. NCM will segregate the clients based on the criteria of the regulator and its bylaws. NCM does not provide any advisory service; the material published does not constitute advice or a recommendation for a transaction in any financial instrument. NCM accepts no responsibility for any use of the content presented and any consequences of that use. Anyone acting on the information provided does so at their own risk.