
- Contact Us:
-

-

-

-


Daily Market Updates
09 Dec 2022
EURUSD
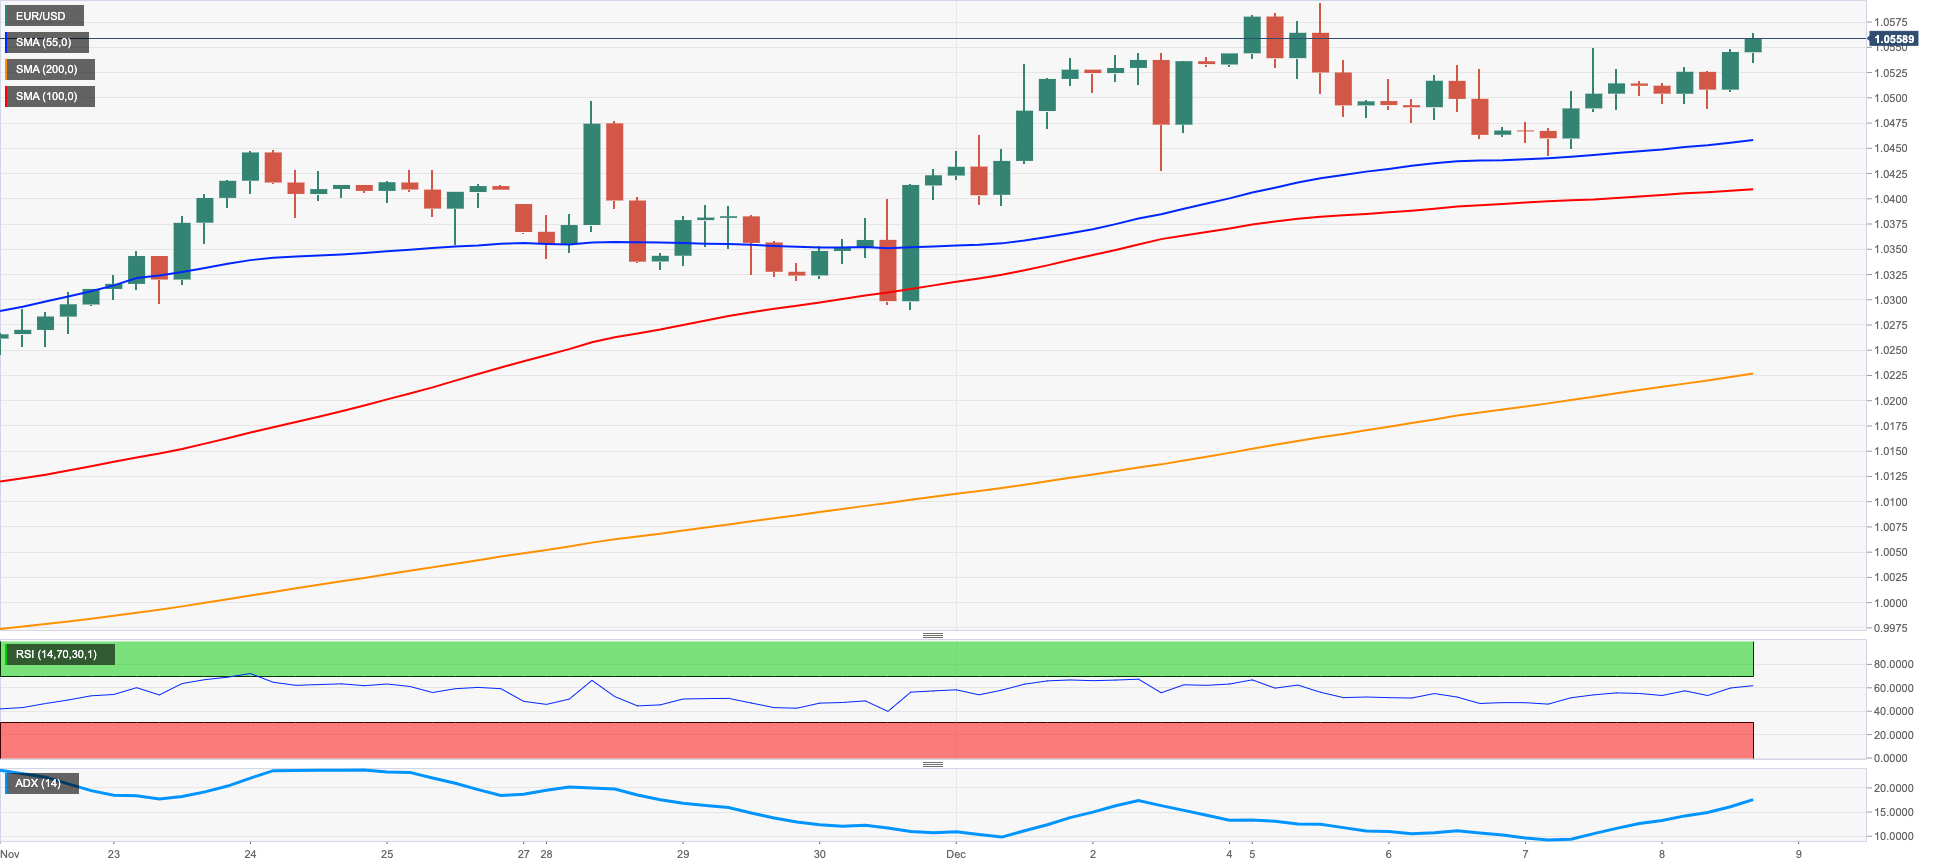
Another negative session in the greenback allowed EUR/USD to advance for the second day in a row and consolidate further the recent breakout of 1.0500 the figure on Thursday.
In fact, the weakness surrounding the greenback remained unchanged on Thursday, as market participants appear to have already priced in a 50 bps interest rate hike by the Fed at next week’s event.
Looking at the US money markets, US yields reversed part of the recent downside pressure and rose modestly on Thursday along with somewhat diminishing recession fears. In Germany, the 10-year bund yields also rose marginally after two daily retracements in a row.
There were no data releases in the old continent on Thursday, whereas Initial Jobless Claims rose by 230K in the week to December 3 in what was the sole release across the Atlantic.
There is no change to the topside in EUR/USD, as the December top at 1.0594 (December 5) remains the next target of note for bulls. Above this level comes the weekly peak at 1.0614 (June 27) followed by the June high at 1.0773 (June 9) and the May top at 1.0786 (May 30). By contrast, the key 200-day SMA at 1.0352 offers initial support prior to the weekly low at 1.0290 (November 30) and another weekly low at 1.0222 (November 21). The continuation of the leg lower could see the provisional 100- and 55-day SMAs at 1.0060 and 1.0046, respectively, retested ahead of the critical parity level. The daily RSI edged further up past 66.
Resistance levels: 1.0564 1.0594 1.0614 (4H chart)
Support levels: 1.0443 1.0428 1.0392 (4H chart)
USDJPY
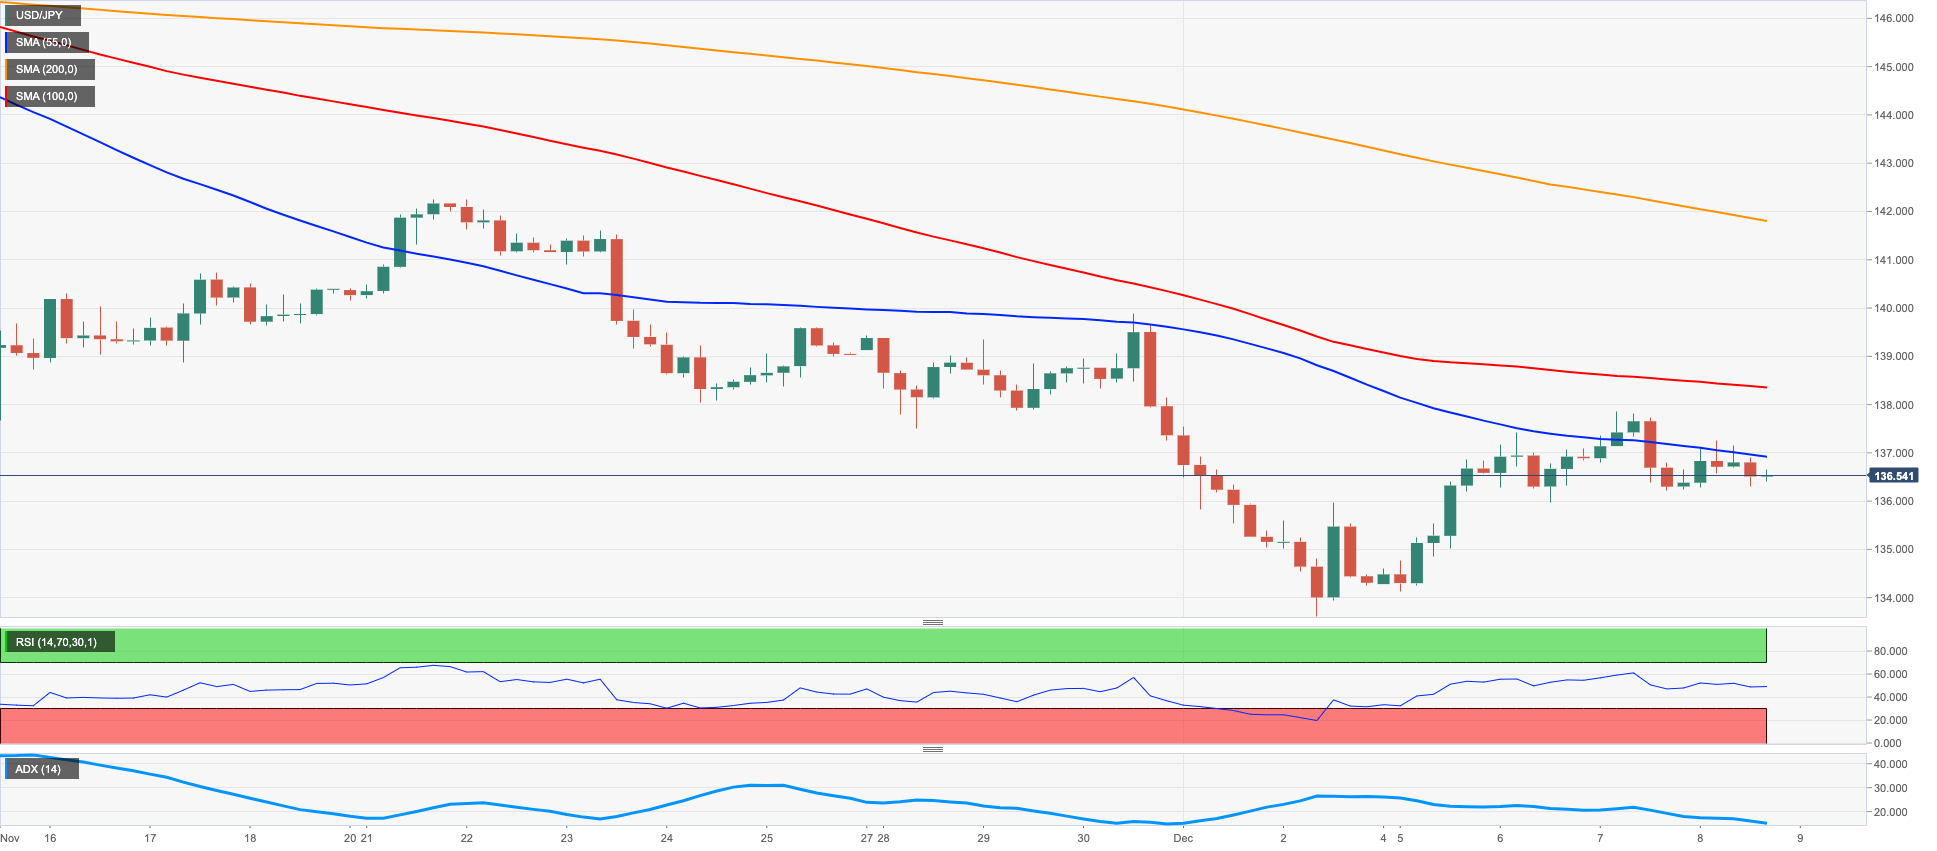
USD/JPY gyrated around Wednesday’s close and bounced off daily lows in tandem with the rebound in US yields across the curve amidst another poor session in the greenback.
Indeed, the USD Index (DXY) retreated to the area below the 105.00 mark in response to the persevering appetite for the risk complex, while the renewed upside traction in US yields favoured some JPY selling at the same time.
In Japan, final GDP Growth Rate figure saw the economy contract 0.8% YoY in Q3 and 0.2% vs. the previous quarter. In addition, Bank Lending expanded 2.7% in the year to November and Foreign Bond Investment rose to ¥522.2B in the week to December 3. Additional releases showed the Eco Watchers Survey Current at 48.1 and the Eco Watchers Survey outlook at 45.1 both for the month of November.
The continuation of the corrective downside could see USD/JPY revisiting the key 200-day SMA at 134.92 ahead of the December low at 133.61 (December 2). A deeper pullback could put the August low at 130.39 (August 2) back on the investors’ radar ahead of the key round level at 130.00. On the flip side, the weekly top at 137.85 (December 7) comes first prior to another weekly peak at 139.89 (November 30), which precedes the round level at 140.00. North from here emerges the interim 100-day SMA at 141.05 seconded by the weekly high at 142.25 (November 21). The daily RSI appeared stable near 37.
Resistance levels: 137.85 139.89 141.61 (4H chart)
Support levels: 135.96 133.61 132.55 (4H chart)
GBPUSD
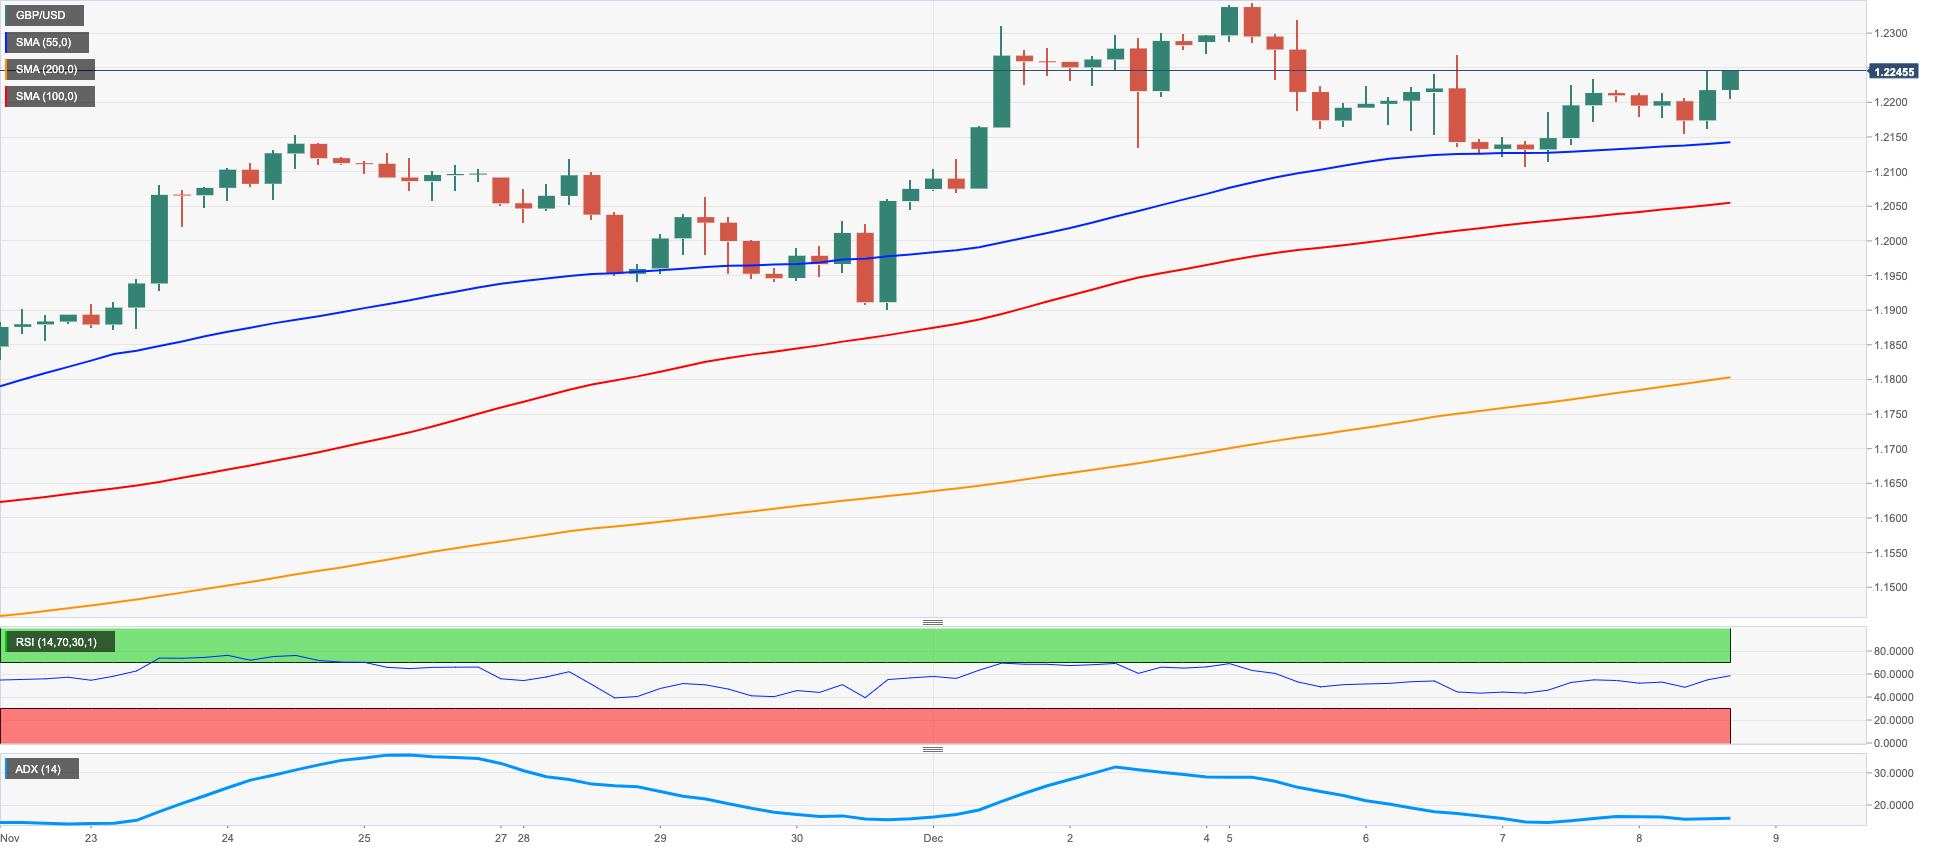
GBP/USD added to Wednesday’s uptick and regained the area well beyond the 1.2200 mark on Thursday, recovering further ground following the strong decline seen in the first half of the week.
Once again, the persistent weakness in the greenback lent extra legs to the risk-associated universe and fueled the move higher in the British pound to 2-day highs near 1.2250 vs. the buck.
The next releases of note in the UK calendar will be the GDP figures along with trade balance results, Industrial Production and Manufacturing Production, all due on December 12.
Extra gains in GBP/USD now need to clear the December top at 1.2344 (December 5) in the near term to allow for a potential visit to the weekly peak at 1.2405 (June 16) ahead of the May high at 1.2666 (May 27) and the psychological 1.3000 mark. Just the opposite, the 200-day SMA at 1.2123 should hold the initial test followed by the weekly low at 1.1900 (November 30) and the temporary 100- and 55-day SMAs at 1.1662 and 1.1539, respectively. The loss of this region exposes the November low at 1.1142 (November 4) before the weekly low at 1.1059 (October 21). The daily RSI rose to the proximity of 64.
Resistance levels: 1.2247 1.2269 1.2344 (4H chart)
Support levels: 1.2106 1.1900 1.1781 (4H chart)
AUDUSD
AUD/USD rose to 3-day highs and revisited the 0.6780 region on Thursday.
The second daily gain in a row was propped up by the intense sell-off in the dollar, while an auspicious session in the commodity galaxy also lent support to the Aussie dollar.
On the latter, further gains in copper prices and the iron ore remained underpinned by positive news from the Chinese reopening and easing of the zero-COVID policy.
Data wise Down Under, the trade surplus shrank a tad to $A12.217B in October (from $A12.444B).
Immediately to the upside in AUD/USD turns up the December high at 0.6850 (December 5) before the September top at 0.6916 (September 13). The latter remains reinforced by the key 200-day SMA and precedes the psychological 0.7000 mark. The surpass of the latter opens the door to a probable visit to the weekly peak at 0.7008 (August 26) ahead of the August high at 0.7136 (August 11). On the contrary, the weekly low at 0.6640 (November 29) is expected to hold the downside initially followed by another weekly low at 0.6584 (November 21) and the 55-day SMA at 0.6514. Further down appears the weekly low at 0.6386 (November 10). The daily RSI improved past the 58 yardstick.
Resistance levels: 0.6780 0.6850 0.6916 (4H chart)
Support levels: 0.6668 0.6640 0.6584 (4H chart)
-638061234255657089.png)
GOLD
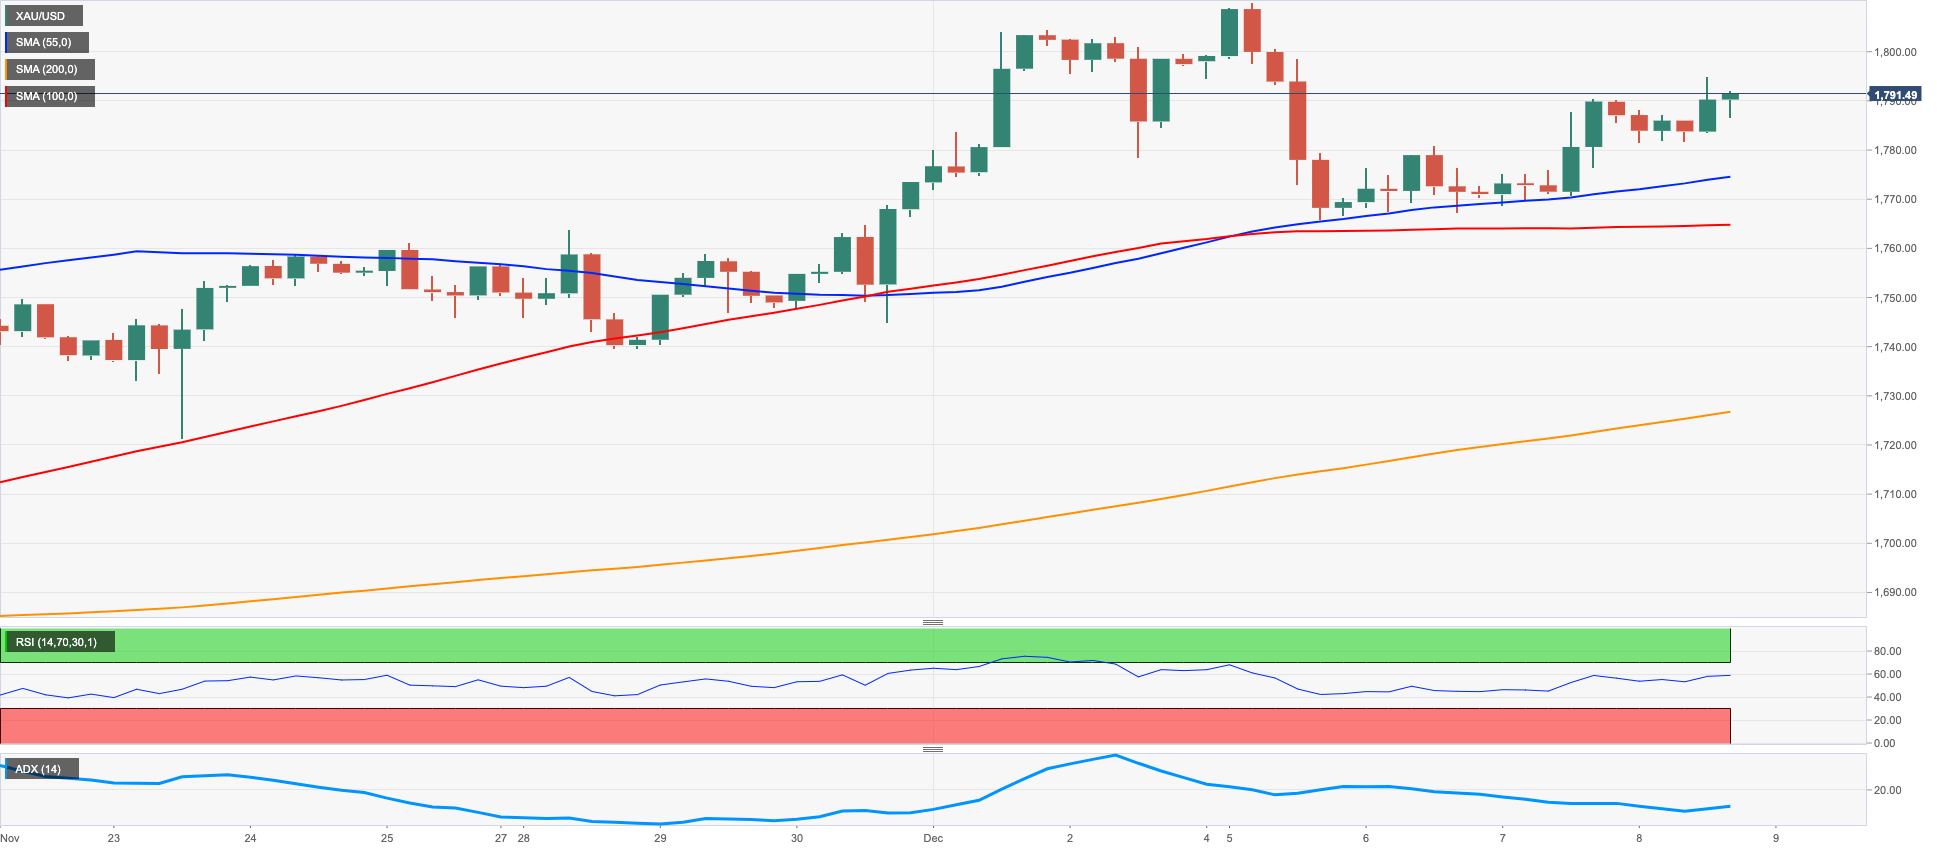
Gold prices kept the positive mood and extended the weekly recovery to the very doorsteps of the key $1,800 mark per ounce troy on Thursday, flirting at the same time with the 200-day SMA and advancing for the third session in a row.
Once again, sellers dominated the sentiment around the greenback and dragged the USD Index (DXY) back below the 105.00 mark, while the upbeat mood in US yields across the curve somehow limited the upside in the yellow metal.
If gold leaves behind the 200-day SMA at $1,793 in a sustainable fashion, it could then challenge the December peak at $1,810 (December 5) prior to the June high at $1,879 (June 13) and the May top at $1,909 (May 5). On the other hand, sellers face an initial barrier at the weekly low at $1,727 (November 23) seconded by the provisional 100- and 55-day SMAs at $1,717 and $1,702, respectively. A drop below that region could pave the way for a move to the 2022 low at $1,614 (September 28) ahead of the round level at $1,600.
Resistance levels: $1,794 $1,810 $1,814 (4H chart)
Support levels: $1,765 $1,744 $1,739 (4H chart)
CRUDE WTI
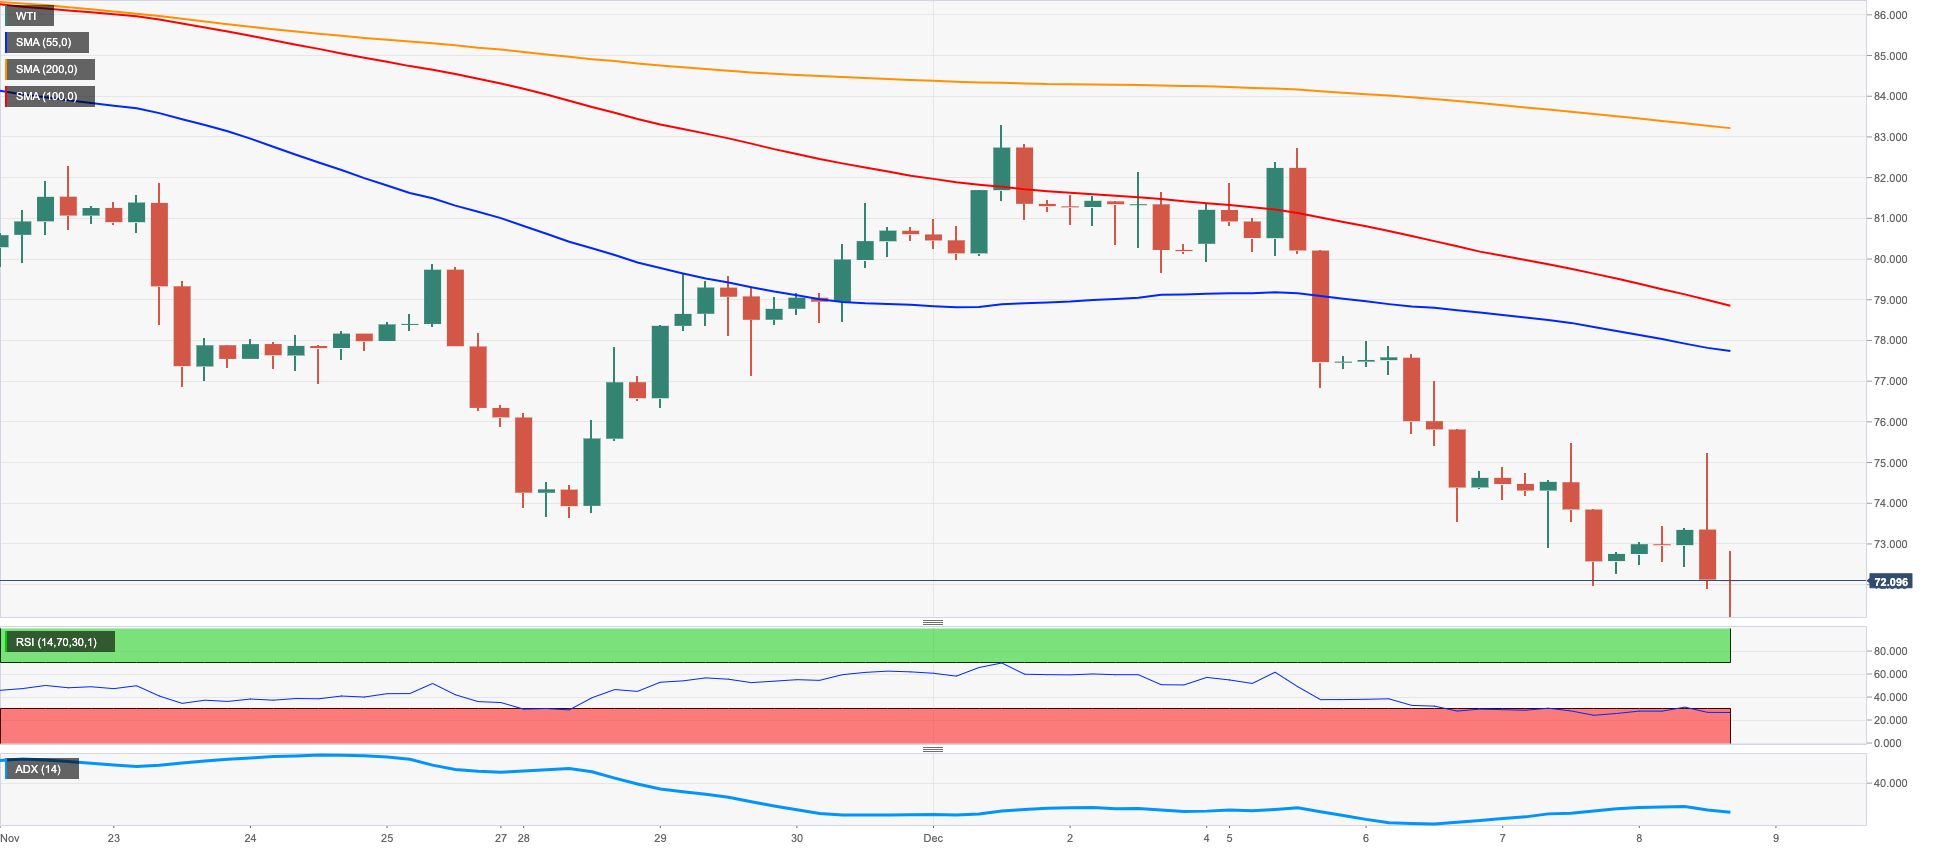
The sentiment around crude oil deteriorated further and dragged prices of the American reference for the sweet light crude oil to fresh lows near the $71.00 mark per barrel on Thursday, an area last seen back in late December 2021.
The WTI has more than offset the 2022 gains and is now losing around 5% since January, while it drops nearly 45% since the yearly highs around the $130.00 mark soon after the Russian invasion of Ukraine.
Further weakness in the commodity followed unabated concerns surrounding the demand for crude oil in a context where the likelihood of a recession seems to grow by the day and remains well underpinned by further tightening prospects by major central banks.
A deeper drop from the 2022 low at $71.14 (December 8) exposes the round level at $70.00. If WTI breaks below this level it could then confront the weekly low at $66.15 (December 20 2021) ahead of the December 2021 low at $62.46 (December 2). Alternatively, the key $80.00 mark per barrel offers minor resistance prior to the December top at $83.32 (December 1) followed by the 55- and 100-day SMAs at $83.83 and $86.61, respectively. The continuation of the uptrend could then target the $90.08 level (November 11) prior to the November top at $93.73 and the 200-day SMA at $97.01.
Resistance levels: $75.41 $77.86 $82.70 (4H chart)
Support levels: $71.14 $70.79 $68.55 (4H chart)
DOW JONES
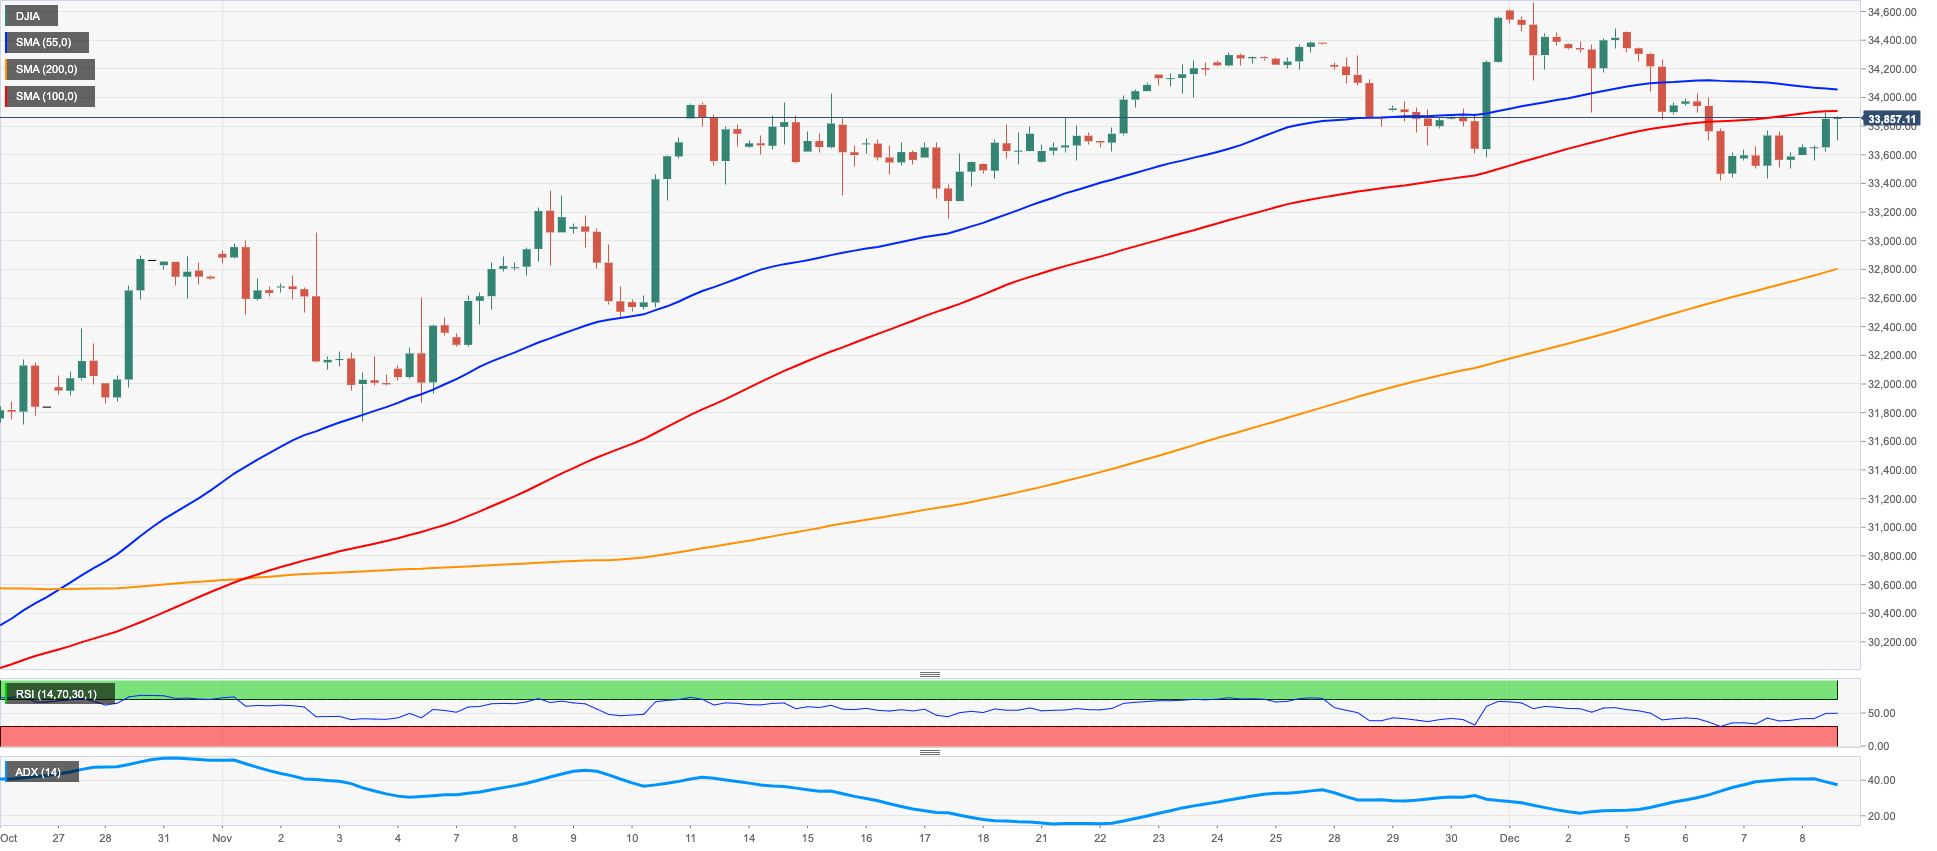
US stocks reversed part of the recent decline and charted decent gains on Thursday.
Indeed, equities traded on the positive foot on the back of the weaker dollar and mixed US yields, while investors seem to have set aside, albeit momentarily, recession concerns ahead of the upcoming FOMC event on December 14.
On the latter, it is worth recalling that the probability of a 50 bps rate raise is at nearly 80% according to CME Group’s FedWatch Tool.
That said, the Dow Jones advanced 0.61% to 33,803, the S&P500 gained 0.81% to 3,965 and the tech-reference Nasdaq Composite rose 1.46% to 11,118.
In case bulls regain the initiative, the Dow Jones should meet the next hurdle at the December top at 34,595 (December 1) ahead of the April peak at 35,492 and the February high at 35,824 (February 9). In the opposite direction, there is initial contention at the December low at 33,418 (December 6) just before another weekly low at 33,239 (November 17). The breach of the latter could open the door to the key 200-day SMA at 32,458 followed by the temporary 100-day SMA at 32,075 and the November low at 31,727 (November 3). The daily RSI bounced and flirted with the 56 mark.
Top Performers: Boeing, Nike, Cisco
Worst Performers: Goldman Sachs, Verizon, American Express
Resistance levels: 33,899 34,595 35,492 (4H chart)
Support levels: 33,418 33,239 32,478 (4H chart)
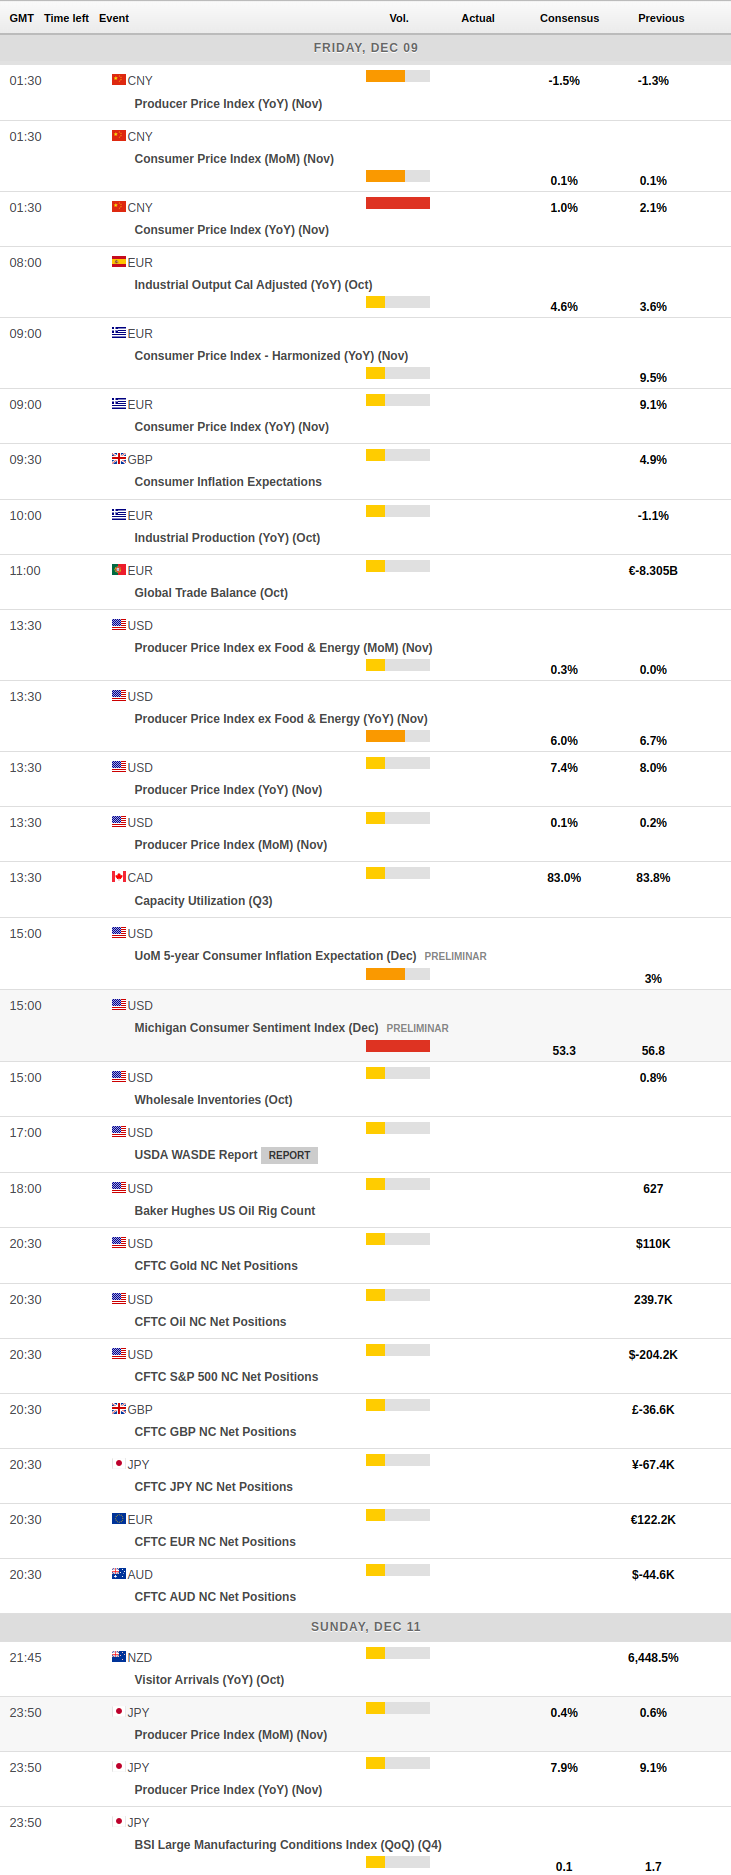
MACROECONOMIC EVENTS
All Information & Updates provided by:

All information relating to the financial markets available on this page has been prepared and issued by FXStreet (Forexstreet SL, Spain, Reg: B62498233) on the basis of publicly available information and all information believed to be reliable and does not conflict with Kuwaiti local laws, and all necessary care has been taken to before the company to ensure that the facts mentioned are correct from the source.
NCM Investment nor any of its directors or employees shall in any way be held responsible for the contents of this news, and the information contained on this page is intended only to provide clients with publicly available information and should not be construed as investment advice, report or analysis and/or constitute an offer or invitation to buy or sell financial instruments of any kind.
RISK WARNING: Forex and CFDs are highly risky leveraged products, as losses can exceed deposits. Please ensure you understand all the risks and take independent advice if necessary. NCM will segregate the clients based on the criteria of the regulator and its bylaws. NCM does not provide any advisory service; the material published does not constitute advice or a recommendation for a transaction in any financial instrument. NCM accepts no responsibility for any use of the content presented and any consequences of that use. Anyone acting on the information provided does so at their own risk.