
- Contact Us:
-

-

-

-


Daily Market Updates
12 Dec 2022
EURUSD
An uneventful session saw EUR/USD slip back to the low-1.0500s and end the week slightly on the defensive. That said, and looking at the weekly chart, the pair ended with marginal losses after two consecutive advances.
Once again, the dollar met some strength following higher-than-expected US Producer Prices, which at the same time sparked a bounce in the USD Index (DXY) past the 105.00 barrier. Friday’s move higher in the buck was enough to leave the index with decent gains on a weekly basis.
In the docket, US Producer Prices rose 0.3% MoM in November and 7.4% over the last twelve months. Core Producer Prices followed suit and gained 0.4% MoM and 6.2% YoY. In addition, the advanced Michigan Consumer Sentiment is seen improving to 59.1 in the current month while Wholesale Inventories expanded 0.5% MoM in October.
Further upside in EUR/USD remains focused on the December peak at 1.0594 (December 5) followed by the weekly high at 1.0614 (June 27). The breakout of the latter could open the door to a test of the June top at 1.0773 (June 9) prior to the May peak at 1.0786 (May 30). In the opposite direction, the weekly low at 1.0443 (December 7) emerges as a minor support ahead of the key 200-day SMA at 1.0350 and the weekly low at 1.0290 (November 30). South from here emerges another weekly low at 1.0222 (November 21) before the 1.0060 zone, where the interim 100- and 55-day SMAs converge. The daily RSI ticked lower and broke below 65.
Resistance levels: 1.0588 1.0594 1.0614 (4H chart)
Support levels: 1.0503 1.0443 1.0428 (4H chart)
-638063662721338636.png)
USDJPY
USD/JPY managed to rebound from lows in the 135.60 region and flirt with the 137.00 level, just to settle around 136.60 at the end of the week. Spot however, was able to clinch the first week with gains after two straight pullbacks, including a drop to 4-month lows near 133.60 (December 2).
The late bounce in the dollar – particularly fueled following the release of US Producer prices - in combination with strong gains in US yields across the curve lent legs to the pair and sponsored the rebound from daily lows.
From the BoJ, Board member Takata said that the country has not yet reached the level where the central bank’s yield curve control (YCC) strategy can be ended.
The Japanese calendar was empty on Friday, leaving all the attention to the release of the BSI Large Manufacturing, Producer Prices and Machine Tool Orders, all due on December 12.
If sellers regain the upper hand, USD/JPY could retest the key 200-day SMA at 135.03 in the near term prior to the December low at 133.61 (December 2). Further weakness could motivate the August low at 130.39 (August 2) to re-emerge on the horizon before the key round level at 130.00. Just the opposite, the immediate up barrier appears at the weekly peak at 137.85 (December 7) ahead of another weekly high at 139.89 (November 30) and the round level at 140.00. The trespass of this level could open the door to the temporary 100-day SMA at 141.08 prior to the weekly top at 142.25 (November 21). The daily RSI gyrated around the 37 region.
Resistance levels: 137.24 137.85 139.89 (4H chart)
Support levels: 135.60 133.61 132.55 (4H chart)
-638063665167896752.png)
GBPUSD
Despite the positive performance in the greenback, GBP/USD managed to clinch the third daily advance in a row at the end of the week. However, Cable closed the week slightly in the negative territory, halting at the same time four consecutive weekly gains.
In the UK money markets, the 10-year gilt yields added to Thursday’s gains and rose to multi-session peaks near the 3.20% region ahead of the key BoE interest rate decision in the upcoming week.
On the latter, consensus among investors remain tilted to a 50 bps rate hike by the “Old Lady”, although concerns persist regarding the grim economic outlook for the next periods, including a recession that is seen lasting past 2023.
Nothing scheduled data wise in the UK docket. The next salient events will be the GDP figures, trade balance, Industrial Production and Manufacturing Production, all expected on December 12.
The continuation of the uptrend in GBP/USD is expected to challenge the December peak at 1.2344 (December 5) seconded by the weekly high at 1.2405 (June 16). The surpass of this level could put a visit to the May top at 1.2666 (May 27) back on the radar prior to the psychological 1.3000 mark. By contrast, there is initial contention at the 200-day SMA at 1.2118 ahead of the weekly low at 1.1900 (November 30) and the provisional 100- and 55-day SMAs at 1.1664 and 1.1564, respectively. A deeper drop could pave the way for a move to the November low at 1.1142 (November 4) ahead of the weekly low at 1.1059 (October 21). The daily RSI advanced slightly above 64.
Resistance levels: 1.2322 1.2344 1.2405 (4H chart)
Support levels: 1.2201 1.2154 1.2106 (4H chart)
-638063663637519713.png)
AUDUSD
Another solid performance allowed AUD/USD to rise for the third session in a row and surpass 0.6800 the figure on Friday.
Indeed, the Aussie dollar remained bid despite the better tone in the greenback and the mixed results from the commodity complex, where copper prices and the iron ore gave away part of the recent marked recovery.
Indeed, recent news citing the easing of COVID restrictions in China and the direct impact on the economic growth prospects remained a solid source of strength around AUD.
Next of significance in the Australian docket will be the Consumer Confidence Index tracked by Westpac and to be published on December 13.
Next on the upside for AUD/USD still emerges the December top at 0.6850 (December 5) ahead of the September peak at 0.6916 (September 13). The proximity of the key 200-day SMA (0.6907) props up the latter and the surpass of this region could expose a move to the psychological 0.7000 mark. Above this level it turns up the weekly high at 0.7008 (August 26) before the August top at 0.7136 (August 11). On the flip side, there is initial contention at the weekly low at 0.6668 (December 7) followed by weekly lows at 0.6640 (November 29) and 0.6584 (November 21). The breakdown of the latter unveils the 55-day SMA at 0.6519 ahead of the weekly low at 0.6386 (November 10). The daily RSI extended the upside and poked with the 60 yardstick.
Resistance levels: 0.6813 0.6850 0.6916 (4H chart)
Support levels: 0.6742 0.6668 0.6640 (4H chart)
-638063665810741972.png)
GOLD
Prices of the ounce troy of the precious metal clinched the fourth consecutive daily advance and briefly regained the area above the key $1,800 mark at the end of the week, just to end the day slightly below it.
Bullion kept the buying interest well and sound on Friday despite the rebound in the dollar and the marked move higher in US yields across the curve, while higher-than-expected US Producer Prices and renewed inflation concerns appear to have lent support to the yellow metal.
In the meantime, gold is expected to face increased volatility in the upcoming sessions in light of the FOMC event on December 14, where the Fed is expected to raise the Fed Funds Target Range (FFTR) by half percentage point.
If the rebound in gold picks up extra pace, then the December high at $1,810 (December 5) is expected to come to the fore ahead of the June top at $1,879 (June 13) and the May peak at $1,909 (May 5). On the contrary, the so far December low at $1,765 (December 5) should emerge as the next target for bears followed by the weekly low at $1,727 (November 23) and the interim 100- and 55-day SMAs at $1,718 and $1,705, respectively. Once cleared, bullion could then dispute the 2022 low at $1,614 (September 28) before the round level at $1,600.
Resistance levels: $1,806 $1,810 $1,814 (4H chart)
Support levels: $1,765 $1,744 $1,739 (4H chart)
-638063666159621634.png)
CRUDE WTI
Prices of the West Texas Intermediate (WTI) recorded the 6th consecutive daily retracement and traded at shouting distance from the key $70.00 mark per barrel on Friday.
Indeed, prices had their worst week since late March after shedding nearly 11% on the back of heightened recession concerns and the direct impact on the demand for crude oil. These fears have magnified after US Producer Prices rose more than expected during November.
Adding to the sour sentiment around the commodity, the rebound in the greenback prompted the USD Index (DXY) to close the week with positive figures amidst higher US yields.
In the docket, driller Baker Hughes said the US oil rig count went down by 2 in the week to December 9, taking the total US oil rig count to 625.
If the WTI breaks below the key round level at $70.00 it could then challenge the weekly low at $66.15 (December 20 2021) prior to the 200-week SMA at $64.98 and the December 2021 low at $62.46 (December 2). Contrarily, the next up barrier aligns at the key $80.00 mark per barrel ahead of the December peak at $83.32 (December 1), which precedes the 55- and 100-day SMAs at $83.68 and $86.37, respectively. Up from here comes the $90.08 level (November 11) before the November peak at $93.73 and the 200-day SMA at $96.82.
Resistance levels: $72.90 $75.41 $77.86 (4H chart)
Support levels: $70.10 $68.55 $66.11 (4H chart)
-638063667092278908.png)
DOW JONES
Equities tracked by the Dow Jones reversed two daily pullbacks in a row and closed near the December lows on Friday.
In fact, the risk-off sentiment re-emerged among investors at the end of the week and particularly in response to higher-than-expected US Producer Prices in November, which are expected to keep the Fed’s normalization process well in place for the time being.
In the meantime, consensus remains tilted towards a 50 bps rate hike on December 14, although markets’ attention will also be on the publication of inflation figures measured by the CPI also for the month of November, due on the previous day.
On the whole, the Dow Jones retreated 0.90% to 33,476, the S&P500 dropped 0.73% to 3,934 and the tech-benchmark Nasdaq Composite shed 0.70% to 11,004.
The Dow Jones closed just cents away from the December low at 33,418 (December 6). If cleared, then the index could probe the weekly low at 33,239 (November 17) prior to the key 200-day SMA at 32,459. South from here emerges the provisional 100-day SMA at 32,091 followed by the November low at 31,727 (November 3). Alternatively, bulls face the next hurdle at the December peak at 34,595 (December 1) seconded by the April high at 35,492 and the February top at 35,824 (February 9). The daily RSI dropped further and approached the 51 zone.
Top Performers: Walt Disney, Verizon, Salesforce Inc
Worst Performers: Chevron, Amgen, Walmart
Resistance levels: 33,899 34,595 35,492 (4H chart)
Support levels: 33,418 33,239 32,478 (4H chart)
-638063667443249983.png)
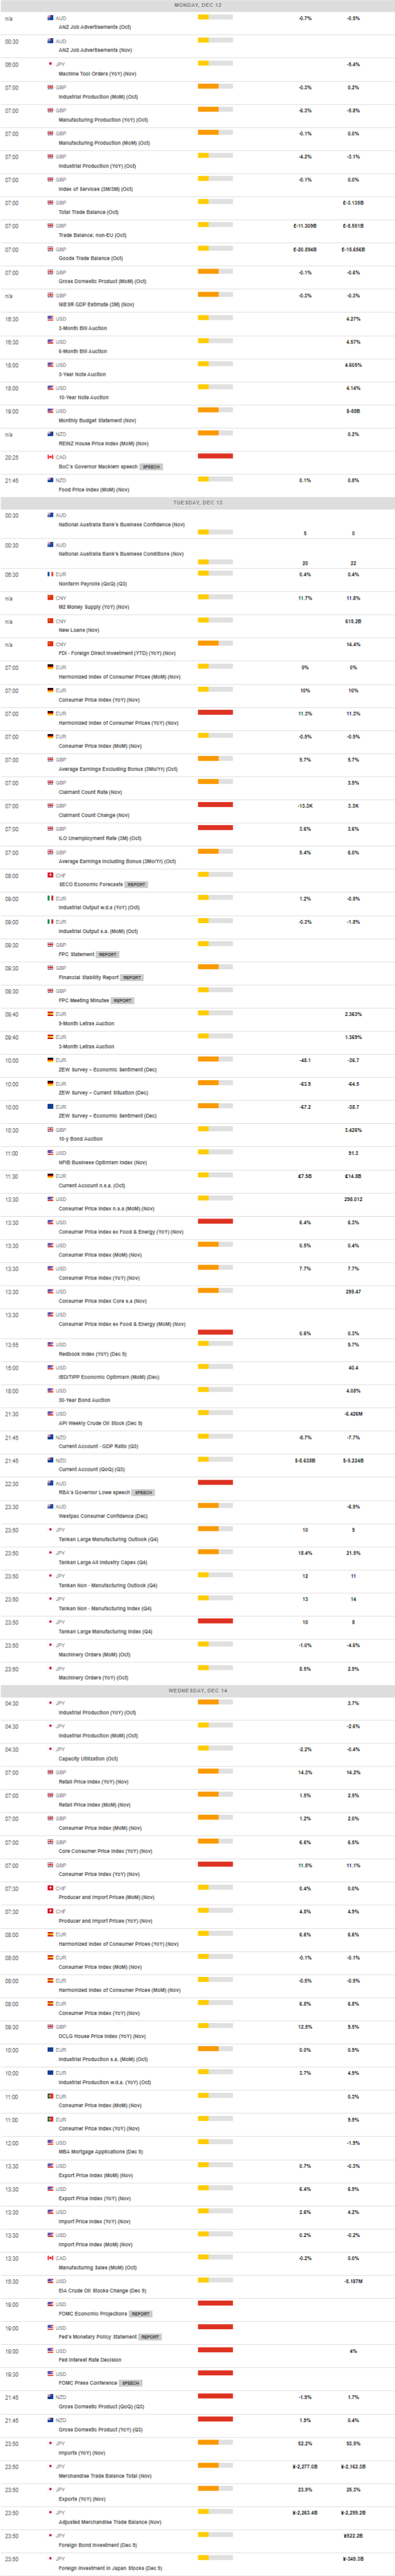
MACROECONOMIC EVENTS
All Information & Updates provided by:

All information relating to the financial markets available on this page has been prepared and issued by FXStreet (Forexstreet SL, Spain, Reg: B62498233) on the basis of publicly available information and all information believed to be reliable and does not conflict with Kuwaiti local laws, and all necessary care has been taken to before the company to ensure that the facts mentioned are correct from the source.
NCM Investment nor any of its directors or employees shall in any way be held responsible for the contents of this news, and the information contained on this page is intended only to provide clients with publicly available information and should not be construed as investment advice, report or analysis and/or constitute an offer or invitation to buy or sell financial instruments of any kind.
RISK WARNING: Forex and CFDs are highly risky leveraged products, as losses can exceed deposits. Please ensure you understand all the risks and take independent advice if necessary. NCM will segregate the clients based on the criteria of the regulator and its bylaws. NCM does not provide any advisory service; the material published does not constitute advice or a recommendation for a transaction in any financial instrument. NCM accepts no responsibility for any use of the content presented and any consequences of that use. Anyone acting on the information provided does so at their own risk.