
- Contact Us:
-

-

-

-


Daily Market Updates
13 Dec 2022
EURUSD
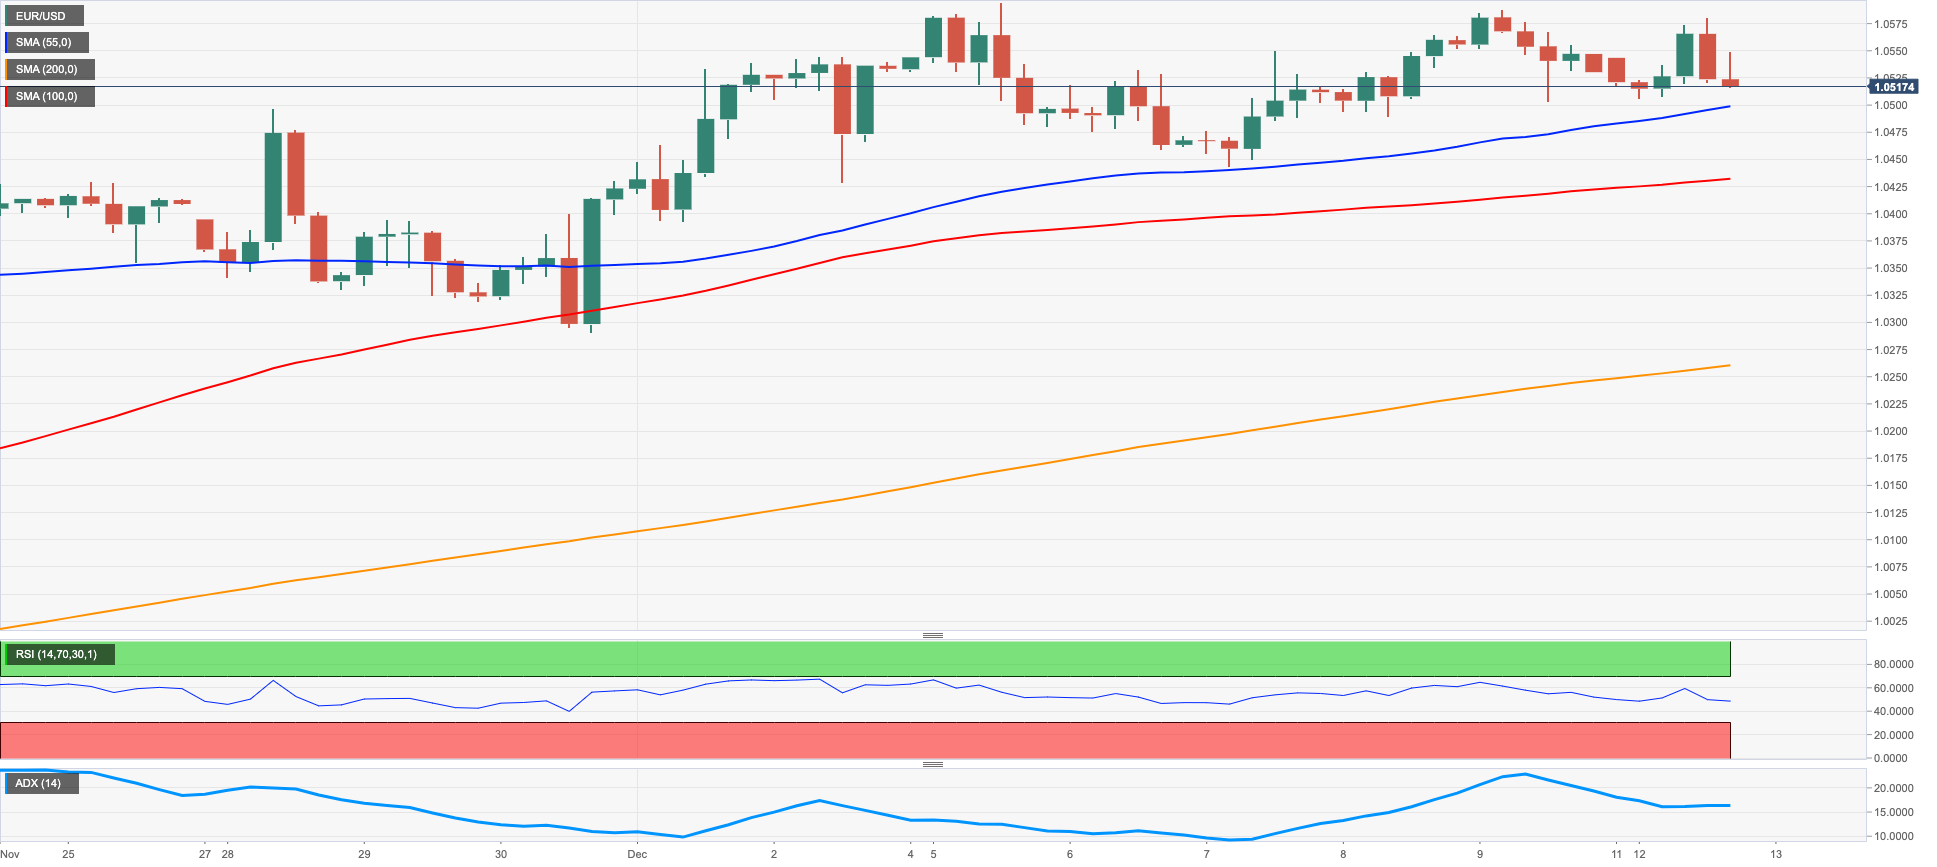
EUR/USD saw its downside renewed on Monday, adding to the poor performance witnessed at the end of last week. That said, the pair managed to regain the 1.0580 region earlier in the session, just to deflate afterwards in tandem with another U-turn in the dollar, all at the start of a week dominated by central banks’ gatherings.
Back to the greenback, the USD Index (DXY) reclaimed the area above the 105.00 mark and extended Friday’s small gains, underpinned at the same time by the march higher in US yields across the curve amidst the firm conviction of a 50 bps interest rate hike by both the Fed and the ECB later in the week.
In the euro docket, the only release worth mentioning was Spain’s Consumer Confidence, which improved to 60.5 for the month of November (from 54.7).
The US calendar was empty on Monday, while the publication of the November’s inflation figures tracked by the CPI will take centre stage on Tuesday.
There are no changes to the topside in EUR/USD, as the spot continues to target the December high at 1.0594 (December 5) ahead of the weekly top at 1.0614 (June 27). The surpass of this level could pave the way to a probable visit to the June peak at 1.0773 (June 9) seconded by the May high at 1.0786 (May 30). Alternatively, there is initial contention at the weekly low at 1.0443 (December 7) prior to the key 200-day SMA at 1.0349 and the weekly low at 1.0290 (November 30). In case of a deeper drop, the pair could challenge another weekly low at 1.0222 (November 21) ahead of the provisional 55- and 100-day SMAs at 1.0079 and 1.0066, respectively. The daily RSI grinded a tad lower below the 64 yardstick.
Resistance levels: 1.0588 1.0594 1.0614 (4H chart)
Support levels: 1.0503 1.0489 1.0443 (4H chart)
USDJPY
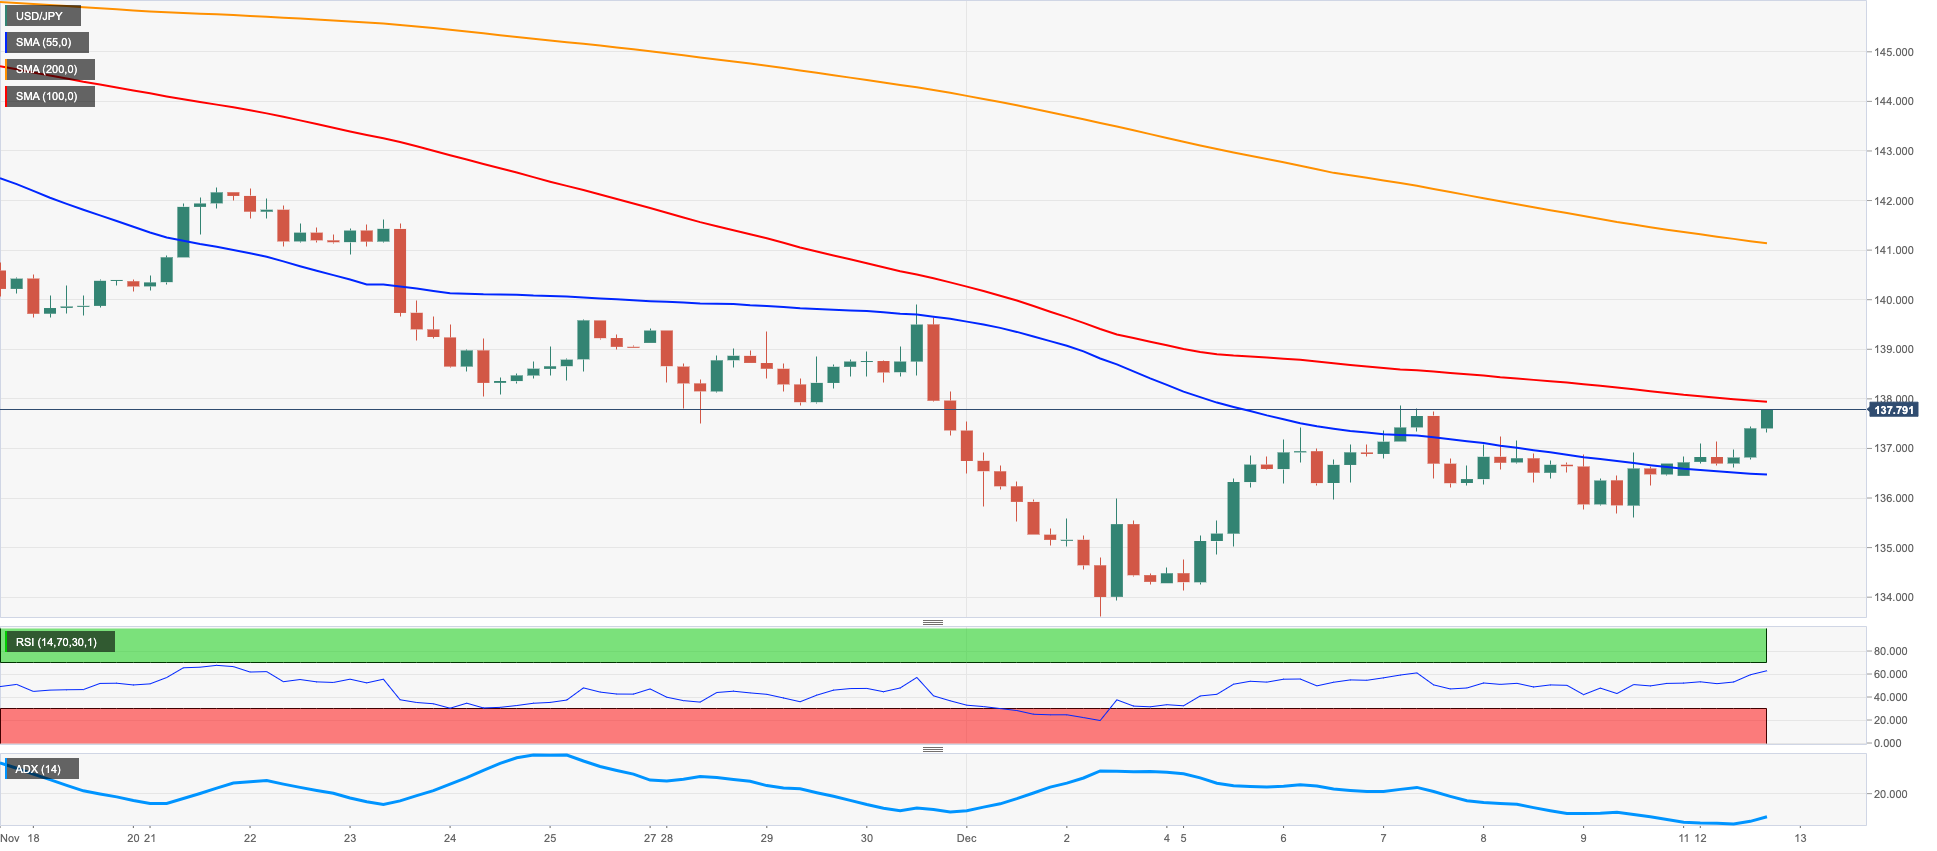
USD/JPY flirted with multi-session peaks near 137.80 at the beginning of the week, at the same time looking to break above the consolidative mood that prevailed in past sessions.
The rebound in the greenback in tandem with extra gains in US yields across the curve was enough to propel the spot to the upper end of the recent range and trade at shouting distance from the key 138.00 hurdle on Monday.
On another front, rumours around the BoJ saw Deputy Chief Cabinet Secretary Kihara signaling that Board members Amamiya and Nakaso could succeed Kuroda at the helm of the central bank.
Interesting session in the domestic calendar after the BSI Large Manufacturing contracted 3.6% QoQ in Q4 and Producer Prices rose more than estimated 0.6% MoM in November and 9.3% vs. the same month of 2021. Finally, Machine Tool Orders contracted at an annualized 7.8% during last month.
Immediately to the upside in USD/JPY now comes the weekly high at 137.85 (December 7) followed by another weekly top at 139.89 (November 30). North from here emerges the round level at 140.00 ahead of the interim 100-day SMA at 141.08 and the weekly peak at 142.25 (November 21). By contrast, the always-relevant 200-day SMA at 135.14 offers initial contention before the December low at 133.61 (December 2) and the August low at 130.39 (August 2), all preceding the key round level at 130.00. The daily RSI advanced to the vicinity of the 43 barrier.
Resistance levels: 137.78 137.85 139.89 (4H chart)
Support levels: 135.60 133.61 132.55 (4H chart)
GBPUSD
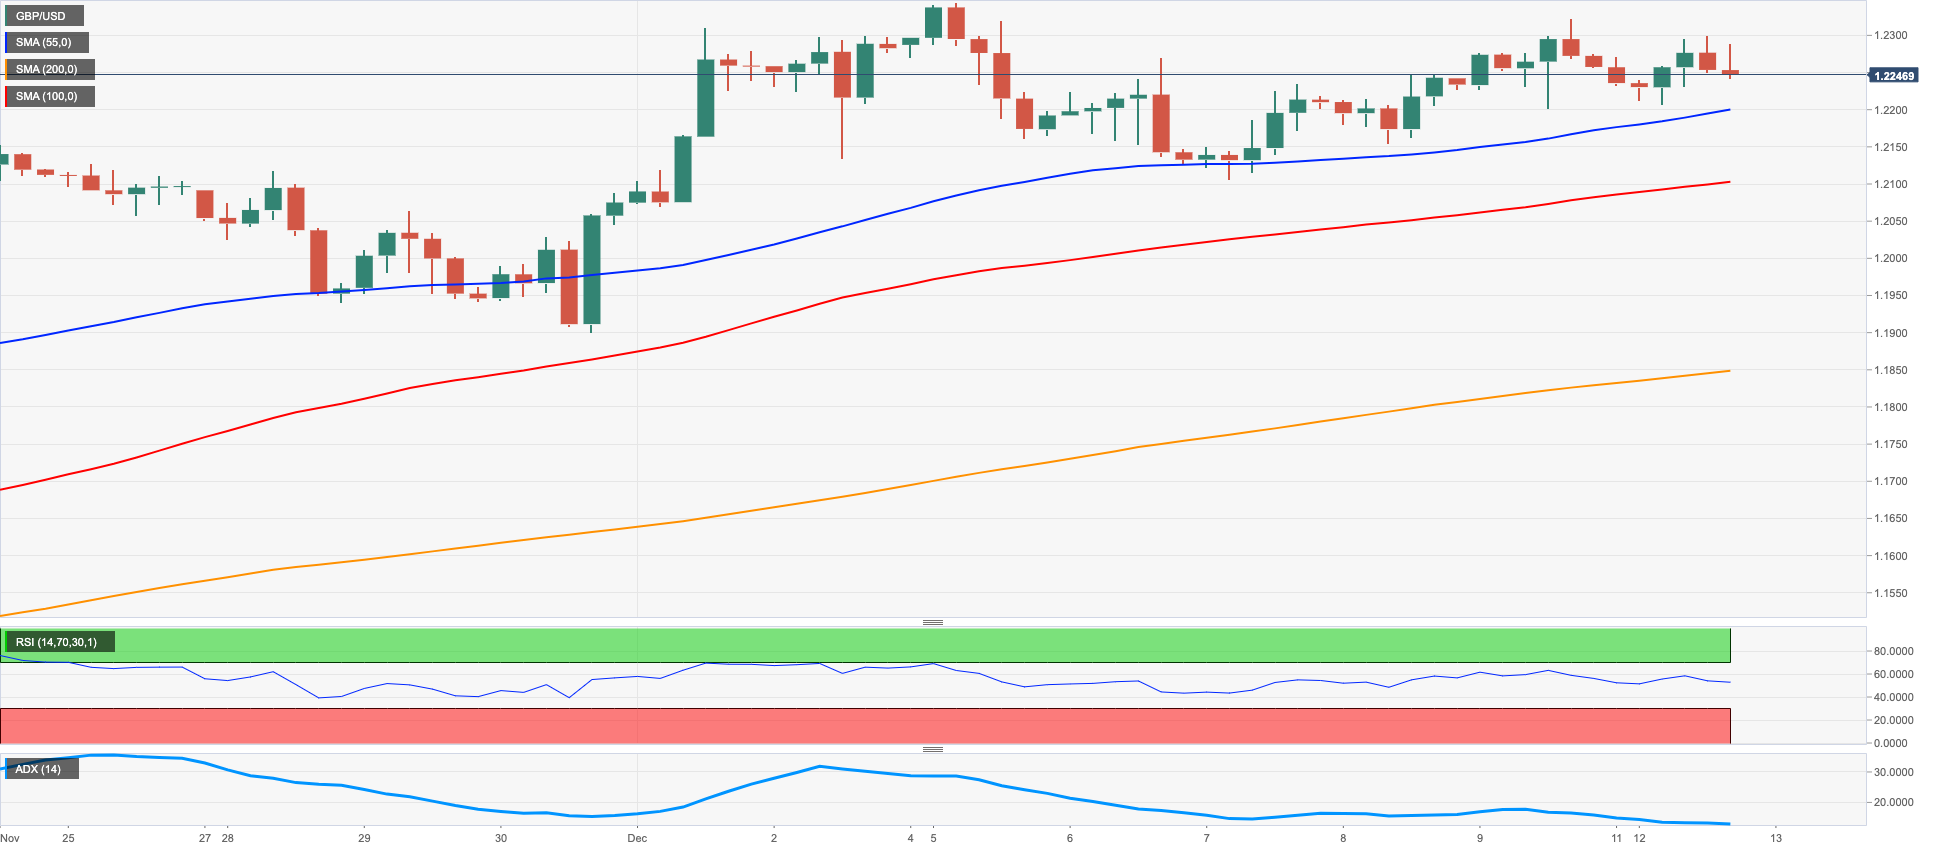
The continuation of the upside momentum in the greenback sponsored the first negative session in GBP/USD after three daily upticks in a row.
Indeed, Cable faltered in the area just shy of 1.2300 the figure on Monday and sparked a noticeable drop soon afterwards that met contention near the 1.2200 neighbourhood.
The downbeat mood in the Sterling came in contrast to positive results from the UK calendar for the month of October, where the GDP 3-Month Avg contracted less than expected by 0.3% and the GDP expanded 1.5% from a year earlier and 0.3% vs. the previous month. Further results saw the trade deficit shrink a tad to £14.476B and Industrial Production and Manufacturing Production contract 2.4% YoY and 4.6% over the last twelve months. Finally, the NIESR Monthly GDP Tracker contracted 0.3% in November.
The British pound is expected to enter a more cautious trade in the next hours ahead of the key BoE event on Thursday, where the central bank is forecast to raise the policy rate by 50 bps.
Further upside in GBP/USD should keep the focus on the December high at 1.2344 (December 5) prior to the weekly top at 1.2405 (June 16). Further up, there are no resistance levels of note until the May peak at 1.2666 (May 27) ahead of the 200-week SMA at 1.2935 and the psychological 1.3000 yardstick. In the opposite direction, the 200-day SMA at 1.2114 should hold the initial test seconded by the weekly low at 1.1900 (November 30). Further downside could retest the interim 100- and 55-day SMAs at 1.1667 and 1.1594, respectively before the November low at 1.1142 (November 4) and the weekly low at 1.1059 (October 21). The daily RSI deflated marginally to the sub-64 region.
Resistance levels: 1.2322 1.2344 1.2405 (4H chart)
Support levels: 1.2205 1.2154 1.2106 (4H chart)
AUDUSD
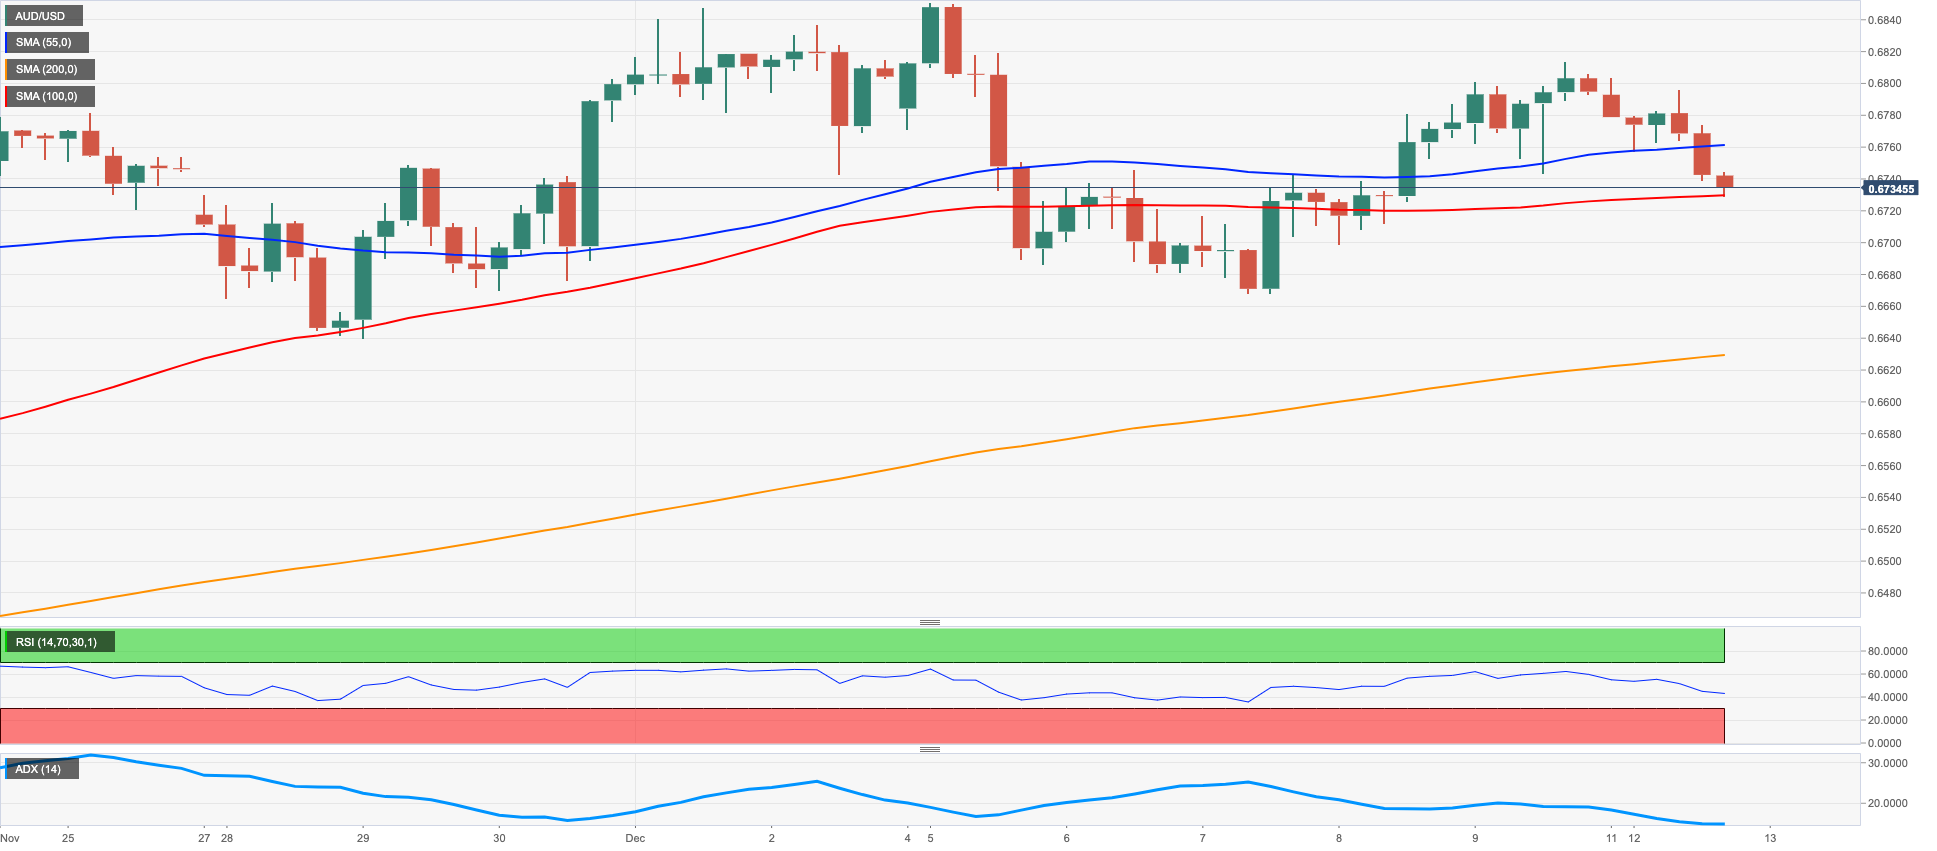
Rollercoaster session for AUD/USD after it flirted with the 0.6800 mark earlier on Monday's session, just to drop to the 0.6730/25 band towards the end of the day in response to the late bounce in the greenback.
Indeed, the pick-up in the demand for the dollar prevented the pair from extending the upside for the fourth session in a row at the beginning of the week, while the mixed note in the commodity complex also seems to have added to the decline in the pair. On this, copper prices added to Friday’s pullback, while prices of the iron ore managed well to keep the bid bias.
There were no data releases Down Under on Monday, whereas the Consumer Confidence Index gauged by Westpac will take centre stage on December 13.
If the corrective decline gathers momentum, then AUD/USD could revisit the weekly low at 0.6668 (December 7) ahead of weekly lows at 0.6640 (November 29) and 0.6584 (November 21). A move below the latter exposes a potential drop to the 55-day SMA at 0.6524 prior to the weekly low at 0.6386 (November 10). Just the opposite, the next up barrier aligns at the December peak at 0.6850 (December 5) ahead of the 200-day SMA at 0.6904 and the September high at 0.6916 (September 13). The breakout of this region could open the door to the psychological 0.7000 level prior to the weekly top at 0.7008 (August 26) and the August peak at 0.7136 (August 11). The daily RSI dropped to the sub-59 region.
Resistance levels: 0.6813 0.6850 0.6916 (4H chart)
Support levels: 0.6728 0.6668 0.6640 (4H chart)
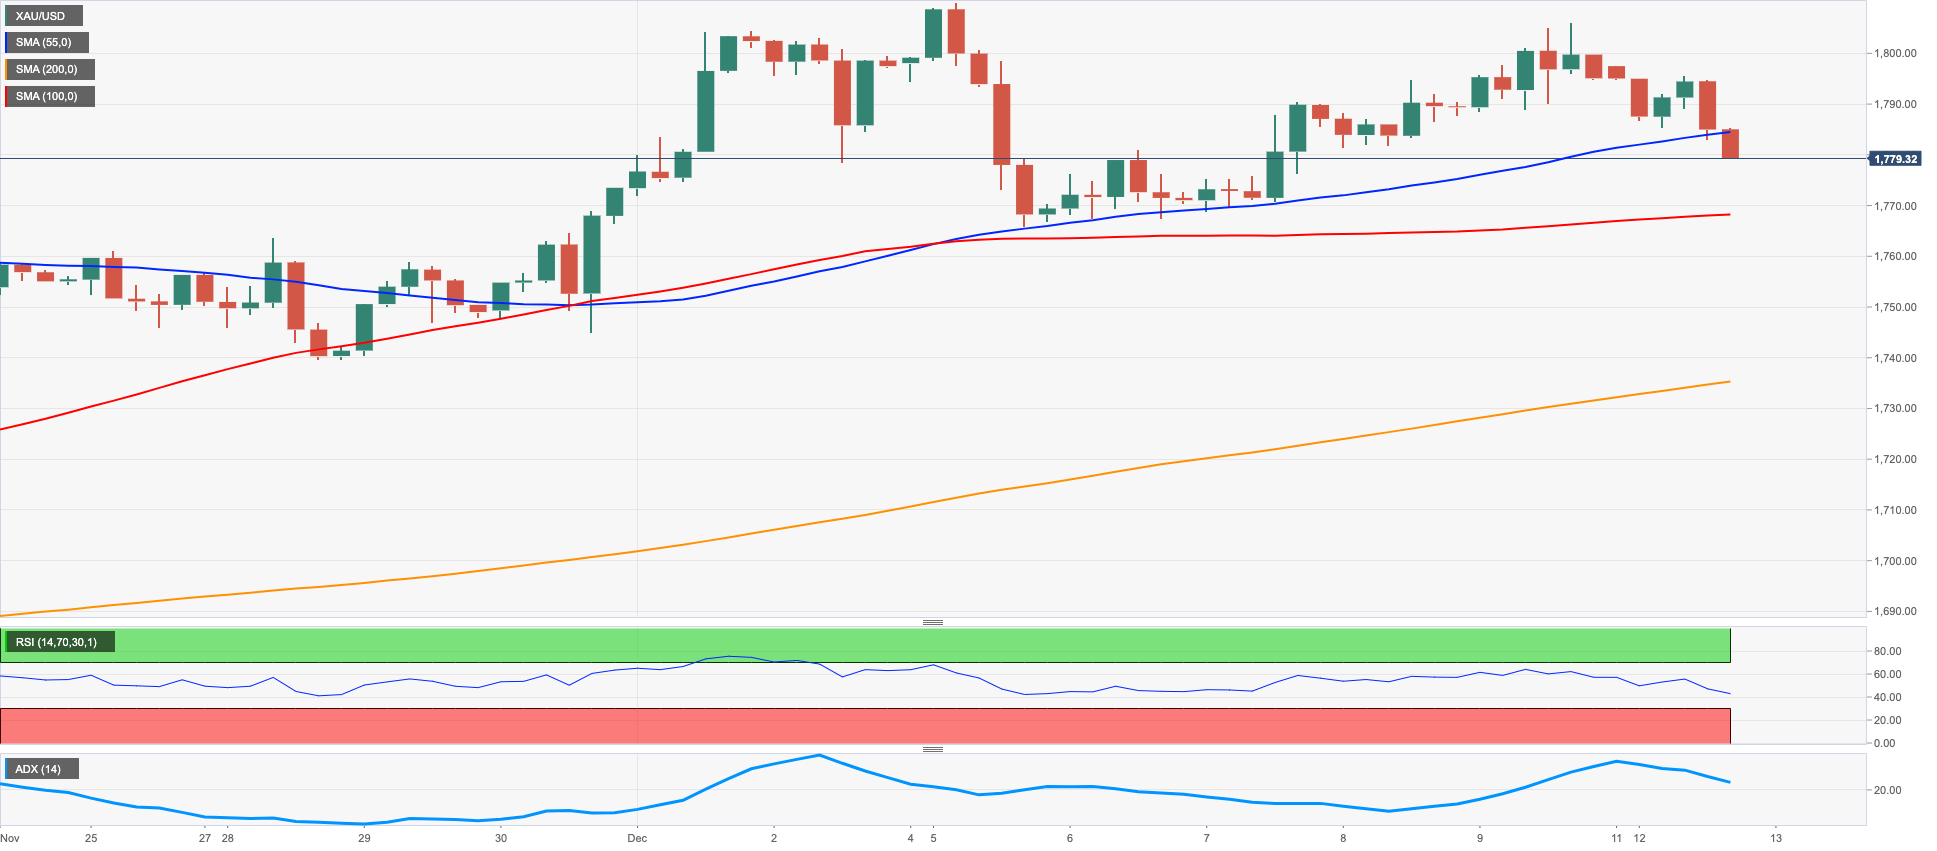
GOLD
Gold prices dipped to 3-day lows in the $1,780 region per ounce troy in response to the rebound in the greenback and the continuation of the upside momentum in US yields across the curve.
Indeed, the greenback traded mostly on the defensive, although it regained upside traction following the opening bell in Wall St. and was later supported by extra gains in US yields.
It is worth mentioning that the precious metal should keep trading within a cautious note ahead of the publication of the November’s inflation figures tracked by the CPI and the 2-day FOMC gathering, both events starting on Tuesday.
Further correction in gold could revisit the December low at $1,765 (December 5) ahead of the weekly low at $1,727 (November 23) and the provisional 100- and 55-day SMAs at $1,718 and $1,708, respectively. Below this zone emerges the 2022 low at $1,614 (September 28) seconded by the round level at $1,600. On the flip side, there is an initial up barrier at the December top at $1,810 (December 5) prior to the June peak at $1,879 (June 13) and the May high at $1,909 (May 5).
Resistance levels: $1,795 $1,806 $1,810 (4H chart)
Support levels: $1,779 $1,765 $1,744 (4H chart)
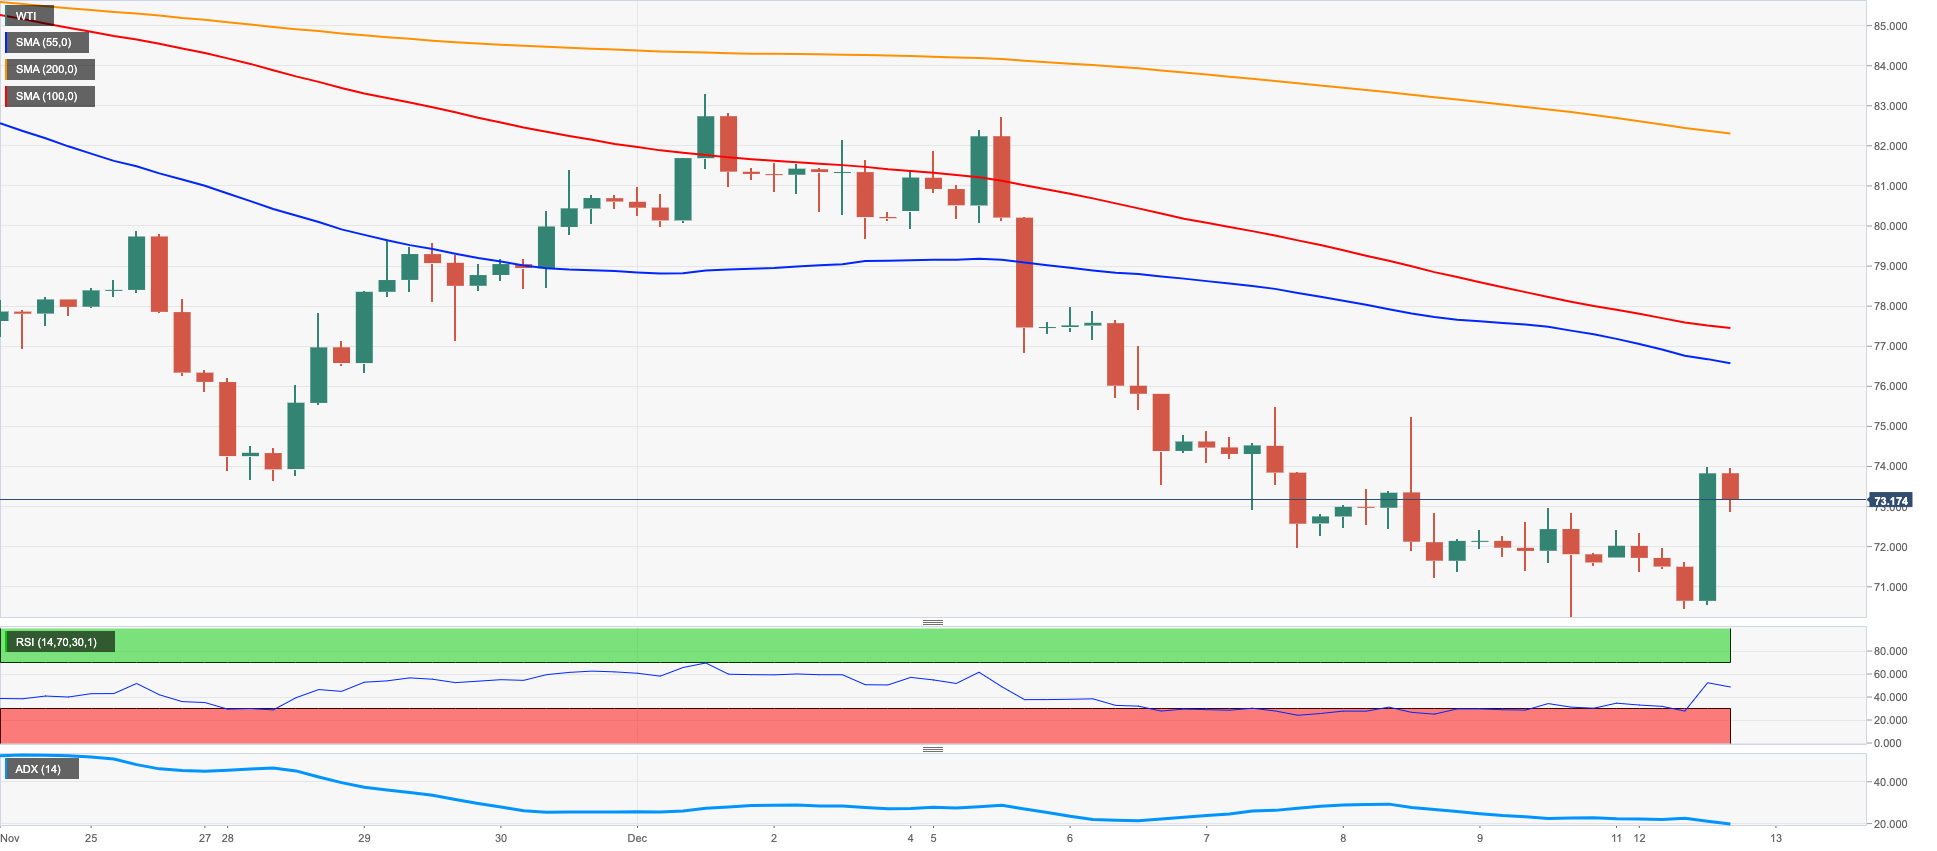
CRUDE WTI
WTI prices rose to 2-day highs and flirted with the $74.00 mark per barrel on Monday following supply concerns, which were particularly exacerbated following the Keystone pipeline shutdown.
In addition, prices also found another excuse to bounce off recent YTD lows near the key $70.00 level in the Russian threats to cut its oil output following the recent EU/G7 price cap on Russian crude oil.
In addition, further easing of the zero-COVID policy in China added to the positive prospects around a rebound in the economic activity and the consequent increase in the demand for the commodity.
Prices of the WTI remain under pressure despite Monday’s rebound. Against that, the loss of the key round level at $70.00 could prompt the weekly low at $66.15 (December 20 2021) to re-emerge on the horizon ahead of the 200-week SMA at $65.07 and the December 2021 low at $62.46 (December 2). On the other hand, the $80.00 mark per barrel comes first before the December high at $83.32 (December 1) and the temporary 55- and 100-day SMAs at $83.62 and $86.14, respectively. The surpass of this region exposes the $90.08 level (November 11) ahead of the November peak at $93.73 and the 200-day SMA at $96.61.
Resistance levels: $73.96 $75.41 $77.86 (4H chart)
Support levels: $70.07 $68.55 $66.11 (4H chart)
DOW JONES
US equities started the week with a smile and left behind Friday’s retracement bolstered by gains in software giant Microsoft and ahead of the publication of US CPI (Tuesday) and the FOMC event (Wednesday).
In fact, investors appeared optimistic ahead of the release of November’s inflation figures, while consensus expects the Fed to raise rates by 50 bps and announce a slower pace of the normalization process going ahead.
Regarding consumer prices, the year-ahead inflation is expected at 5.2% (from 5.9% in the previous month) and the 5-year inflation forecast is seen at 2.3% (from 2.4%), both prints for the month of November and according to the NY Fed survey
That said, the Dow Jones gained 0.96% to 33,801, the S&P500 advanced 0.67% to 3,960 and the tech-heavy Nasdaq Composite rose 0.38% to 11,046.
Further rebound in the Dow Jones continues to target the December high at 34,595 (December 1) ahead of the April top at 35,492 and the February peak at 35,824 (February 9). Contrarily, the December low at 33,418 (December 6) should hold the initial test followed by the weekly low at 33,239 (November 17) and ahead of the key 200-day SMA at 32,457. The loss of the latte could put a potential test of the interim 100-day SMA at 32,108 back on the investors’ radar prior to the November low at 31,727 (November 3). The daily RSI rebounded to the proximity of 55.
Top Performers: Boeing, Microsoft, Home Depot
Worst Performers: Amgen, 3M, Merck&Co
Resistance levels: 33,899 34,595 35,492 (4H chart)
Support levels: 33,418 33,239 32,478 (4H chart)
-638064695764344401.png)
MACROECONOMIC EVENTS

All Information & Updates provided by:

All information relating to the financial markets available on this page has been prepared and issued by FXStreet (Forexstreet SL, Spain, Reg: B62498233) on the basis of publicly available information and all information believed to be reliable and does not conflict with Kuwaiti local laws, and all necessary care has been taken to before the company to ensure that the facts mentioned are correct from the source.
NCM Investment nor any of its directors or employees shall in any way be held responsible for the contents of this news, and the information contained on this page is intended only to provide clients with publicly available information and should not be construed as investment advice, report or analysis and/or constitute an offer or invitation to buy or sell financial instruments of any kind.
RISK WARNING: Forex and CFDs are highly risky leveraged products, as losses can exceed deposits. Please ensure you understand all the risks and take independent advice if necessary. NCM will segregate the clients based on the criteria of the regulator and its bylaws. NCM does not provide any advisory service; the material published does not constitute advice or a recommendation for a transaction in any financial instrument. NCM accepts no responsibility for any use of the content presented and any consequences of that use. Anyone acting on the information provided does so at their own risk.