
- Contact Us:
-

-

-

-


Daily Market Updates
14 Dec 2022
EURUSD
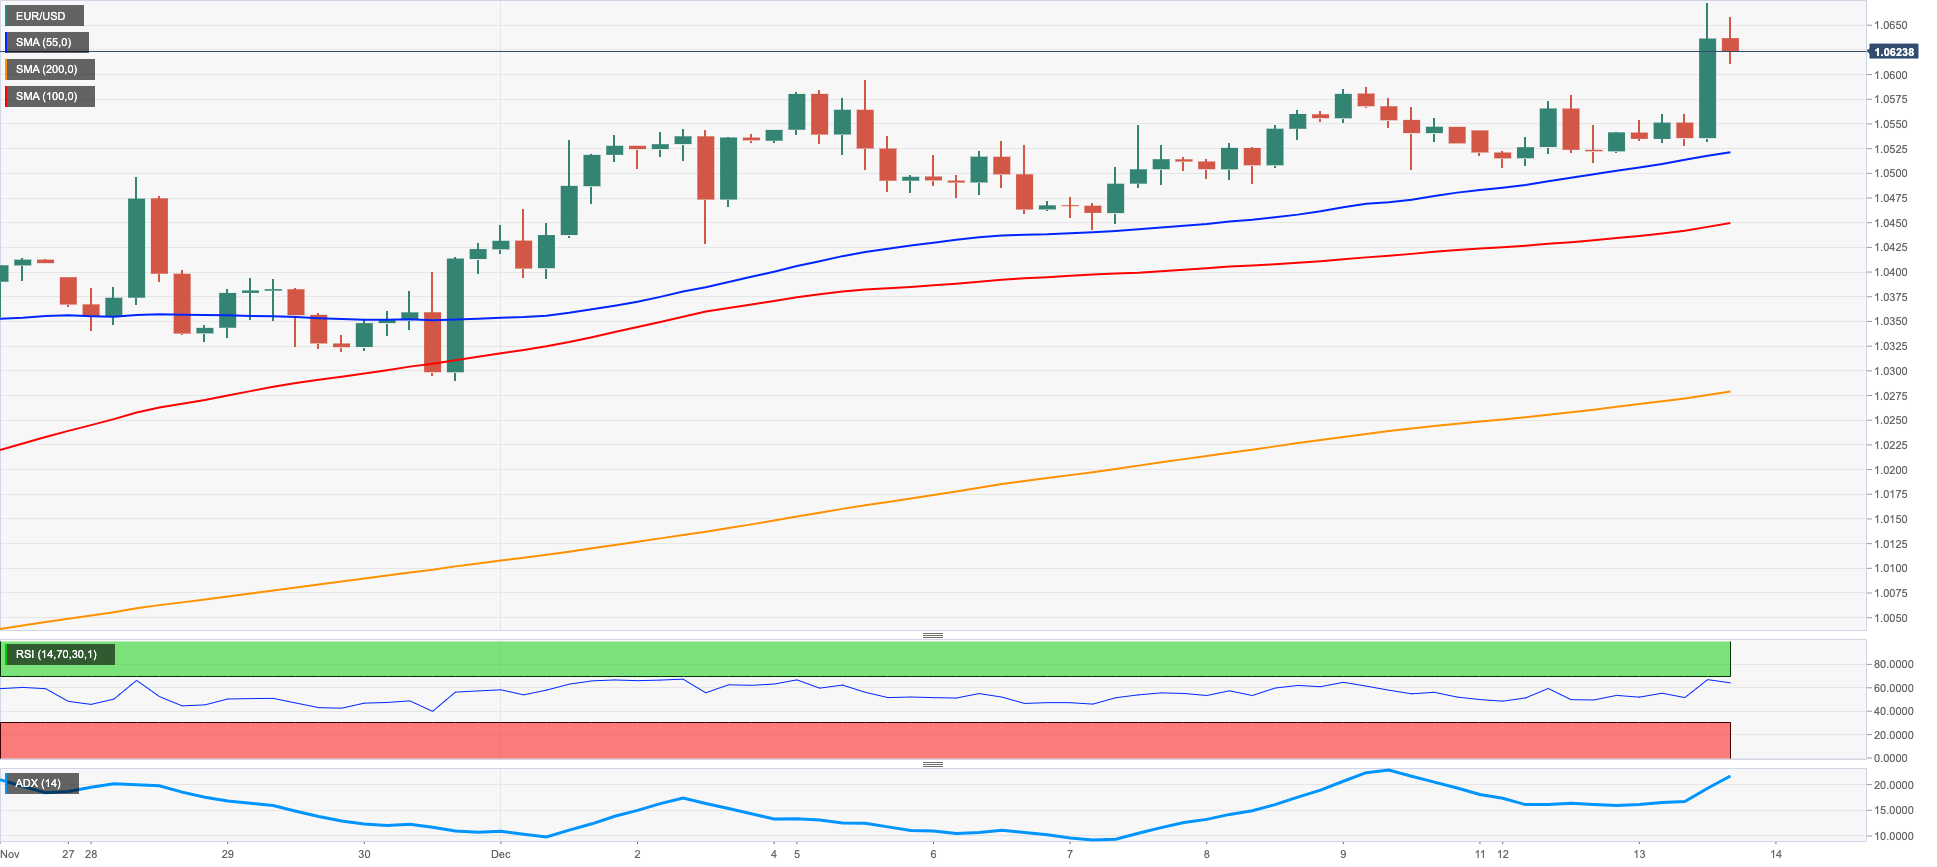
EUR/USD leapt to levels last seen back in early June around 1.0670 on the back of the abrupt sell-off in the greenback on turnaround Tuesday.
Indeed, the USD Index (DXY) saw its selling pressure accelerate to the 103.6jhgcjy0 region in response to further loss of traction of US inflation figures in November. On this, the CPI rose 7.1% YoY during last month and 6.0% YoY when it came to the Core CPI, both prints coming in below consensus.
November’s lower-than-expected inflation readings reaffirm the case for a 50 bps interest rate hike by the Federal Reserve at the December 14 event and opens the door to a 25 bps raise at the February gathering, all underpinning at the same time the Fed’s intentions to slow the pace of the ongoing normalization process.
Data wise in Germany, the final Inflation Rate showed the CPI rose 10% YoY in November and contracted 0.5% from a month earlier.
Still in Germany, the Economic Sentiment tracked by the ZEW institute improved to -23.3 for the current month and to -23.6 when it came to the broader Euroland.
In light of the recent price action, EUR/USD now faces the next up barrier at the June high at 1.0773 (June 9) ahead of the May top at 1.0786 (May 30) and the round level at 1.0800. Contrarily, the weekly low at 1.0443 (December 7) is expected to emerge as the initial test for bears before the key 200-day SMA at 1.0347 and the weekly low at 1.0290 (November 30). Down from here comes another weekly low at 1.0222 (November 21) prior to the interim 55- and 100-day SMAs at 1.0096 and 1.0071, respectively. The daily RSI poked with the overbought territory near 70.
Resistance levels: 1.0673 1.0773 1.0786 (4H chart)
Support levels: 1.0503 1.0489 1.0443 (4H chart)
USDJPY
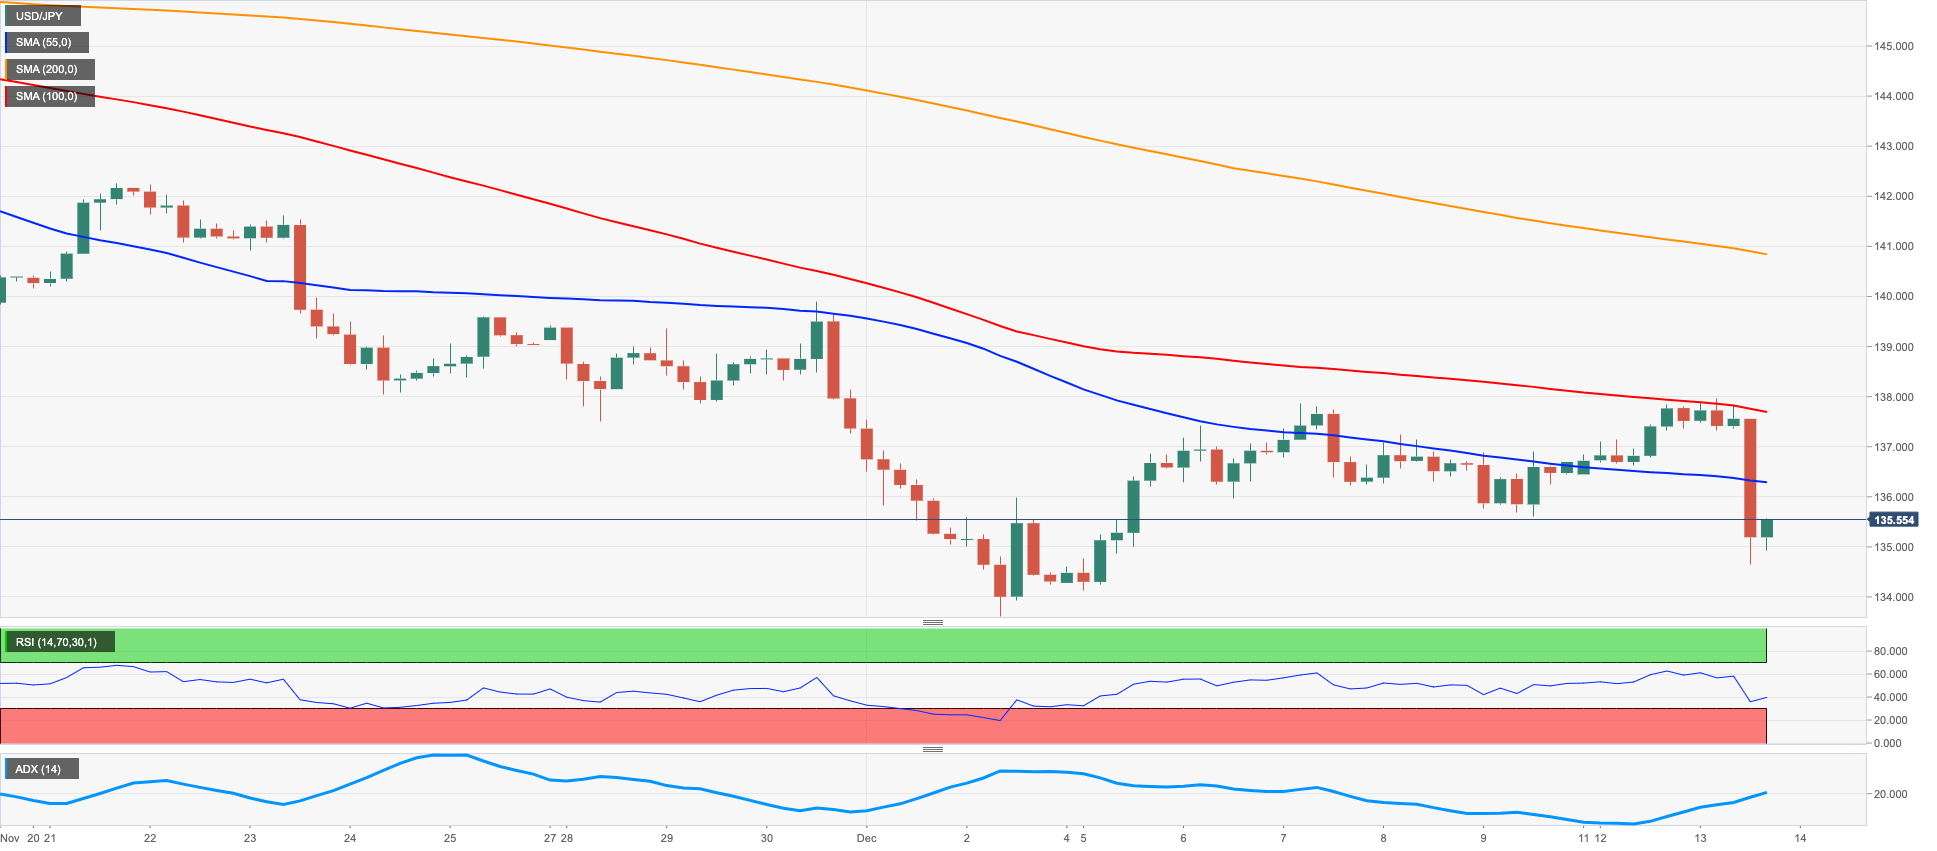
USD/JPY dropped to multi-session lows and flirted with the key 200-day SMA in the sub-135.00 region on Tuesday.
The sharp move lower in the pair came in response to the pronounced decline in the dollar as well as the marked correction lower in US yields across the curve, all in response to another drop in US inflation figures, this time for the month of November, and the likely scenario of a smaller interest rate hike in February (25 bps ?).
There were no data releases in Japan on Tuesday, leaving all the attention to a busy docket on Wednesday as the Tankan surveys, Machinery Orders and Industrial Production figures are all due.
Next on the upside for USD/JPY now appears the weekly peak at 139.89 (November 30) closely followed by the round level at 140.00 and the temporary 100-day SMA at 141.09. North from here turns up the weekly high at 142.25 (November 21) before the 55-day SMA at 143.19. In the opposite direction, the weekly low at 134.86 (December 13) appears as the initial support followed by the December low at 133.61 (December 2). South from here comes the August low at 130.39 (August 2) prior to the key round level at 130.00. The daily RSI eased to the vicinity of 35.
Resistance levels: 137.97 139.89 141.09 (4H chart)
Support levels: 134.65 133.61 132.55 (4H chart)
GBPUSD
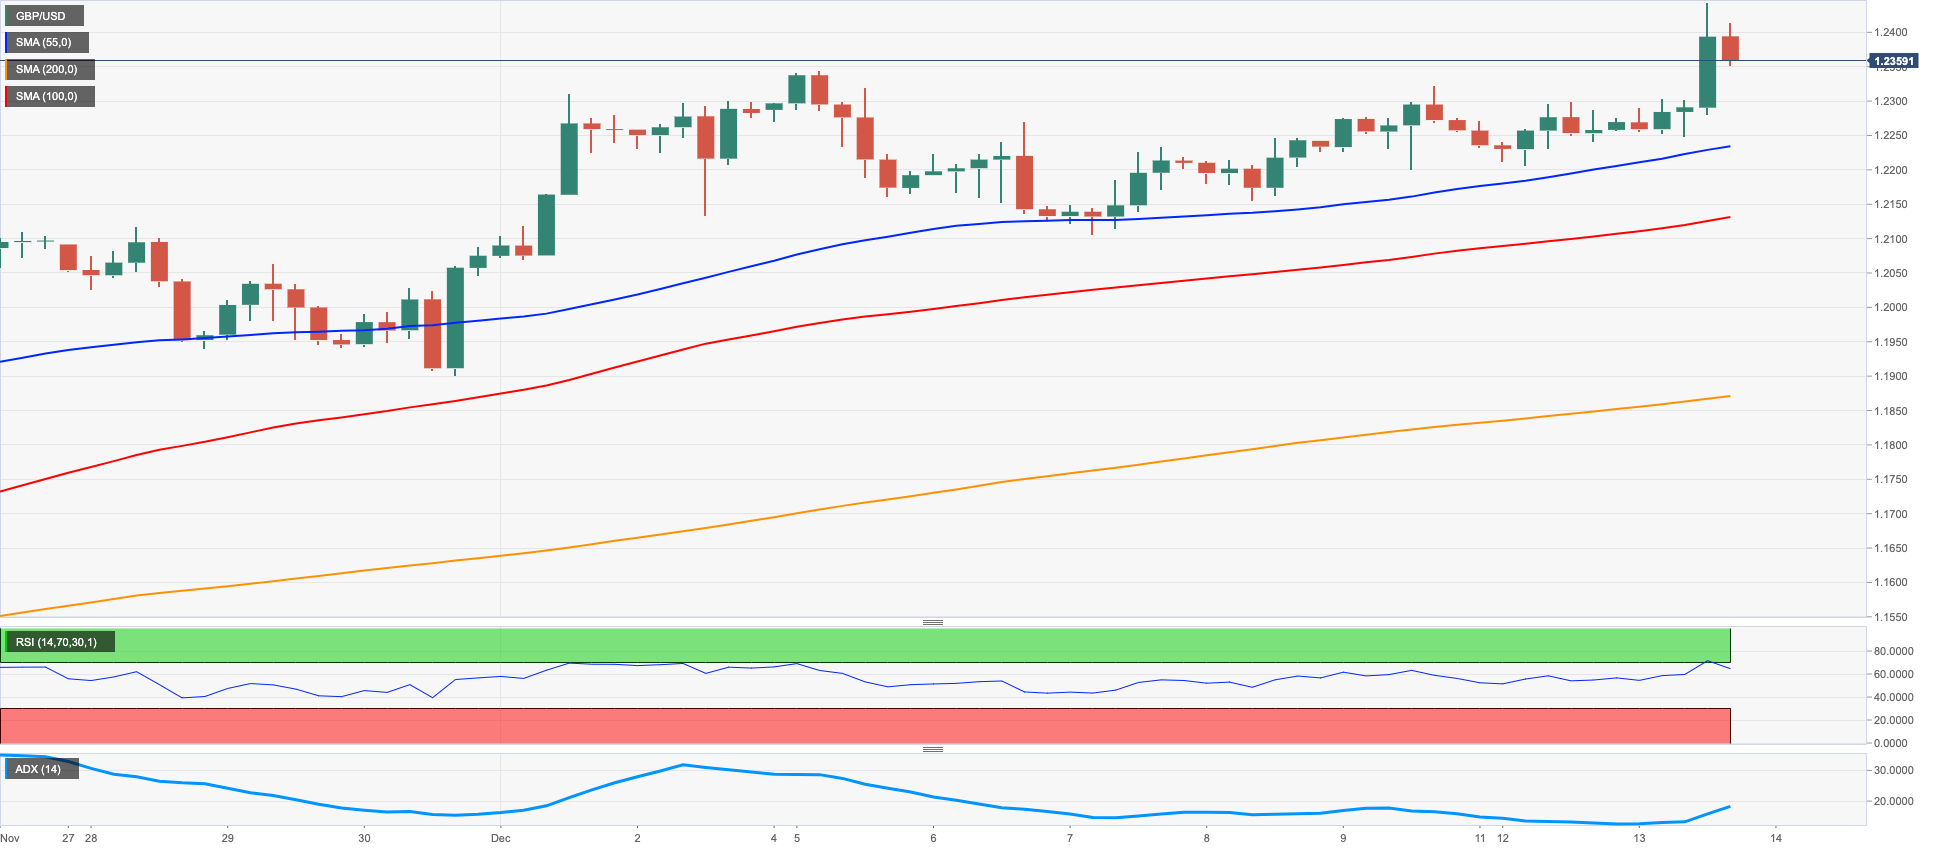
Following the price action in the risk complex, GBP/USD advanced to fresh 6-month highs north of the 1.2400 mark on Tuesday, always in response to the poor performance of the greenback.
In fact, the sentiment around the greenback rapidly deteriorated following lower-than-estimated US inflation figures for the month of November, dragging the USD Index (DXY) to fresh multi-month lows in the 103.70 region.
In the meantime, and later in the week, the recent upside in the British pound will be put to the test in light of the upcoming interest rate decision by the BoE (Thursday).
The UK’s Office for National Statistics published the labour market report, where the Employment Change increased by 37K persons in September, the Unemployment Rate held steady at 3.7% in October and Average Hourly Earnings inc. Bonus expanded 6.1% YoY in the three months to October. Finally, the Claimant Count Change rose by 30.5K people in November.
The continuation of the upside bias in GBP/USD now faces the immediate hurdle at the May high at 1.2666 (May 27) prior to the 200-week SMA at 1.2935, which also precedes the psychological 1.3000 mark. Alternatively, there is an initial support at the key 200-day SMA at 1.2110 followed by the weekly low at 1.1900 (November 30). The breach of this level carries the potential to accelerate losses to the provisional 100- and 55-day SMAs at 1.1669 and 1.1622, respectively prior to the November low at 1.1142 (November 4) and the weekly low at 1.1059 (October 21). The daily RSI rose beyond the 67.
Resistance levels: 1.2443 1.2599 1.2666 (4H chart)
Support levels: 1.2205 1.2154 1.2106 (4H chart)
AUDUSD
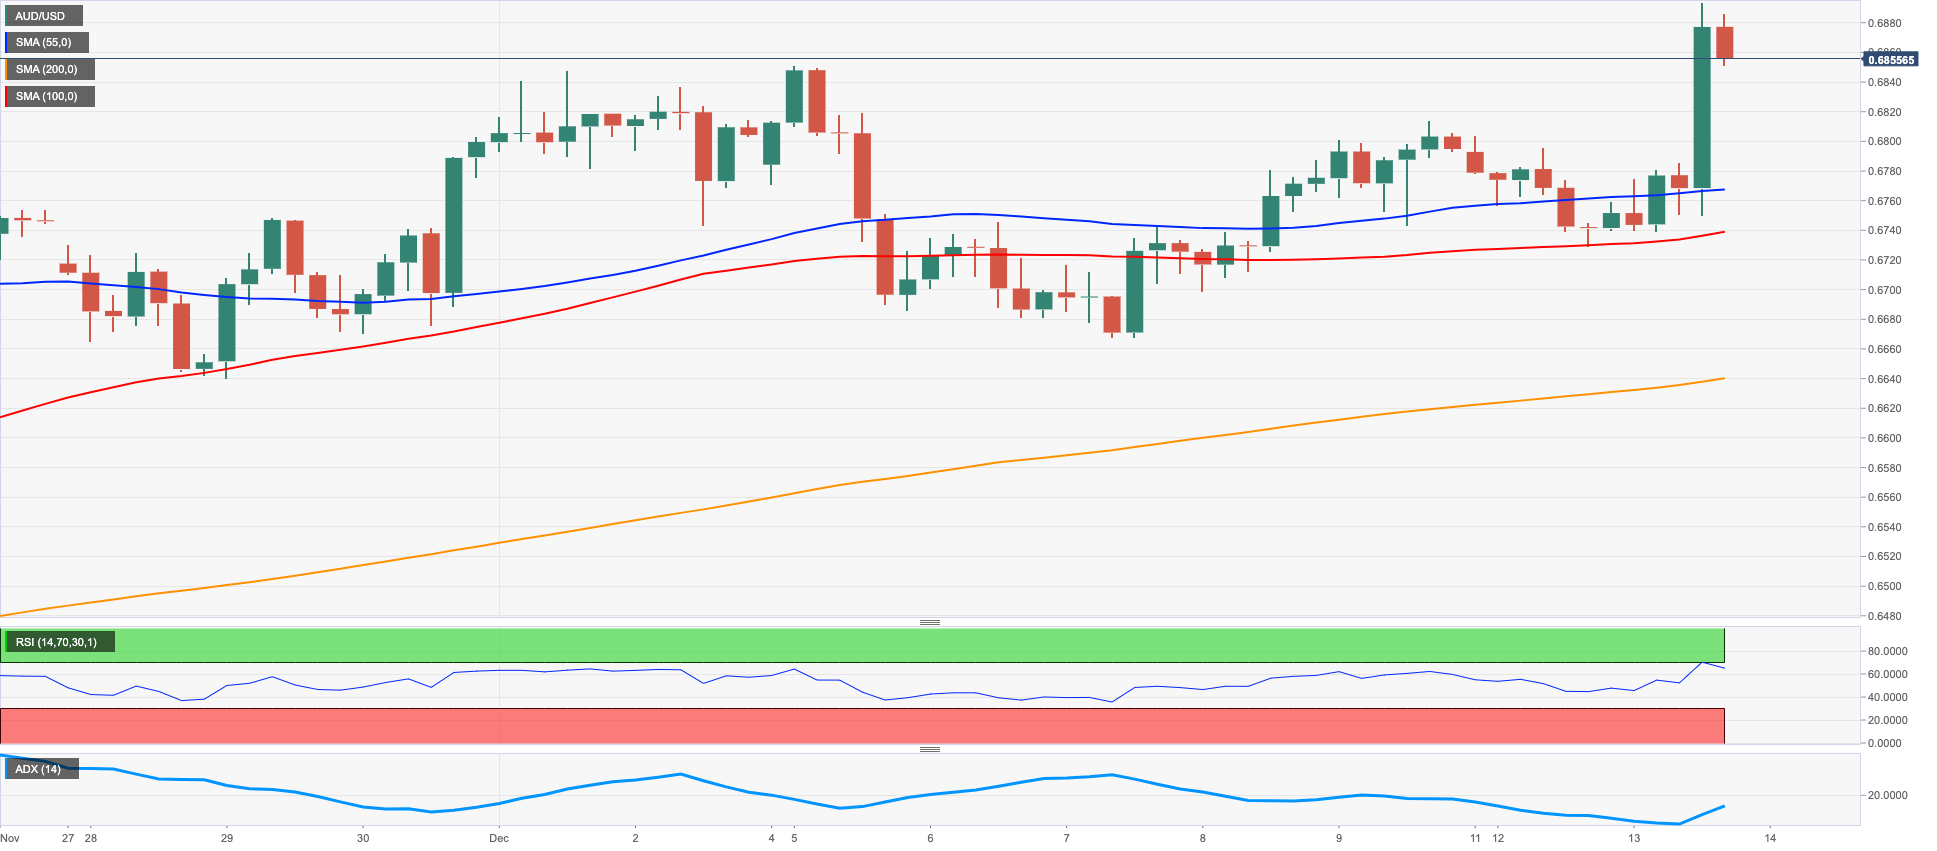
The mood around the greenback worsened further on Tuesday and allowed AUD/USD to climb to fresh 3-month peaks in levels just shy of 0.6900 the figure. In addition, the pair traded at shouting distance from the key 200-day SMA, today at 0.6903.
Also adding to the positive momentum in the Aussie dollar, copper prices reversed two daily drops in a row, although prices of the iron ore eased marginally to the $109.00 area per tonne.
It is worth recalling that recent gains in AUD have been propped up by easing zero-COVID restrictions in China, supporting at the same time prospects for the emergence of pent-up demand in the relatively short-term horizon.
In Oz, Westpac showed an improvement to 80 of its Consumer Confidence Index for the month of December (from 78).
Extra rebound in AUD/USD could now retest the key 200-day SMA at 0.6902, which appears closely followed by the September top at 0.6916 (September 13). Beyond this level aligns the psychological 0.7000 mark ahead of the weekly peak at 0.7008 (August 26) and the August high at 0.7136 (August 11). By contrast, the 100-day SMA at 0.6674 offers interim support prior to the weekly low at 0.6668 (December 7). Further down comes another weekly lows at 0.6640 (November 29) and 0.6584 (November 21) prior to the 55-day SMA at 0.6531 and the weekly low at 0.6386 (November 10). The daily RSI leapt past the 63 mark.
Resistance levels: 0.6893 0.6916 0.6956 (4H chart)
Support levels: 0.6728 0.6668 0.6640 (4H chart)
GOLD
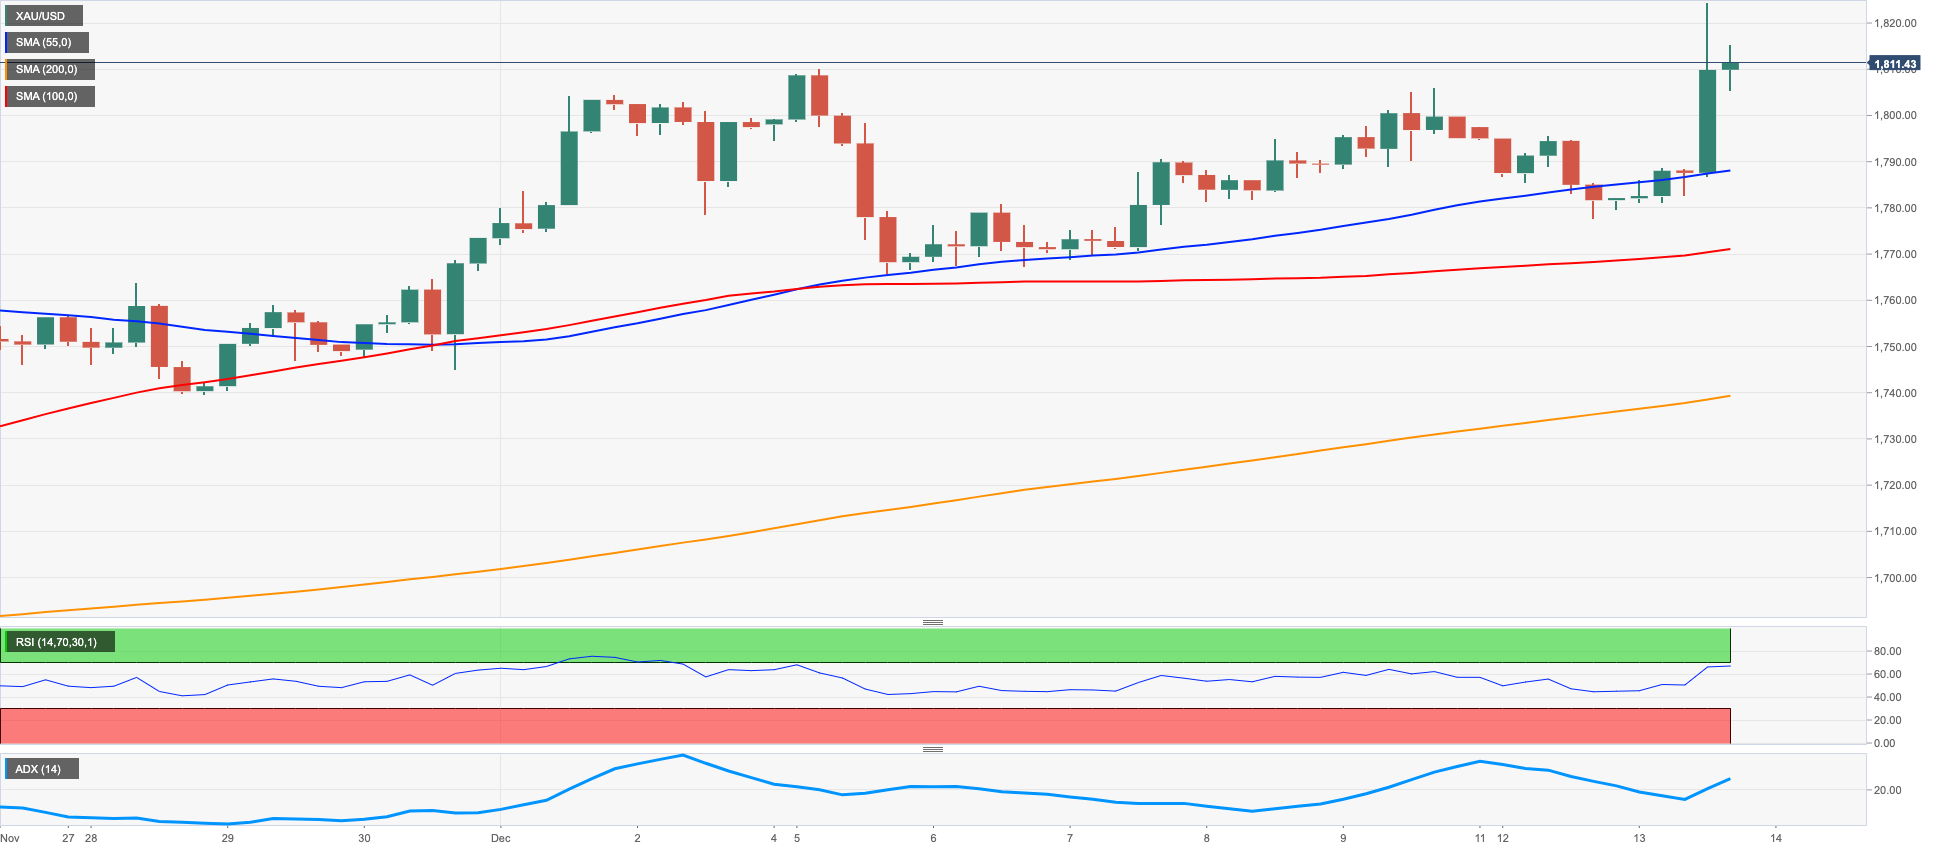
Prices of the ounce troy of the precious metal advanced to new 6-month tops around $1,820 on the back of the intense retracement in the greenback.
In addition, the marked decline in US yields across the curve also added to the move further north of the key $1,800 mark in the yellow metal.
The downside momentum in the dollar gathered extra steam after annual US inflation figures dropped further in November, bolstering the case for smaller interest rate hikes by the Fed in the next months.
Beyond the December peak at $1,820 (December 13), gold should meet the next hurdle of note at the June high at $1,879 (June 13) prior to the May top at $1,909 (May 5). Just the opposite, the December low at $1,765 (December 5) is expected to hold the initial test ahead of the weekly low at $1,727 (November 23) and the interim 100- and 55-day SMAs at $1,719 and $1,711, respectively. The breach of this region could put the 2022 low at $1,614 (September 28) back on the traders’ radar before the round level at $1,600.
Resistance levels: $1,824 $1,833 $1,841 (4H chart)
Support levels: $1,777 $1,765 $1,744 (4H chart)
CRUDE WTI
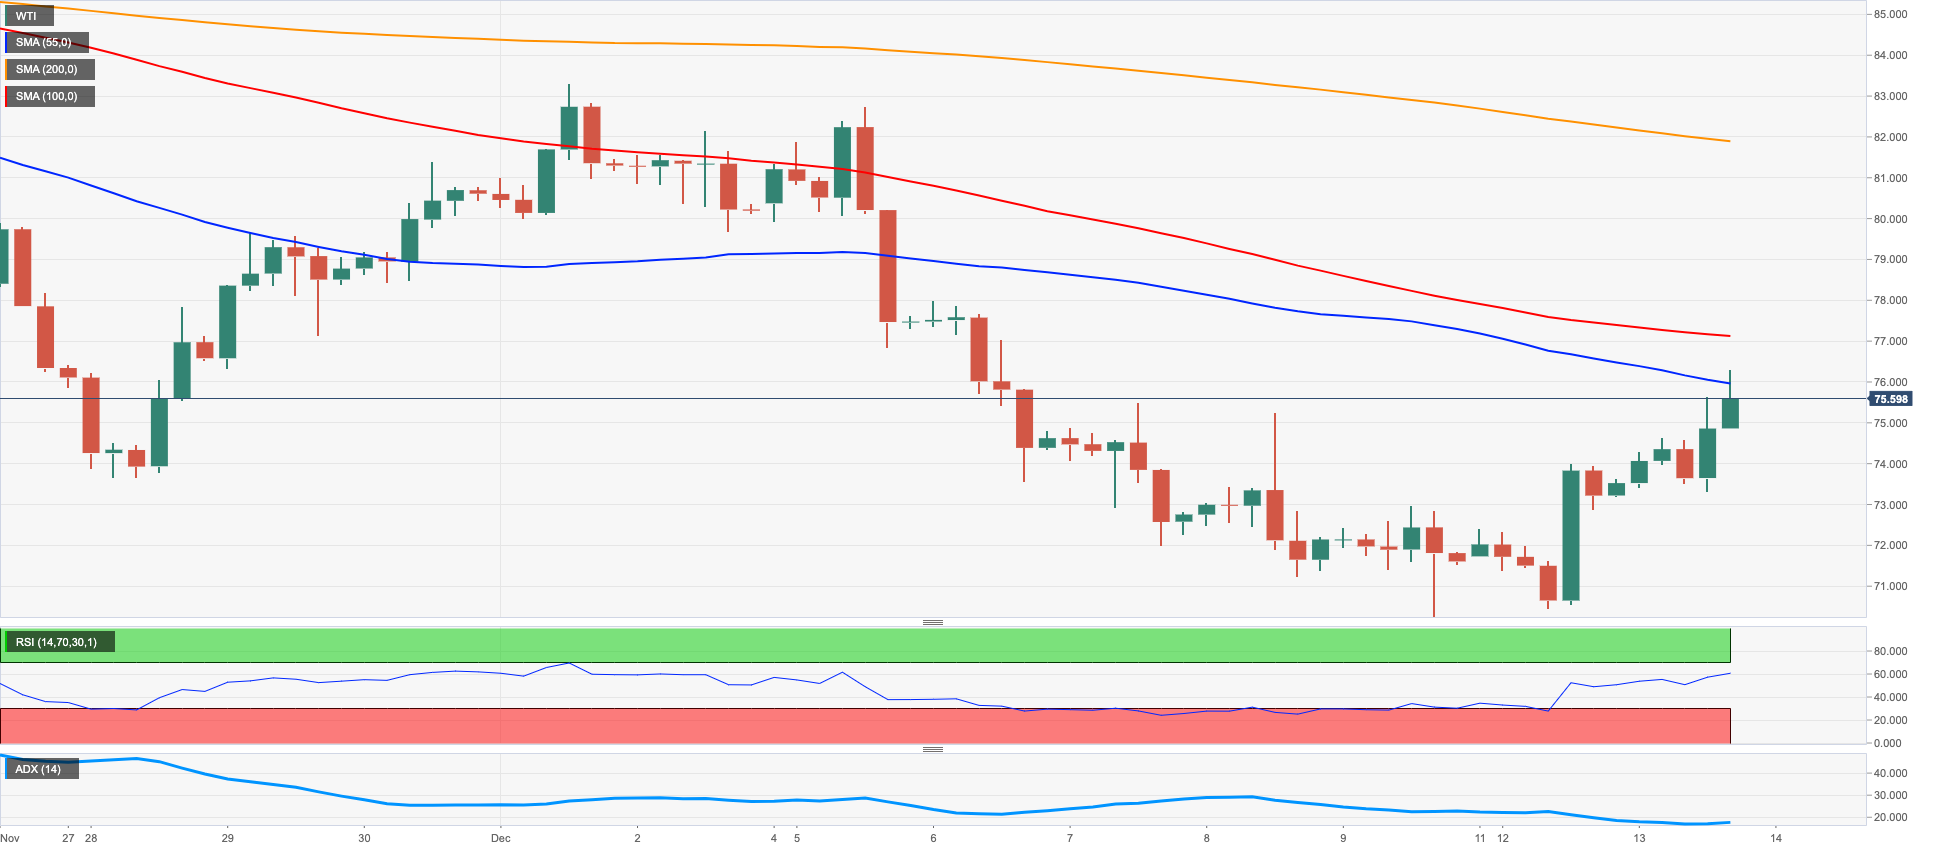
Prices of the barrel of the WTI rose to multi-day highs past the $75.00 mark on Tuesday on the back of the resumption of supply concerns among traders.
Adding to the upside pressure in the commodity, uncertainty remained in place around the probable restart of the activity in the Keystone pipeline, while further deceleration of the inflation in the US somewhat mitigated recession concerns.
News from the OPEC cited the cartel now expects the crude oil demand to drop by 140 kbpd in Q4 2022 and 410 kbpd in Q1 2023.
Later in the NA session, the API will report on US crude oil inventories in the week to December 9.
If WTI prices extend the recovery, the next target of note emerges at the key $80.00 mark per barrel ahead of the December top at $83.32 (December 1) and the interim 100-day SMA at $95.94. Beyond this region comes the $90.08 level (November 11) prior to the November high at $93.73 and the 200-day SMA at $96.39. On the contrary, if the commodity breaks below the key round level at $70.00 it could then challenge the weekly low at $66.15 (December 20 2021) before the 200-week SMA at $65.07 and the December 2021 low at $62.46 (December 2).
Resistance levels: $75.85 $82.31 $83.32 (4H chart)
Support levels: $70.07 $68.55 $66.11 (4H chart)
DOW JONES
Equities gauged by the Dow Jones faded the post-CPI surge to new 8-month tops around the 34,700 zone, although it managed well to keep the optimism intact in the first half of the week.
Indeed, November’s lower-than-expected US inflation figures lifted spirits among market participants and eased recession concerns as well as underpinned prospects of smaller interest rate hikes at future FOMC events.
In addition, a much weaker dollar and the marked pullback in US yields across the curve also favoured the upbeat mood around US stocks on turnaround Tuesday.
Against that, the Dow Jones rose 0.28% to 34,098, the S&P500 gained 0.68% to 4,017 and the tech-reference Nasdaq Composite advanced 1.03% to 11,258.
The Dow Jones needs to clear the December top at 34,712 (December 13) to allow for a probable visit to the April peak at 35,492 ahead of the February high at 35,824 (February 9). On the other hand, initial contention still lies at the December low at 33,418 (December 6) prior to the weekly low at 33,239 (November 17) and before the key 200-day SMA at 32,460. The breakdown of this region should expose a move to the November low at 31,727 (November 3). The daily RSI bounced past the 59 level.
Top Performers: Chevron, Merck&Co, Salesforce Inc
Worst Performers: UnitedHealth, Amgen, Visa A
Resistance levels: 34,712 35,492 35,824 (4H chart)
Support levels: 33,418 33,239 32,478 (4H chart)
-638065582268065512.png)
MACROECONOMIC EVENTS

All Information & Updates provided by:

All information relating to the financial markets available on this page has been prepared and issued by FXStreet (Forexstreet SL, Spain, Reg: B62498233) on the basis of publicly available information and all information believed to be reliable and does not conflict with Kuwaiti local laws, and all necessary care has been taken to before the company to ensure that the facts mentioned are correct from the source.
NCM Investment nor any of its directors or employees shall in any way be held responsible for the contents of this news, and the information contained on this page is intended only to provide clients with publicly available information and should not be construed as investment advice, report or analysis and/or constitute an offer or invitation to buy or sell financial instruments of any kind.
RISK WARNING: Forex and CFDs are highly risky leveraged products, as losses can exceed deposits. Please ensure you understand all the risks and take independent advice if necessary. NCM will segregate the clients based on the criteria of the regulator and its bylaws. NCM does not provide any advisory service; the material published does not constitute advice or a recommendation for a transaction in any financial instrument. NCM accepts no responsibility for any use of the content presented and any consequences of that use. Anyone acting on the information provided does so at their own risk.