
- Contact Us:
-

-

-

-


Daily Market Updates
15 Dec 2022
EURUSD
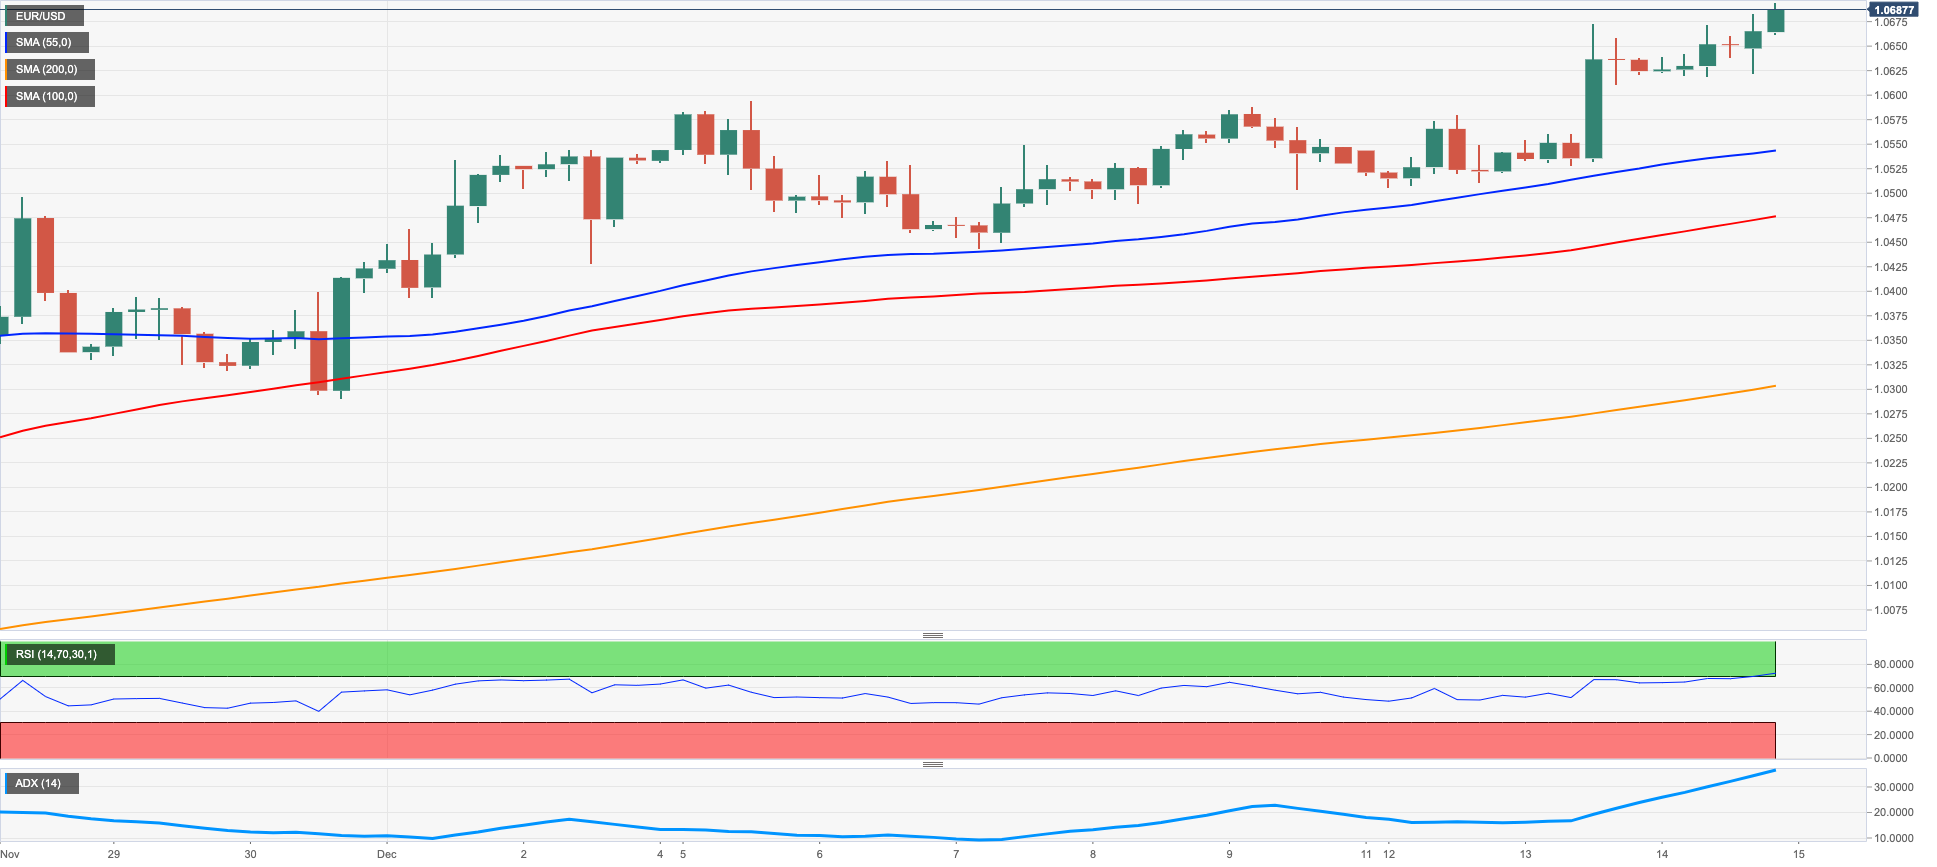
EUR/USD advanced for the third session in a row and consolidated further the recent breakout of the 1.0600 barrier on Wednesday.
The continuation of the upside bias in the pair came once again in response to another daily decline in the greenback, which forced the USD Index (DXY) to shed further ground and revisit the 103.50 region, an area last traded back in late June.
The downtrend in the dollar remained unchanged following the unanimous 50 bps interest rate hike by the Federal Reserve at its December event, taking the Fed Funds Target Range (FFTR) to 4.25%-4.50%. In addition, there were no surprises at the FOMC event nor at Chair Powell’s press conference.
The Committee’s statement saw the dots-plot revised up and it now sees the interest rate projection for the first year at 5.1% (from 4.6%), the second year at 4.1% (from 3.9%) and 3.1% for the third year (from 2.9%). In addition, the Fed sees inflation tracked by the PCE at 3.5% next year, 2.5% in 2024 and 2.1% in 2025. Regarding the GDP, the Fed expects the economy to expand 0.5% in 2023, 1.6% in 2024 and 1.8% in 2025.
At his usual press conference, Chief Powell reiterated the Fed’s pledge to bring inflation down to the 2.0% target, adding that ongoing rate hikes will be necessary to make monetary conditions more restrictive. Powell also noted that the economy has slowed significantly since 2021 and that the labour market remains extremely constrained and out of balance. He also said that it looks appropriate to slow the pace of the rate hikes to allow the Fed to better balance risks.
Powell also stressed that inflation risks remain tilted to the upside while inflation expectations appear stable. He expressed some optimism following lower consumer prices in the last couple of months, although he stressed that the Fed needs significantly more evidence that inflation is headed towards the bank’s target. Powell also added that the Fed’s projections are not a plan, as the economy is surrounded by uncertainty, while he reiterated that decisions on rates will remain data dependent.
The decline in the greenback, in the meantime, was accompanied by a mixed performance of US yields across the curve, where the short end only managed to leave behind part of the recent drop.
Other than the Fed gathering, the US docket saw MBA Mortgage Applications expand 3.2% in the week to December 9.
In the euro docket, Industrial Production in the broader Euroland expanded 3.4% in the year to October and 2.0% from the month earlier.
EUR/USD now faces the immediate hurdle at the December high at 1.0684 (December 14) ahead of the June top at 1.0773 (June 9). The surpass of the latter could put the May peak at 1.0786 (May 30) back on the investors’ radar prior to the round level at 1.0800. On the other hand, the net contention aligns at the weekly low at 1.0443 (December 7) ahead of the key 200-day SMA at 1.0345 and the weekly low at 1.0290 (November 30). A drop beyond this area exposes another weekly low at 1.0222 (November 21) seconded by the interim 55- and 100-day SMAs at 1.0114 and 1.0076, respectively. The daily RSI entered the overbought territory past 71.
Resistance levels: 1.0684 1.0773 1.0786 (4H chart)
Support levels: 1.0528 1.0506 1.0443 (4H chart)
USDJPY
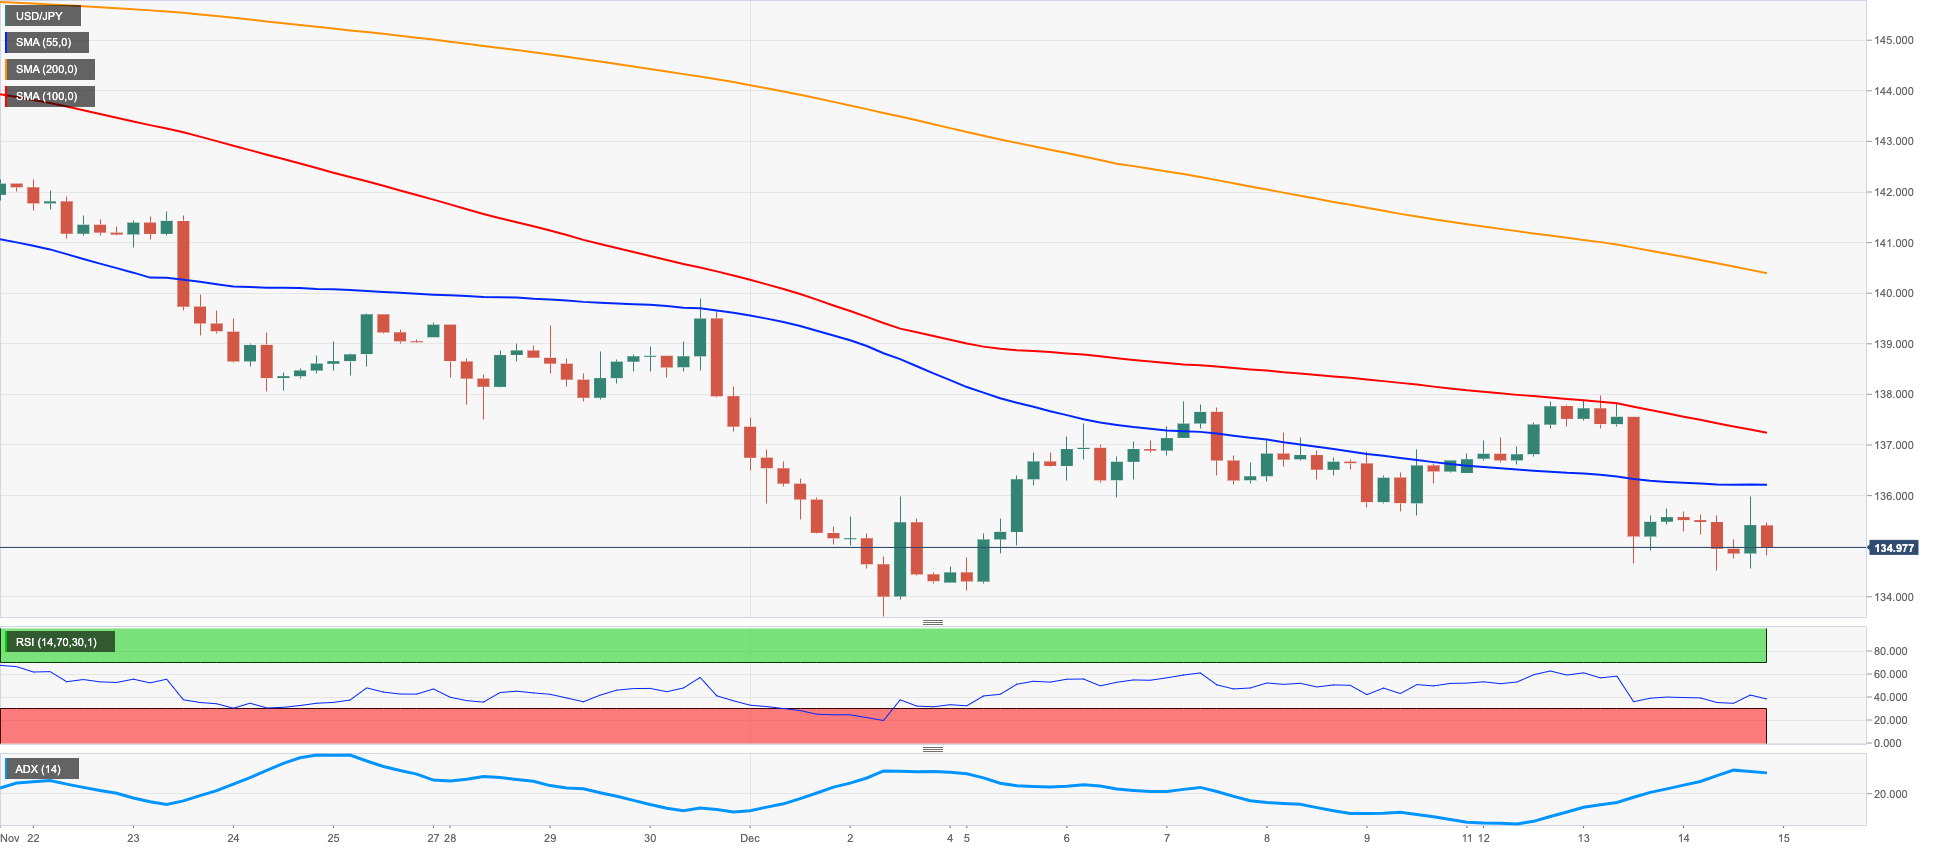
Another poor session in the greenback coupled with the mixed tone in US yields across the curve encouraged sellers to remain in control and drag USD/JPY to new multi-day lows in the mid-134.00s midweek.
Indeed, the dollar suffered the lack of surprises at Powell’s press conference and intensified the ongoing decline after the Federal Reserve delivered its much telegraphed 50 bps rate hike.
From the BoJ, the central bank hinted at the possibility of conducting a review in the next year.
Busy day in the Japanese docket after Machinery Orders expanded 0.4% YoY in October and final figures saw Industrial Production expand 3.0% YoY in the same month. In addition, the Tankan survey was out for the October-December period and showed the Tankan Large All Industry Capex rise 19.2% (from 21.5%), the Tankan Large Manufacturers Index ease a tad to 7, the Tankan Large Manufacturing Outlook drop to 6 and the Tankan Large Non-Manufacturing Index improve to 19.
Extra downside in USD/JPY could see the December low at 133.61 (December 2) revisited ahead of the August low at 130.39 (August 2) and before the key round level at 130.00. Alternatively, the weekly peak at 137.97 (December 13) emerges as the immediate up barrier prior to the weekly high at 139.89 (November 30) and the round level at 140.00. Once cleared, the provisional 100-day SMA at 141.06 should come to the fore ahead of the weekly top at 142.25 (November 21) and the 55-day SMA at 143.00. The daily RSI dropped further and probed the 35 area.
Resistance levels: 137.97 139.89 141.09 (4H chart)
Support levels: 134.51 133.61 132.55 (4H chart)
GBPUSD
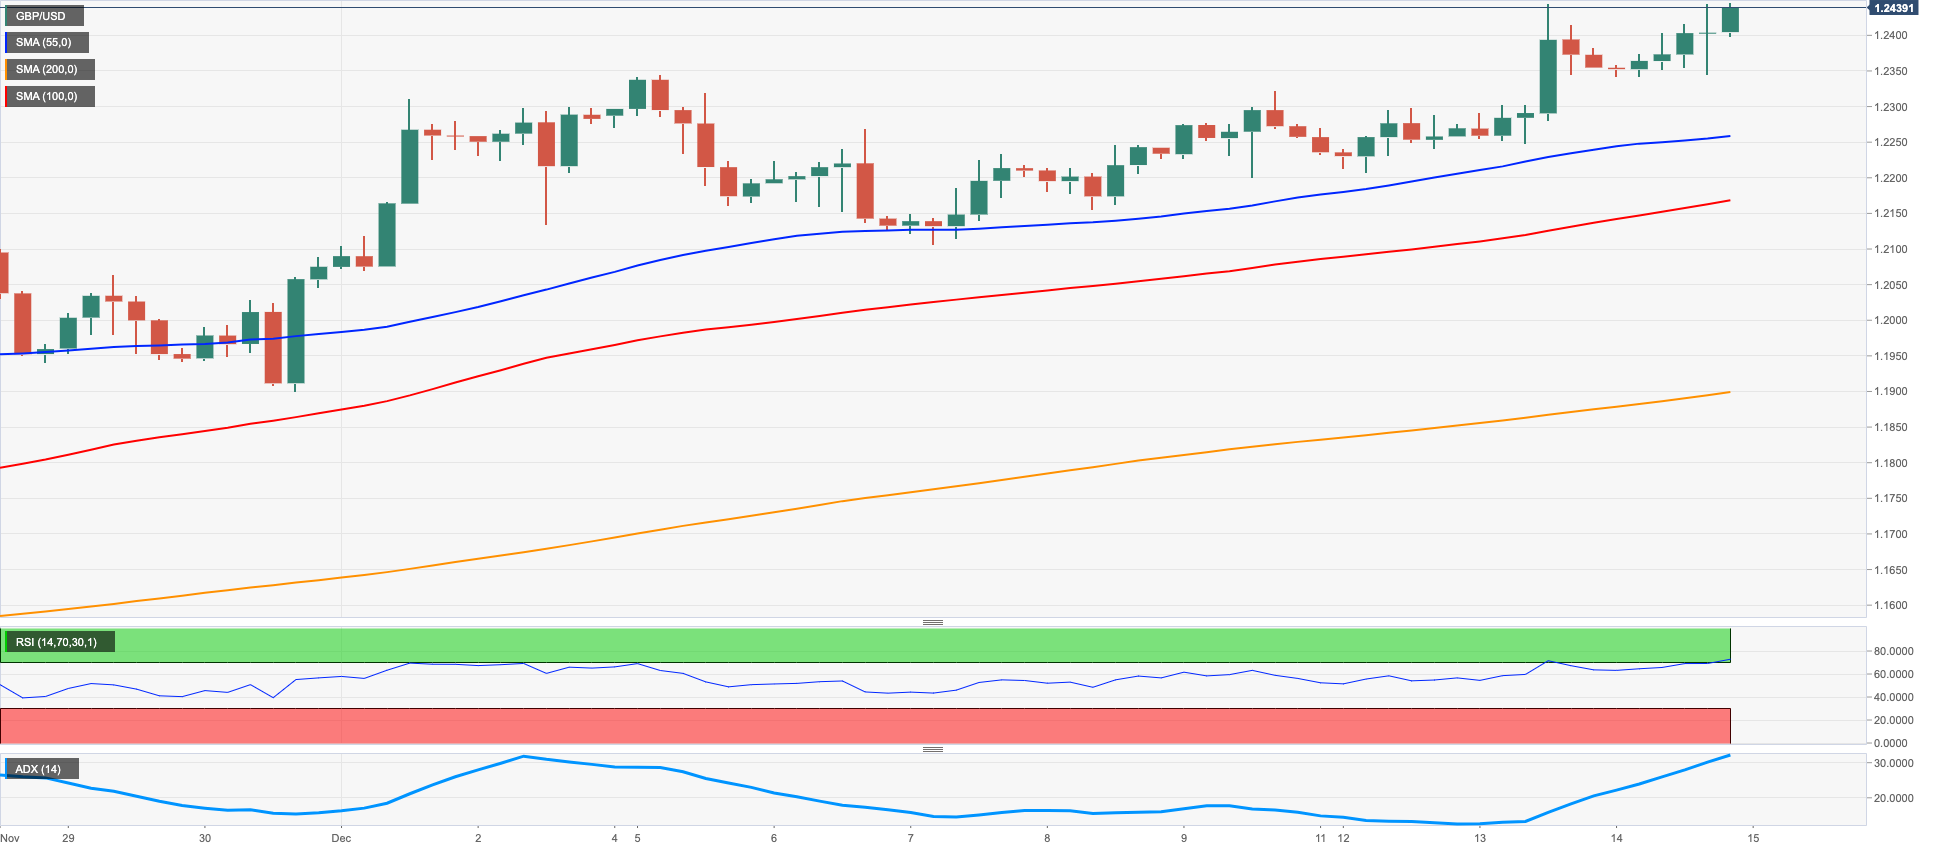
GBP/USD added to Tuesday’s gains and briefly revisited the area above 1.2400 the figure on Wednesday.
The continuation of the upside momentum in Cable came once again on the back of further weakness in the greenback after the Federal Reserve hiked rates by half percentage point, as widely anticipated, and Chair Powell’s presser lacked colour.
In the UK calendar, the Inflation Rate rose less than expected 10.7% YoY in November (from 11.1%), while the Core CPI rose 6.3% over the last twelve months. On a monthly basis, consumer prices rose 0.4%.
If GBP/USD clears the recent cycle high at 1.2444 (December 14) it could then confront the May top at 1.2666 (May 27) ahead of the 200-week SMA at 1.2935, just before the psychological 1.3000 yardstick. Contrarily, the always relevant 200-day SMA at 1.2106 emerges as the next contention area ahead of the weekly low at 1.1900 (November 30) and the temporary 100- and 55-day SMAs at 1.1672 and 1.1650, respectively. Down from here comes the November low at 1.1142 (November 4) followed by the weekly low at 1.1059 (October 21). The daily RSI improved further and flirted with 69 yardstick.
Resistance levels: 1.2444 1.2599 1.2666 (4H chart)
Support levels: 1.2205 1.2154 1.2106 (4H chart)
AUDUSD
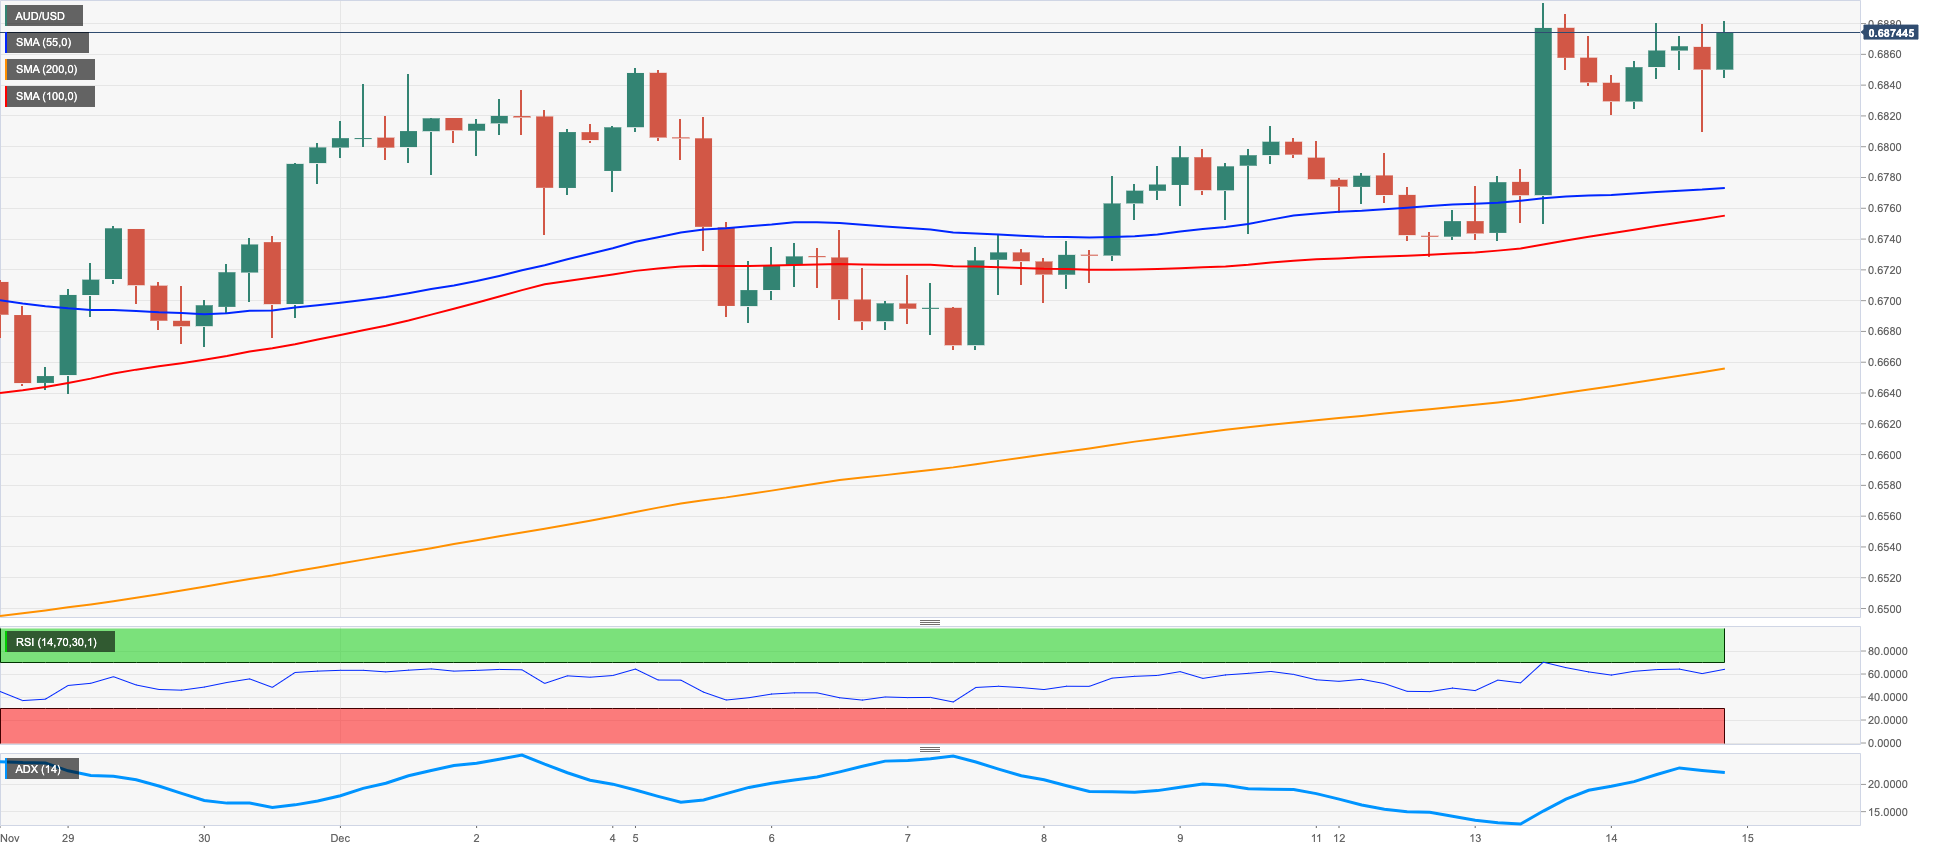
AUD/USD printed humble gains on Wednesday following Tuesday’s fresh cycle highs just pips below the key 0.6900 hurdle.
The indecision around the pair came despite another offered stance in the greenback after the Fed raised the fed Funds Target Range (FFTR) by 50 bps as expected and Jerome Powell’s presser provided no fresh news.
The mixed performance of the commodity complex seems to have limited the upside potential in the Aussie dollar after marginal gains in copper prices and another inconclusive session of the iron ore.
There were no data releases Down Under on Wednesday, whereas the labour market report and Consumer Inflation Expectations should take centre stage on Thursday.
Further gains in AUD/USD need to leave behind the December top at 0.6893 (December 13) and the key 200-day SMA at 0.6900 to allow for a probable test of the September peak at 0.6916 (September 13). The surpass of the latter could put the psychological 0.7000 level back on the radar prior to the weekly high at 0.7008 (August 26) followed by the 200-week SMA at 0.7077 and the August top at 0.7136 (August 11). In the opposite direction, initial support aligns at the interim 100-day SMA at 0.6674 just before the weekly low at 0.6668 (December 7). A deeper drop could expose weekly lows at 0.6640 (November 29) and 0.6584 (November 21) ahead of the 55-day SMA at 0.6538 and the weekly low at 0.6386 (November 10). The daily RSI rose a tad and approached the 63 zone.
Resistance levels: 0.6893 0.6916 0.6956 (4H chart)
Support levels: 0.6728 0.6668 0.6640 (4H chart)
GOLD
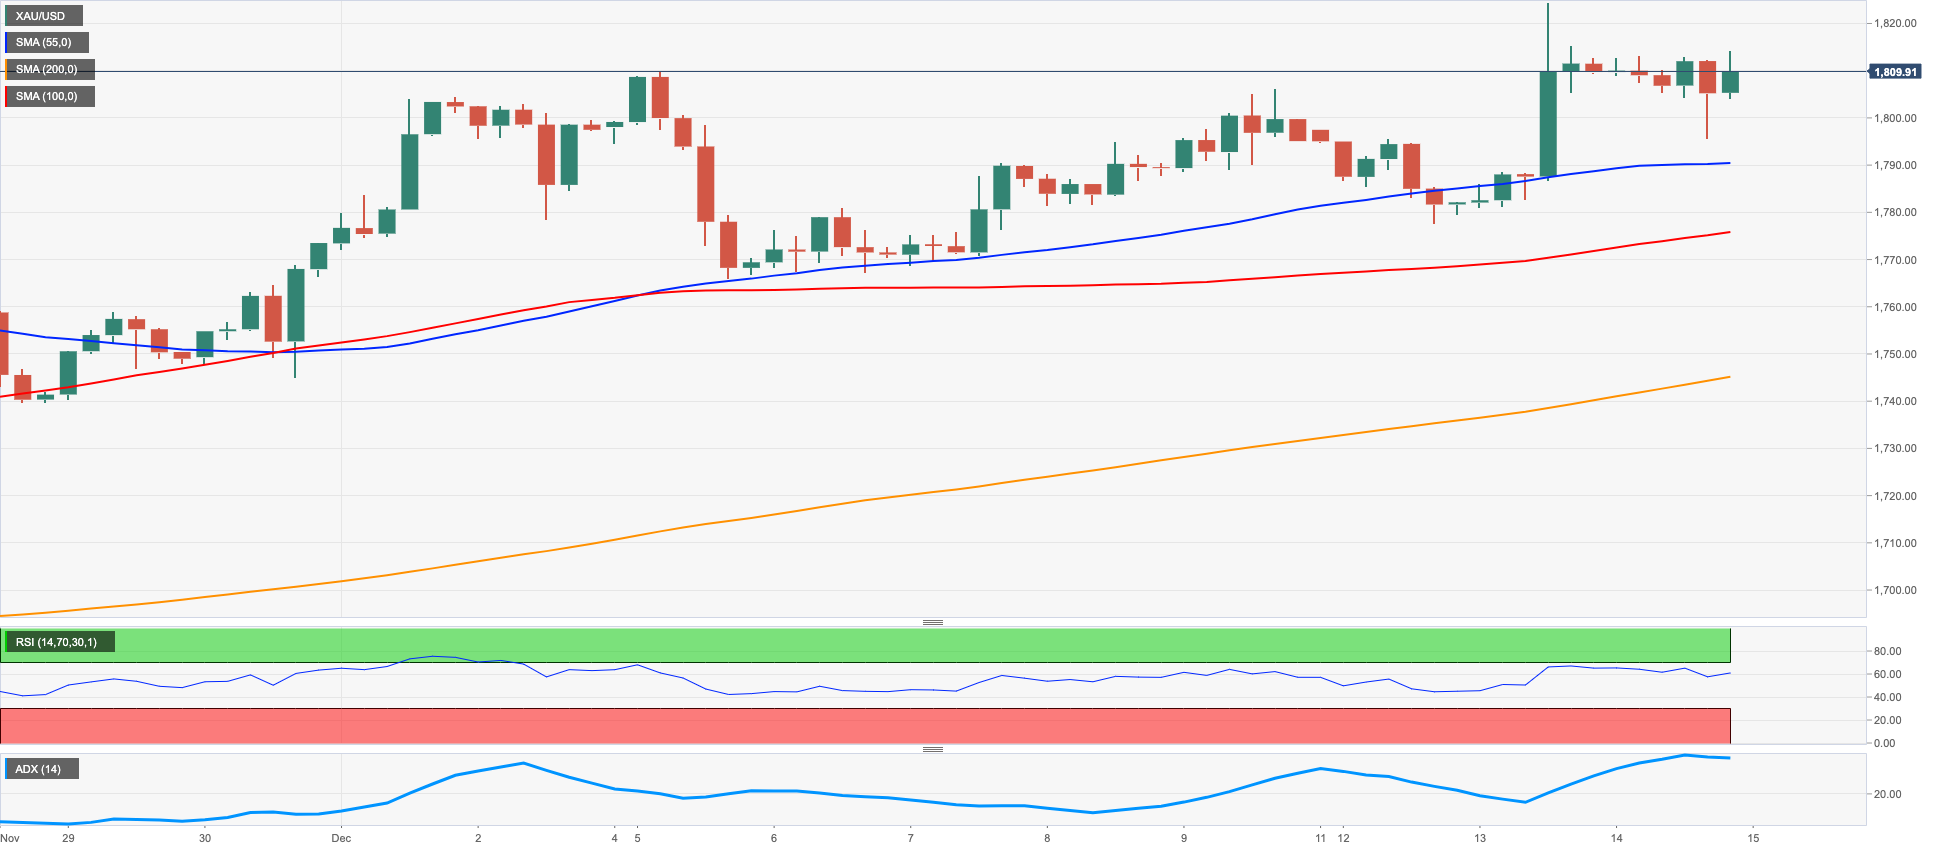
Gold prices marginally faded Tuesday’s strong uptick, although they managed to keep business near the key $1,800 mark per ounce troy on Wednesday.
That said, while the dollar remained offered post-FOMC event, the prospects for further rate hikes by the Fed stayed unchanged (albeit at a slower pace), keeping the precious metal under pressure.
In addition, another mixed session in US yields also added to the volatility around bullion on Wednesday.
The continuation of the upside momentum in gold is expected to target the December high at $1,824 (December 13) prior to the June top at $1,879 (June 13) and seconded by the May peak at $1,909 (May 5). By contrast, the 200-day SMA at $1,789 now offers initial support before the December low at $1,765 (December 5) and the weekly low at $1,727 (November 23). Further down turns up the provisional 100- and 55-day SMAs at $1,720 and $1,714, respectively followed the 2022 low at $1,614 (September 28) and the round level at $1,600.
Resistance levels: $1,824 $1,833 $1,841 (4H chart)
Support levels: $1,777 $1,765 $1,744 (4H chart)
CRUDE WTI
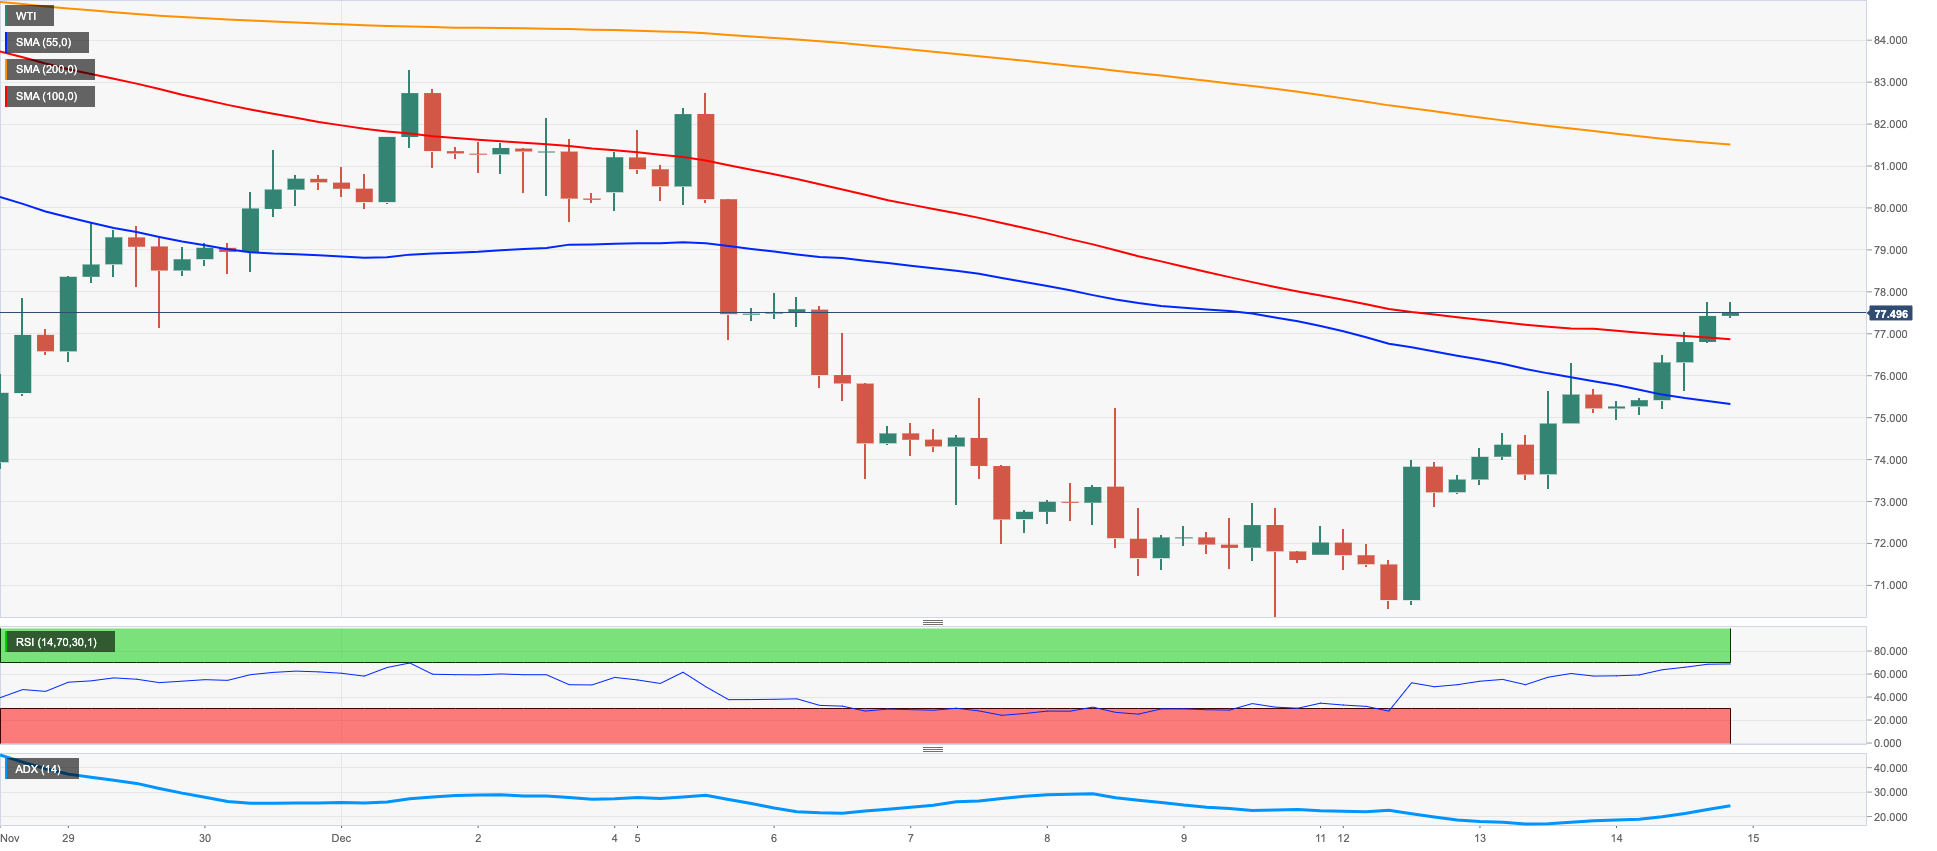
Further optimism around crude oil prices lifted the barrel of the WTI above the $77.00 mark on Wednesday, up for the third session in a row at the same time.
Extra strength in crude oil prices came after both the IEA and the OPEC revised up their forecast for crude oil demand for the next year and now expect it to grow by 2.25 mbpd to 101.8 mbpd and by 1.7 mbpd to 101.6 mbpd, respectively.
The weaker dollar also added to the daily gains in the commodity, while the firm conviction that the Fed could slow the pace of future interest rate hikes underpinned the view that a US recession could be avoided eventually.
Somewhat limiting the upside, the EIA reported an unexpected 10.231M barrels build in US crude oil inventories in the week to December 9. Additionally, supplies at Cushing increased by 0.426M barrels, distillate stocks went up by 1.364M barrels and gasoline stockpiles rose by 4.496M barrels.
No changes to the topside in WTI, as the next hurdle is seen at the key $80.00 mark per barrel prior to the December peak at $83.32 (December 1) and the provisional 100-day SMA at $85.73. Further north turns up the $90.08 level (November 11) ahead of the November top at $93.73 and the key 200-day SMA at $96.15. On the flip side, the 2022 low at $70.10 (December 9) precedes the key round level at $70.00 ahead of the weekly low at $66.15 (December 20 2021). The continuation of the decline could see the 200-week SMA at $65.09 revisited before the December 2021 low at $62.46 (December 2).
Resistance levels: $77.72 $81.92 $83.32 (4H chart)
Support levels: $73.19 $70.07 $68.55 (4H chart)
DOW JONES
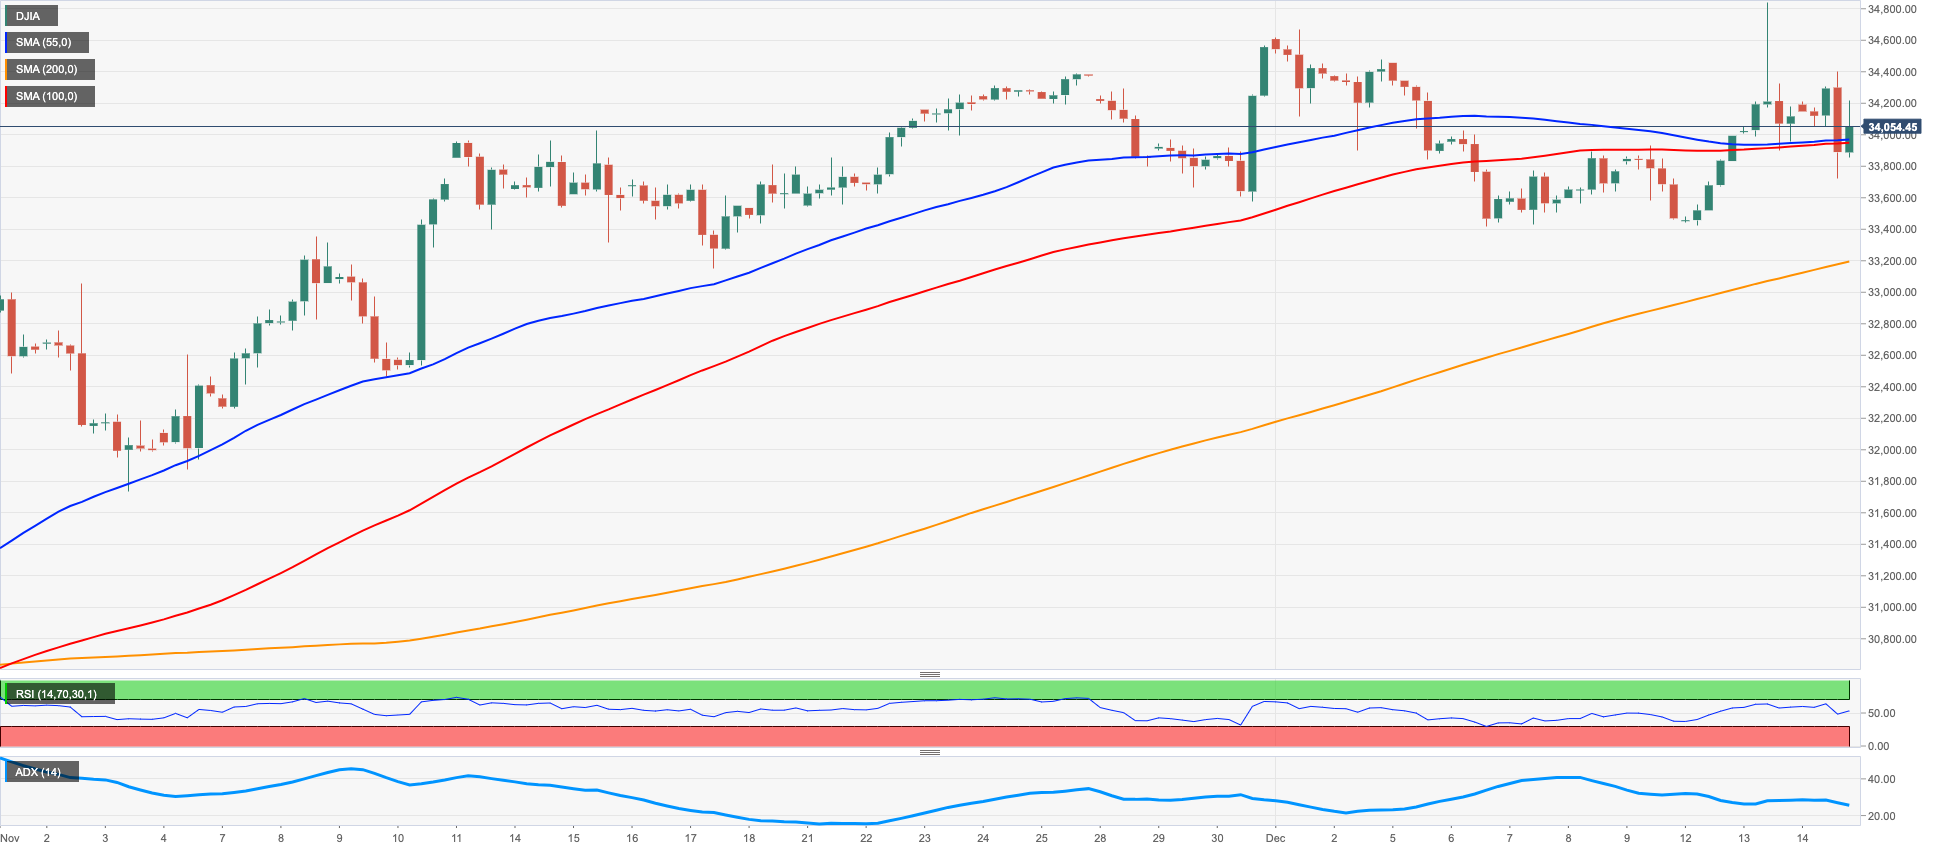
US equities reversed Tuesday’s gains and extended further the rejection from Tuesday’s multi-month tops.
In fact, investors remained prudent despite the absence of surprises at Chair Powell’s press conference, all after the Federal Reserve raised rates by 50 bps at its event, matching the broad consensus.
Indeed, prospects of smaller interest rate hikes in the next months and an eventual impasse in the current normalization process remained on the cards, although a higher dots-plot appeared to have weighed on investors’ sentiment.
All in all, the Dow Jones retreated 0.09% to 34,082, the S&P500 lost 0.14% to 4,013 and the tech-reference Nasdaq Composite dropped 0.60% to 11,1190.
Further upside in the Dow Jones now focuses on the round level at 35,000 prior to the April high at 35,492 and before the February top at 35,824 (February 9). On the contrary, the December low at 33,418 (December 6) is seen offering initial contention ahead of the weekly low at 33,239 (November 17) and key 200-day SMA at 32,465. The loss of the latte could open the door to the November low at 31,727 (November 3). The daily RSI extended the upside above 62.
Top Performers: Merck&Co, Procter&Gamble, Boeing
Worst Performers: Goldman Sachs, Intel, Apple
Resistance levels: 34,712 35,492 35,824 (4H chart)
Support levels: 33,418 33,239 32,478 (4H chart)
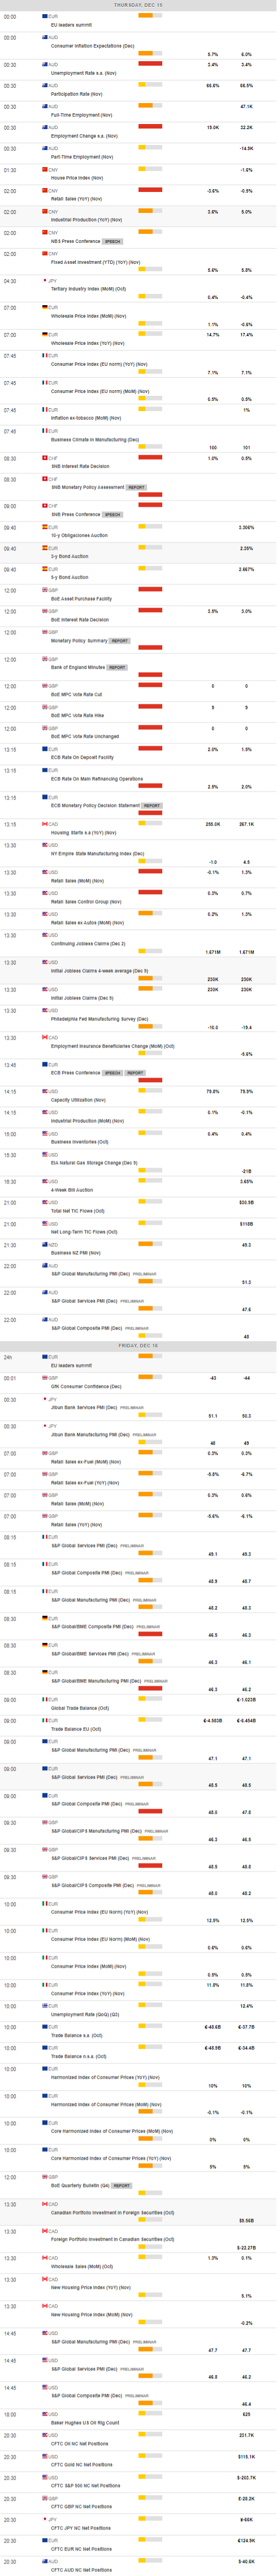
MACROECONOMIC EVENTS
All Information & Updates provided by:

All information relating to the financial markets available on this page has been prepared and issued by FXStreet (Forexstreet SL, Spain, Reg: B62498233) on the basis of publicly available information and all information believed to be reliable and does not conflict with Kuwaiti local laws, and all necessary care has been taken to before the company to ensure that the facts mentioned are correct from the source.
NCM Investment nor any of its directors or employees shall in any way be held responsible for the contents of this news, and the information contained on this page is intended only to provide clients with publicly available information and should not be construed as investment advice, report or analysis and/or constitute an offer or invitation to buy or sell financial instruments of any kind.
RISK WARNING: Forex and CFDs are highly risky leveraged products, as losses can exceed deposits. Please ensure you understand all the risks and take independent advice if necessary. NCM will segregate the clients based on the criteria of the regulator and its bylaws. NCM does not provide any advisory service; the material published does not constitute advice or a recommendation for a transaction in any financial instrument. NCM accepts no responsibility for any use of the content presented and any consequences of that use. Anyone acting on the information provided does so at their own risk.