
- Contact Us:
-

-

-

-


Daily Market Updates
19 Dec 2022
USDJPY
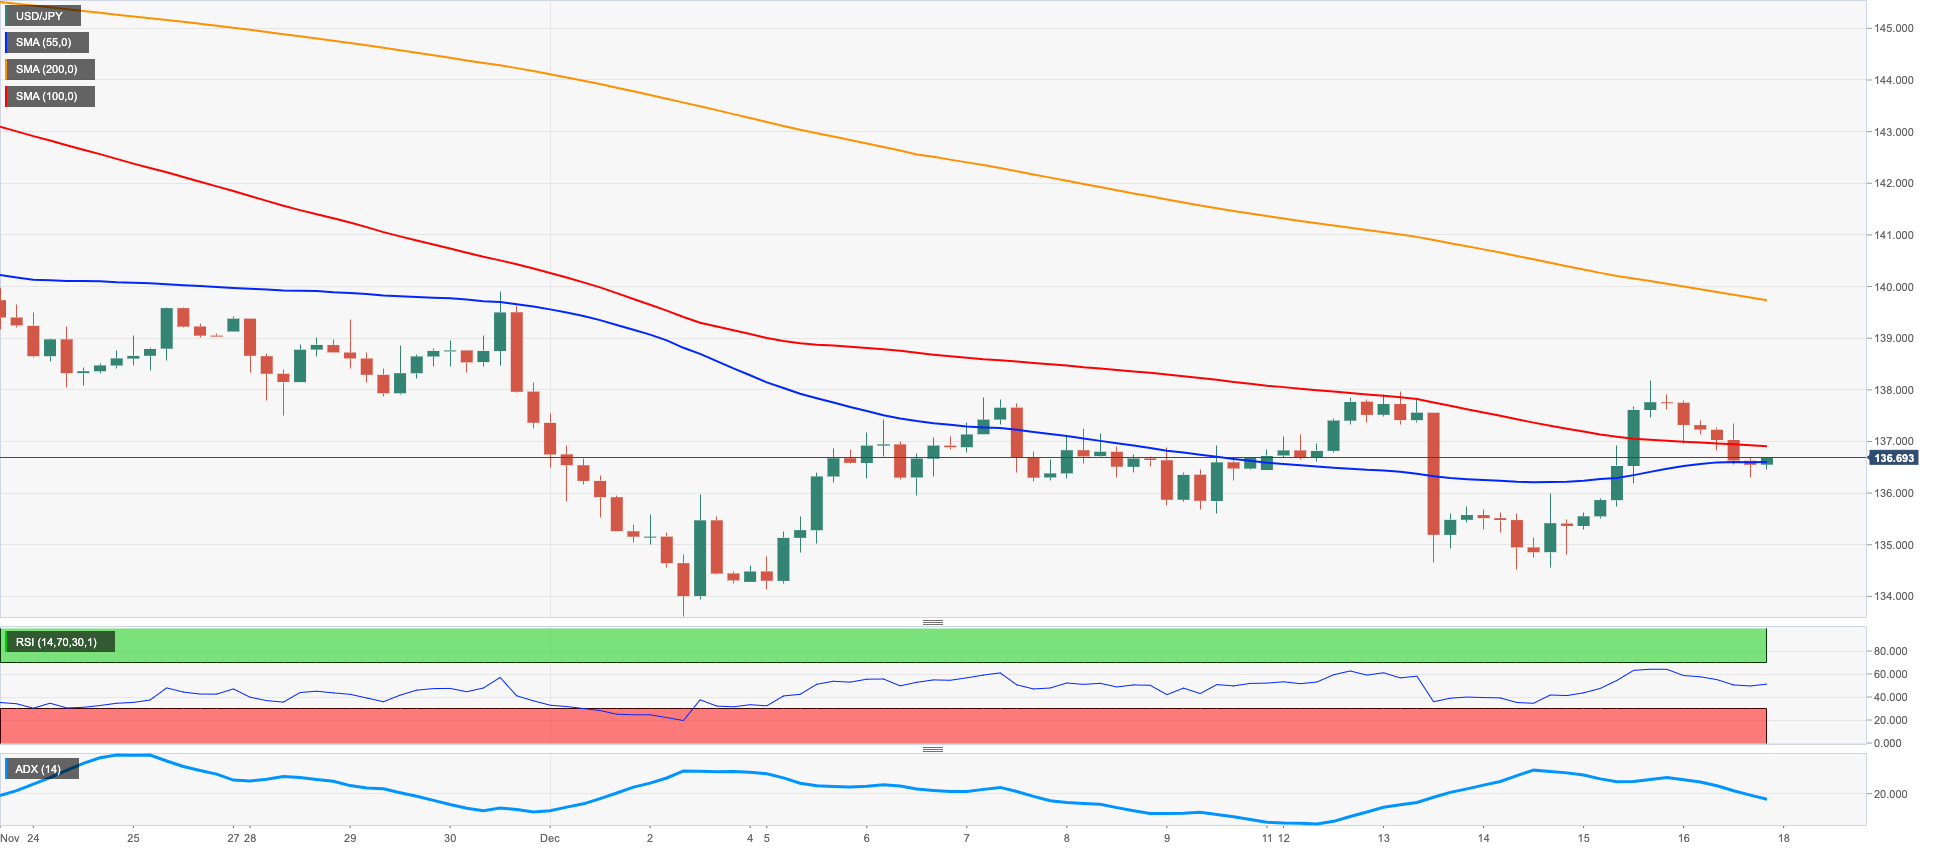
USD/JPY failed to add to Thursday’s strong advance despite the extra improvement in the greenback and closed the week around 136.70, managing however to advance marginally in the weekly chart.
The mixed performance in the US money markets saw yields trade in a mixed fashion, with the short end of the curve returning to the negative territory vs. decent gains in the belly and the long end.
In the meantime, spot appears somewhat entrenched in a consolidative scenario with the topside clearly emerging at the 138.00 neighbourhood so far.
In the Japanese calendar, flash figures saw the Jibun Bank Manufacturing PMI a tad lower to 48.8 in November and the Services PMI rising to 51.7.
No changes to the topside in USD/JPY, as bulls continue to target the weekly top at 138.17 (December 15) followed by another weekly peak at 139.89 (November 30) and the round level at 140.00. North from here turns up the temporary 100-day SMA at 141.14 ahead of the weekly high at 142.25 (November 21) followed by the 55-day SMA at 142.74. On the other hand, the weekly low at 134.50 (December 14) emerges as a minor support seconded by the December low at 133.61 (December 2). The loss of this region leaves the pair vulnerable to a drop to the August low at 130.39 (August 2) just before the key round level at 130.00. The daily RSI deflated to the proximity of 42.
Resistance levels: 138.17 139.89 140.02 (4H chart)
Support levels: 136.29 134.50 133.61 (4H chart)
GBPUSD
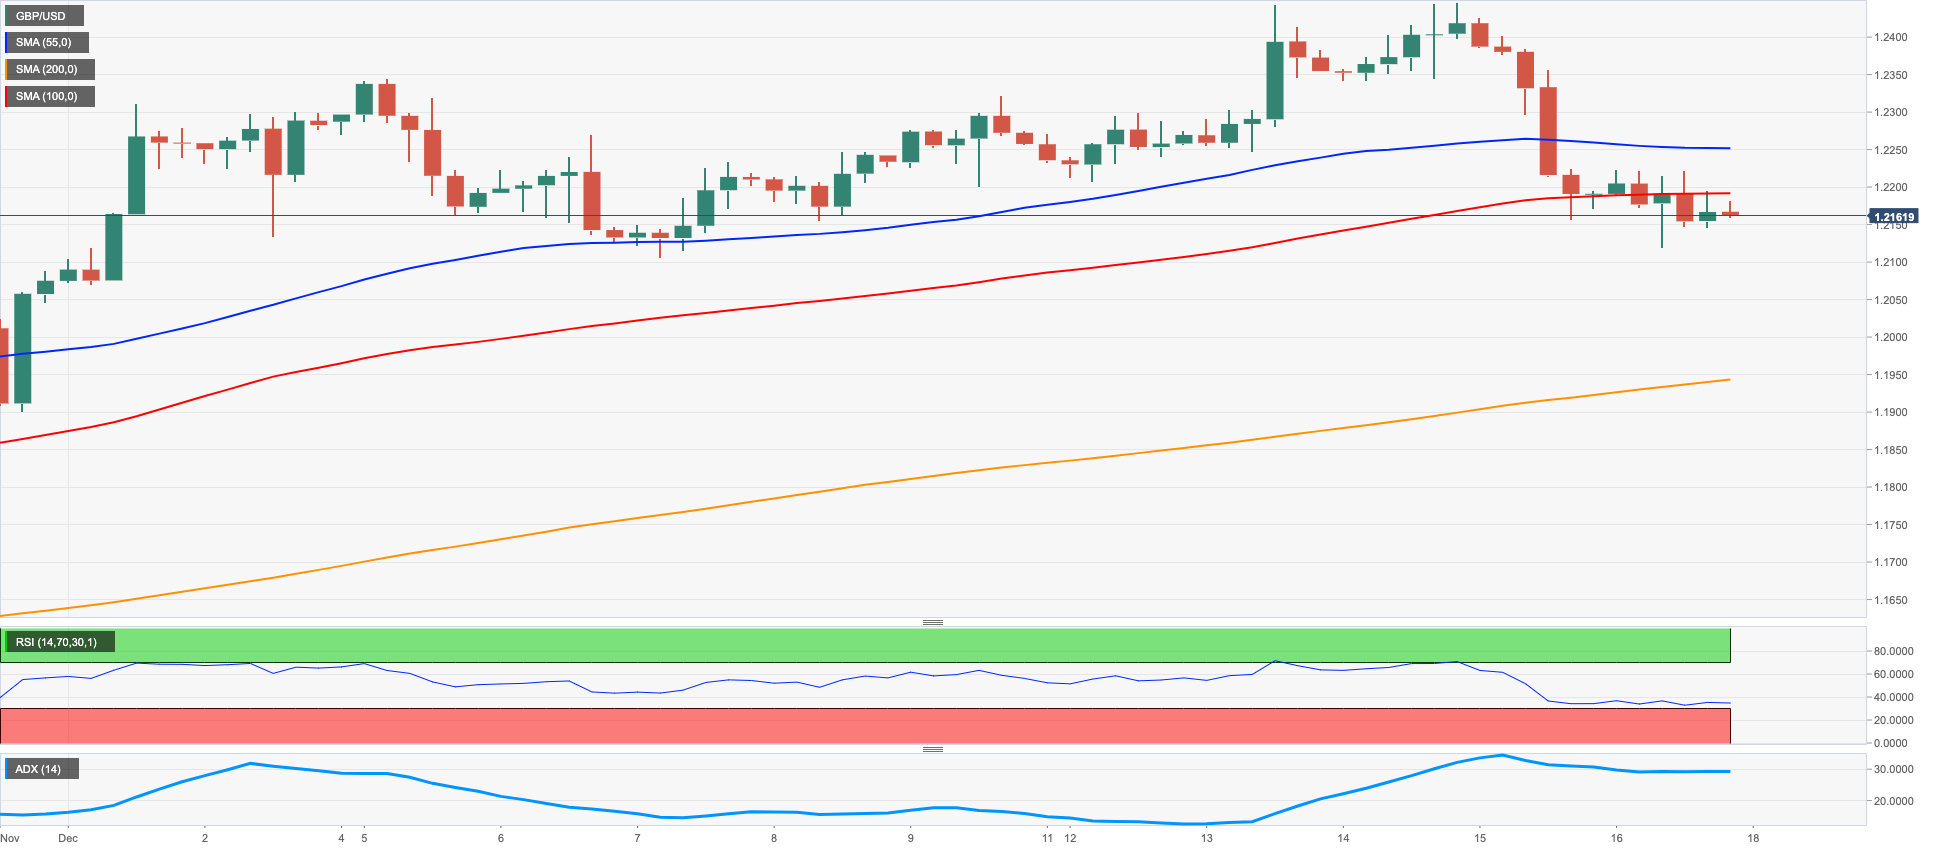
GBP/USD succumbed to the pessimism seen in the second half of the week in the risk complex and retreated to multi-session lows well south of the 1.2200 mark on Friday. Cable, therefore, cliched the second consecutive week with losses despite hitting multi-month peaks near 1.2450 on December 14.
Once again, the solid bounce in the greenback weighed on the quid and the rest of its risk-associated peers in response to further repricing by market participants of the likelihood that the Fed could maintain a restrictive stance for longer than initially thought.
Extra weakness in the Sterling also emerged in response to traders’ adjustments to the recent dovish hike by the Bank of England.
In the UK calendar, November’s advanced results saw the Manufacturing PMI recede to 44.7 and the Services PMI improve to 50.0.
Further losses in GBP/USD now face the immediate contention at the key 200-day SMA at 1.2097. Down from here, there are no support levels of note until the weekly low at 1.1900 (November 30) followed by the provisional 55- and 100-day SMAs at 1.1688 and 1.1672, respectively. The loss of this zone exposes the November low at 1.1142 (November 4) prior to the weekly low at 1.1059 (October 21). Meanwhile, the next up barrier aligns at the December peak at 1.2446 (December 14) ahead of the May high at 1.2666 (May 27) and the 200-week SMA at 1.2934, all before the psychological 1.3000 level. The daily RSI deflated further to the vicinity of 54.
Resistance levels: 1.2222 1.2446 1.2599 (4H chart)
Support levels: 1.2119 1.1906 1.1900 (4H chart)
AUDUSD
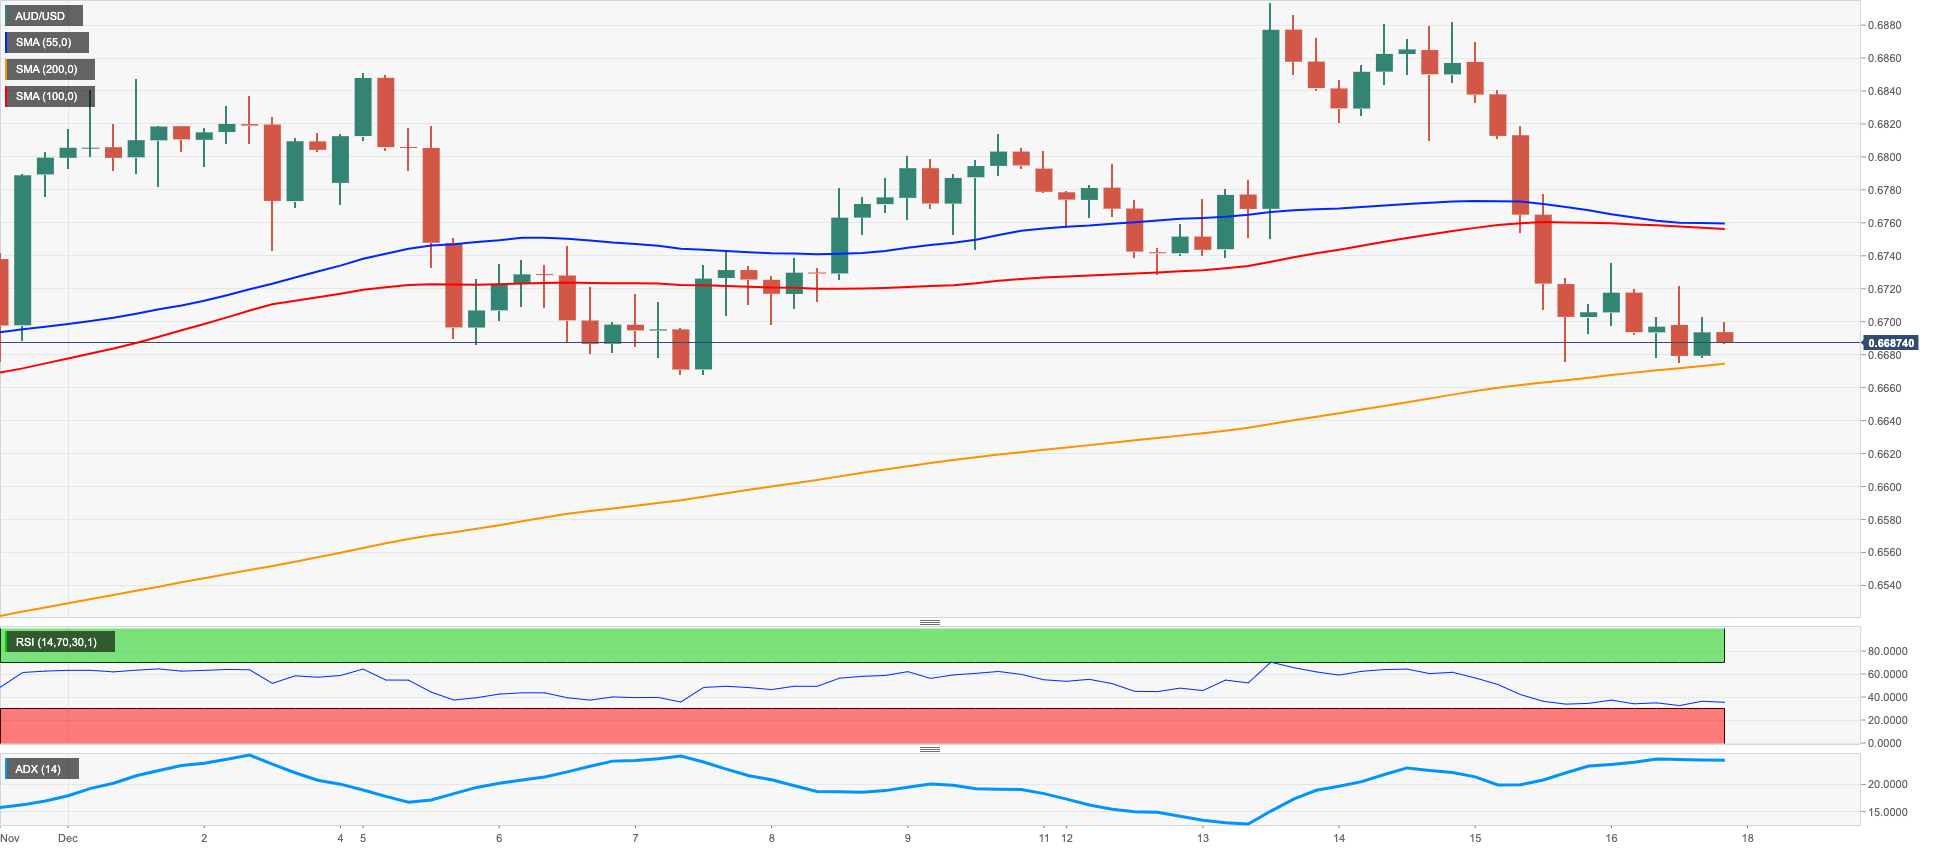
AUD/USD added to Thursday’s pronounced sell-off and extended the breach of the 0.6700 mark on Friday, closing near the 100-day SMA around 0.6670. Furthermore, and following the negative price action in the last couple of sessions, the pair halted a 3-week positive streak, always in response to the renewed upside momentum in the buck and some weakness in Chinese fundamentals.
Another session with gains in the greenback weighed on the risk-linked galaxy and put the Aussie dollar under extra downside pressure along with the commodity universe, where copper prices and the iron ore both traded on the defensive on Friday.
There were no data releases in Oz on Friday. The next salient event will be on Tuesday with the release of the RBA Minutes of the December gathering.
Immediately to the downside in AUD/USD is now seen the weekly low at 0.6668 (December 7), which appears underpinned by the 100-day SMA. If the pair breaks below the latter it could then challenge the weekly lows at 0.6640 (November 29) and 0.6584 (November 21) ahead of the 55-day SMA at 0.6547 followed by the weekly low at 0.6386 (November 10). Contrarily, the December high at 0.6893 (December 13) remains propped up by the key 200-day SMA ahead of the September top at 0.6916 (September 13). Extra gains could see the psychological 0.7000 mark revisited prior to the weekly peak at 0.7008 (August 26). The daily RSI extended the pullback to the sub-49 area.
Resistance levels: 0.6735 0.6773 0.6893 (4H chart)
Support levels: 0.6675 0.6668 0.6640 (4H chart)
GOLD
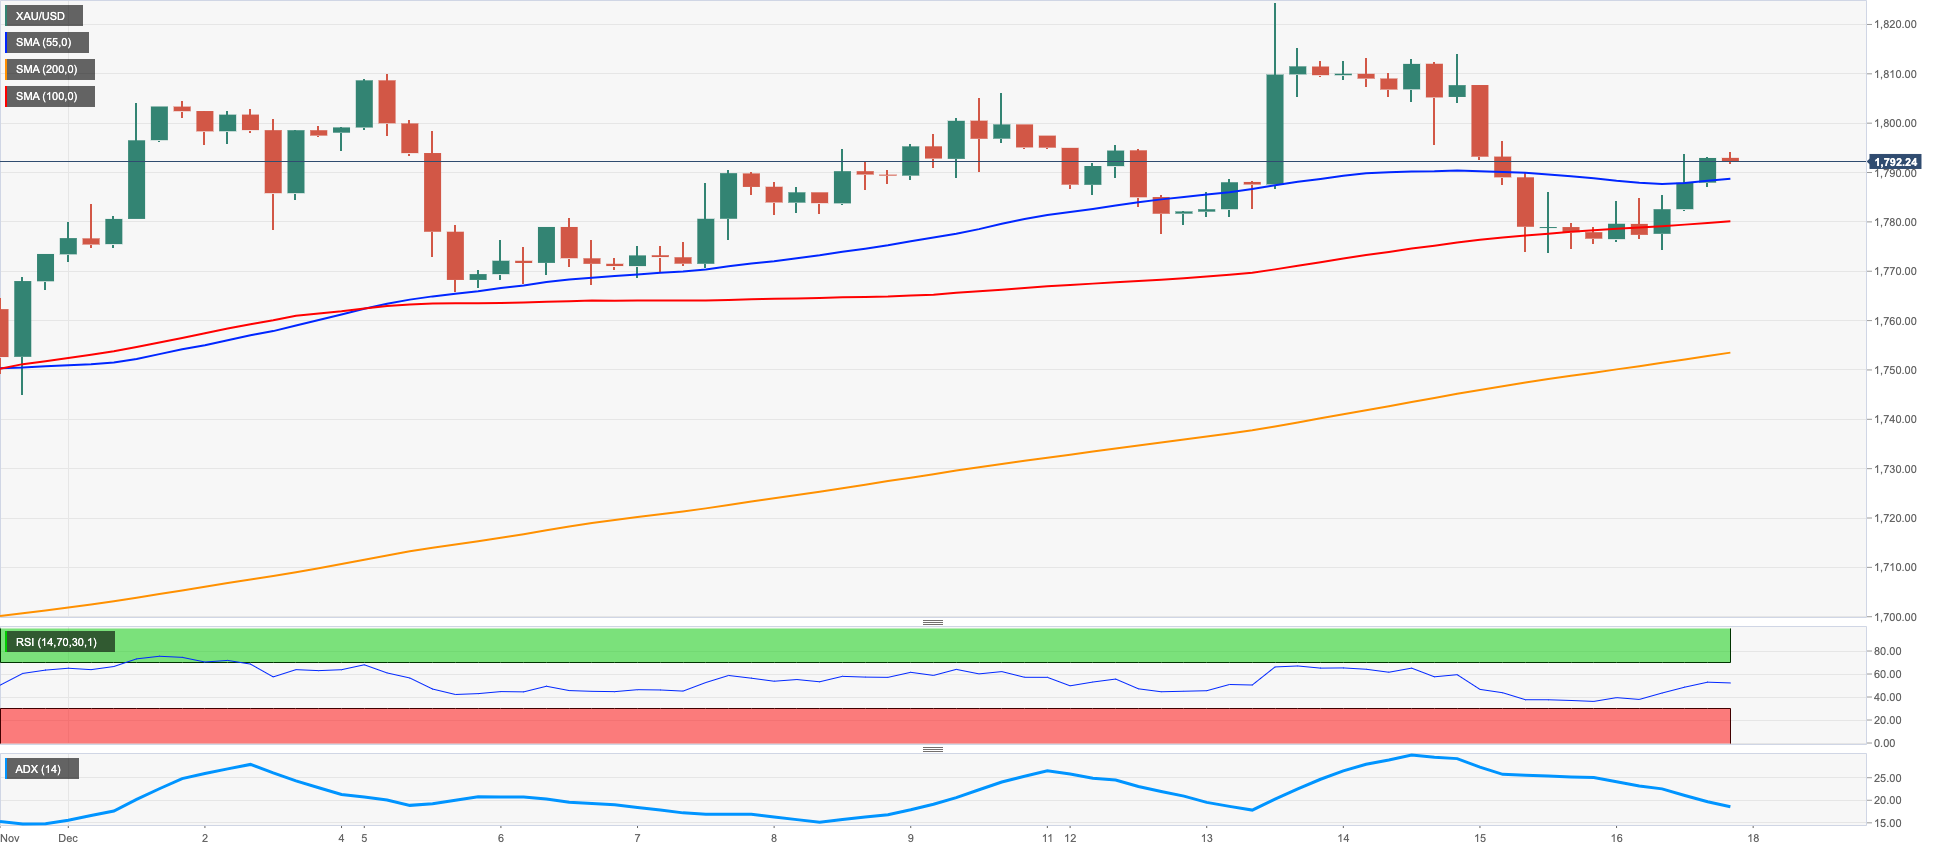
Gold prices set aside two daily pullbacks in a row and charted a decent comeback to the boundaries of the critical $1,800 mark per ounce troy at the end of the week.
The move higher in the yellow metal challenged another bounce in the dollar, although the mixed note from US yields appears to have been enough to spark some corrective move in bullion on Friday.
Moving forward, the prospects of a higher-for-longer Fed should remain a key headwind for gold bulls for the time being.
In case the rebound in the precious metal picks up a serious pace, then the next target remains unchanged at the December peak at $1824 (December 13) ahead of the June high at $1879 (June 13) and the May top at $1909 (May 5). Alternatively, the initial support appears at the December low at $1765 (December 5) prior to the weekly low at $1727 (November 23) and the interim 100- and 55-day SMAs at $1720 and $1718, respectively ahead. Further south comes the 2022 low at $1614 (September 28) before the round level at $1600.
Resistance levels: $1794 $1824 $1833 (4H chart)
Support levels: $1773 $1765 $1744 (4H chart)
CRUDE WTI
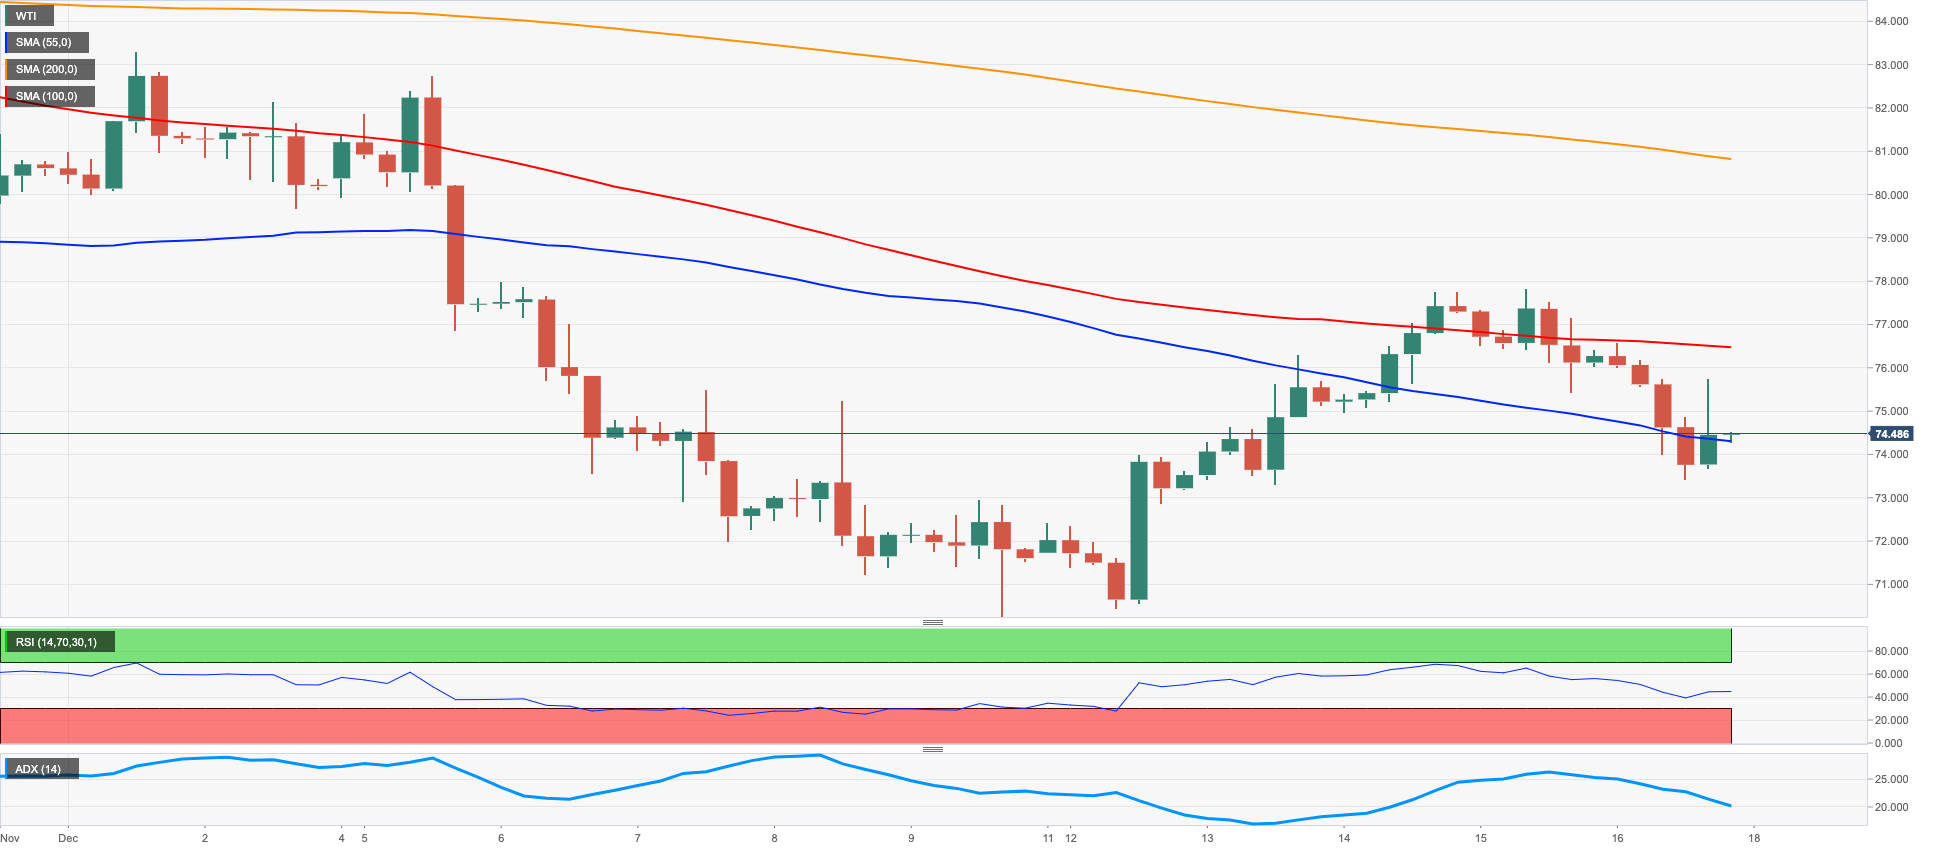
WTI prices remained on the defensive in the second half of the week, extending further the rejection from weekly tops just below the $78.00 mark per barrel (December 14,15).
The second daily drop in a row in crude oil prices came in response to persistent recession concerns - particularly exacerbated following hawkish interest rate decisions by the Federal Reserve and the European Central Bank - while the unabated pick-up in COVID cases in China kept demand fears widely on the rise.
Somewhat limiting the decline in prices of the commodity appeared the continuation of the inactivity in the Keystone pipeline following a nearly 14 kbpd leak over a week ago in combination with news that the Biden administration will start refilling its SPR.
In the docket, driller Baker Hughes reported a drop of 5 oil rigs in the US Oil Rig Count in the week to December 16, taking the US total active US oil rigs to 620.
Further selling momentum could force prices of the WTI to revisit the 2022 low at $70.10 (December 9) just ahead of the key round level at $70.00 and the weekly low at $66.15 (December 20 2021). Further decline could put the 200-week SMA at $65.07 back on the traders’ radar before the December 2021 low at $62.46 (December 2). Inversely, there is an initial hurdle at the weekly high at $77.74 (December 15) prior to the key $80.00 mark per barrel and the December top at $83.32 (December 1). Further north comes the temporary 100-day SMA at $85.28 seconded by the $90.08 level (November 11), all before the November high at $93.73 and the key 200-day SMA at $95.83.
Resistance levels: $77.74 $81.92 $83.32 (4H chart)
Support levels: $73.31 $73.19 $70.07(4H chart)
GER40
German stocks measured by the DAX 40 index dropped for the third straight session and revisited levels last seen back in early November further south of the 14000 mark on Friday.
Indeed, sentiment among investors remained sour in the largest economy of the Euroland at the end of the week in response to the perception that further tightening by the ECB (and other major central banks) could force the economy to slip into recession in the short-term horizon.
The daily drop in the index came in contrast to further advance in the German 10-year bund yields, this time retesting the 2.20% zone.
In the domestic calendar, flash readings now expect the Manufacturing PMI to improve to 47.4 in November and to 49.1 when it comes to the Services PMI.
The persistent decline in the DAX could encourage sellers to confront the December low at 13815 (December 16) just before the key 200-day SMA at 13564 and the 100-day SMA at 13360. Further down emerges the November low at 13022 (November 3) prior to the minor support at 12548 (October 21). On the flip side, the December top at 14675 (December 13) turns up as the immediate resistance prior to the June peak at 14709 (June 6) and the March high at 14925 (March 29). Up from here comes the 2022 top at 16285 (January 5). The daily RSI dropped to the 41 region.
Best Performers: Volkswagen VZO, Adidas, Deutsche Bank AG
Worst Performers: Vonovia, Sartorius AG VZO, Bayer
Resistance levels: 14675 14709 14925 (4H chart)
Support levels: 13815 13369 13022 (4H chart)
-638069196821585262.png)
NASDAQ
Stocks gauged by the Nasdaq Composite traded on the defensive for yet another session and deflated to multi-week lows near the 10600 region, just to close slightly above that level at the end of the week.
Mixed US yields, the stronger dollar and swelling recession jitters re-emerged and weighed on the US tech sector in response to the hawkish message at the FOMC event on Wednesday, while the same tone was also delivered by the ECB and the BoE during their meetings on Thursday.
Collaborating with the downbeat mood in the risk-associated space, speeches by Fed’s rate-setters on Friday also reinforced the tighter-for-longer narrative from the central bank in the next months.
A deeper correction in the Nasdaq Composite is expected to face the next support at the December low at 10642 (December 16) ahead of the November low at 10262 (November 4). The breakdown of the latter could put the 2022 low at 10088 (October 13) back on the radar prior to the weekly low at 9663 (June 29 2020). Contrastingly, the next up barrier emerges at the December high at 11571 (December 13) before the key 200-day SMA at 11901 and the September top at 12270 (September 12). Above this level comes the August peak at 13181 (August 16) seconded by the weekly high at 13710 (April 21) and the March top at 14646 (March 29). The daily RSI lost further ground and approached 41.
Top Gainers: Cosmos Holdings, Nanthealth, Trean Insurance
Tope Losers: Synaptogenixm, Agrify, Axella Health
Resistance levels: 11352 11439 11571 (4H chart)
Support levels: 10642 10262 10088 (4H chart)
-638069197616494946.png)
DOW JONES
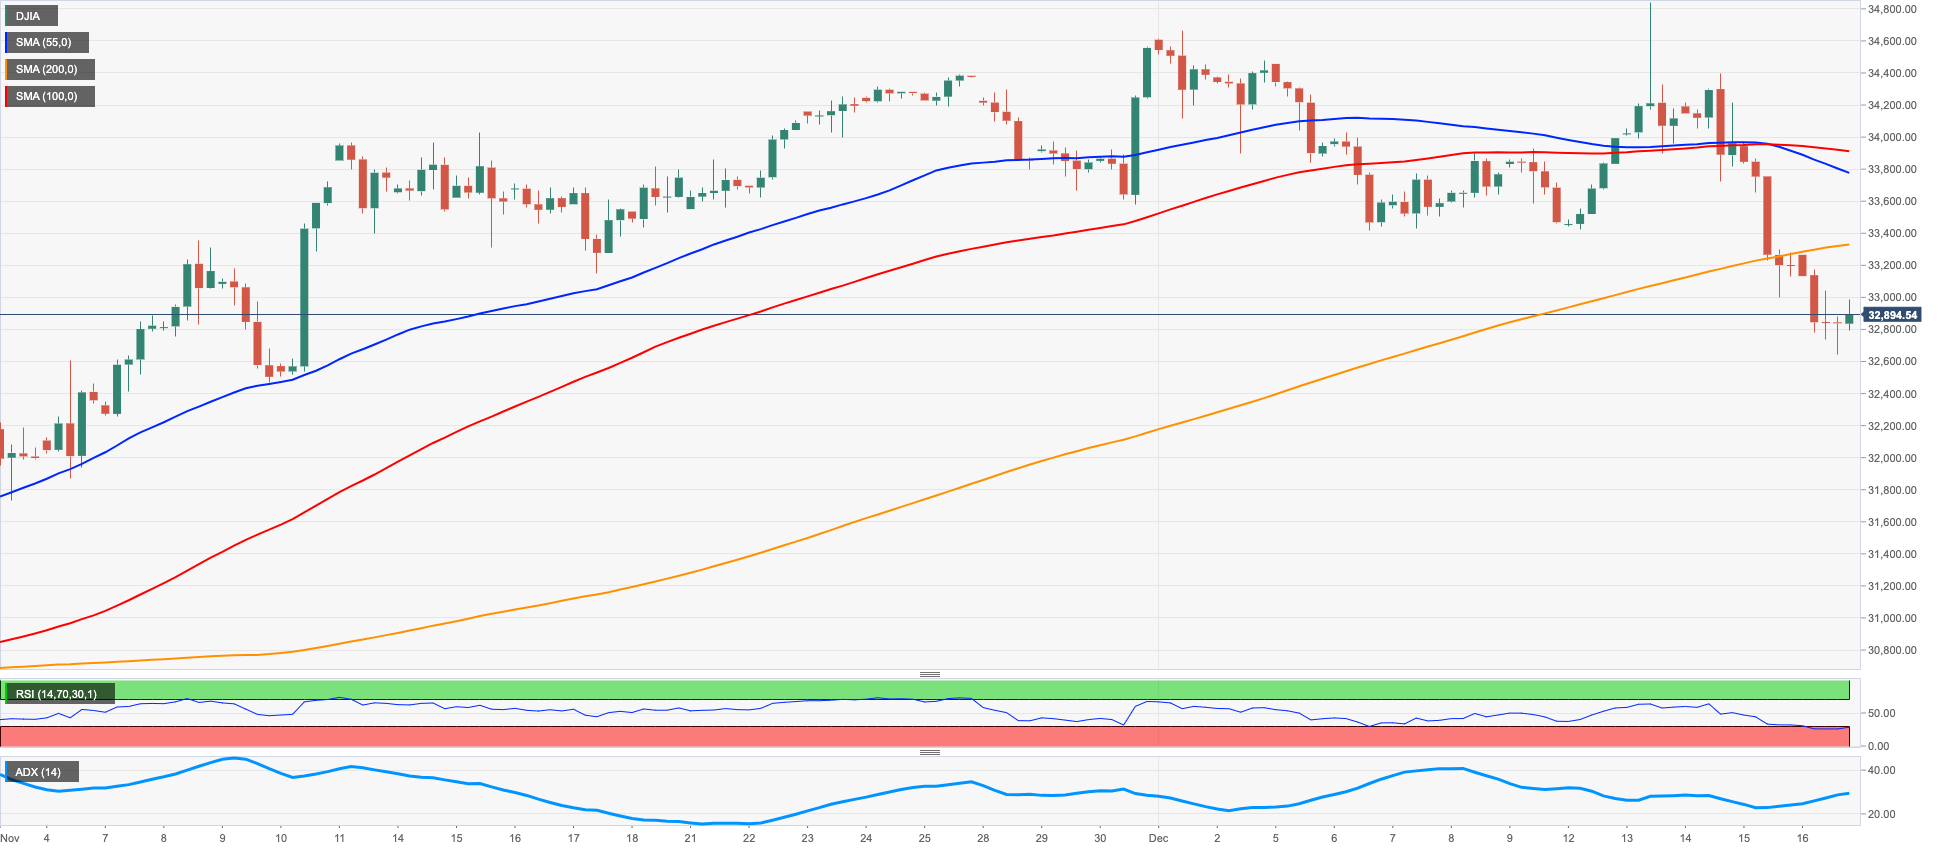
US equities retreated for the third consecutive session and dropped to multi-week lows before regaining some composure on Friday. That said, the three major US stock indices closed the second week in a row in the negative ground.
Persevering recession concerns kept weighing on investors’ sentiment at the end of the week, especially in response to further, albeit well anticipated, tightening by the Fed, the ECB and the BoE earlier in the week.
Extra sourness also came from some loss of traction in US fundamentals as well as from hawkish remarks from FOMC’s Mester, Daly and Williams on Friday, all pointing to the increasing likeliness of a tighter-for-longer stance from the Fed amidst the still unconvincing loss of momentum in the US inflation.
All in all, the Dow Jones dropped 0.85% to 32920, the S&P500 eased 1.11% to 3852 and the tech-reference Nasdaq Composite retreated 0.97% to 10705.
Next on the downside for Dow Jones aligns the key 200-day SMA at 32460 followed by the November low at 31727 (November 3). The loss of this level could motivate the minor support at 20206 (October 21) to emerge on the horizon ahead of the 2022 low at 28660 (October 13). Just the opposite, occasional bullish attempts should meet the next target at the December top at 34712 (December 13) ahead of the April peak at 35492 and followed by the February high at 35824 (February 9). The daily RSI debilitated further and poked with the 43 level.
Top Performers: Caterpillar, Dow, Boeing
Worst Performers: American Express, Nike, McDonald’s
Resistance levels: 34395 34712 35492 (4H chart)
Support levels: 32654 32478 32148 (4H chart)
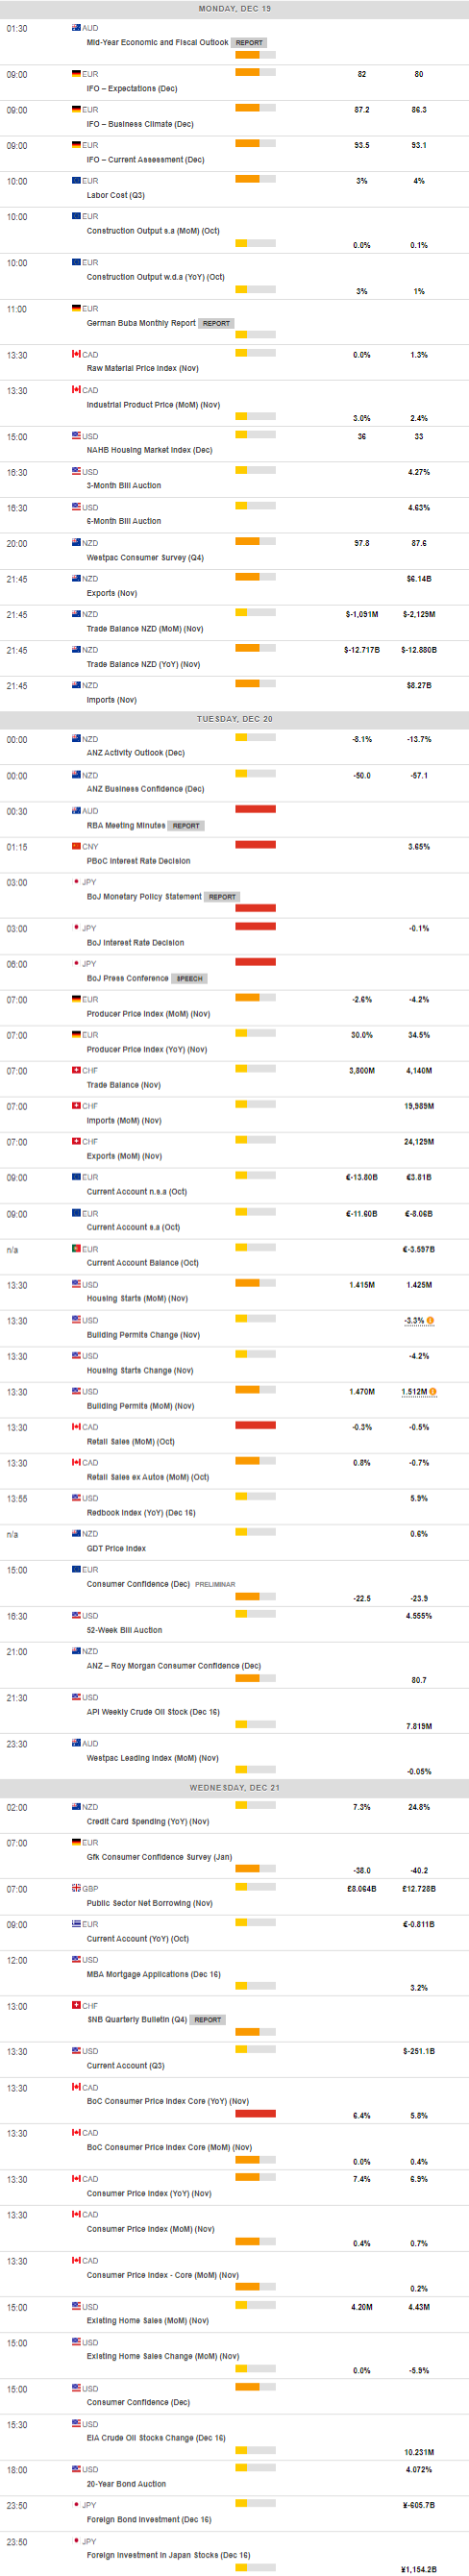
MACROECONOMIC EVENTS
All Information & Updates provided by:

All information relating to the financial markets available on this page has been prepared and issued by FXStreet (Forexstreet SL, Spain, Reg: B62498233) on the basis of publicly available information and all information believed to be reliable and does not conflict with Kuwaiti local laws, and all necessary care has been taken to before the company to ensure that the facts mentioned are correct from the source.
NCM Investment nor any of its directors or employees shall in any way be held responsible for the contents of this news, and the information contained on this page is intended only to provide clients with publicly available information and should not be construed as investment advice, report or analysis and/or constitute an offer or invitation to buy or sell financial instruments of any kind.
RISK WARNING: Forex and CFDs are highly risky leveraged products, as losses can exceed deposits. Please ensure you understand all the risks and take independent advice if necessary. NCM will segregate the clients based on the criteria of the regulator and its bylaws. NCM does not provide any advisory service; the material published does not constitute advice or a recommendation for a transaction in any financial instrument. NCM accepts no responsibility for any use of the content presented and any consequences of that use. Anyone acting on the information provided does so at their own risk.