
- Contact Us:
-

-

-

-


Daily Market Updates
20 Dec 2022
USDJPY
USD/JPY extended further the consolidative theme at the beginning of the week and this time managed to bounce back to the area beyond the 137.00 mark.
The move higher in the pair came despite some fresh weakness in the dollar, although it remained well underpinned by further recovery in US yields across the curve, as investors kept assessing the renewed hawkishness from the Federal Reserve.
In Japan, the BoJ 2-day meeting kicked in on Monday and it is expected to deliver no surprises on Tuesday, with the central bank (stubbornly?) sticking to its ultra-accommodative stance.
Next on the upside for USD/JPY aligns the weekly peak at 138.17 (December 15) ahead of another weekly high at 139.89 (November 30) and the round level at 140.00. Once cleared, the provisional 100-day SMA at 141.19 should return to the investors’ radar ahead of the weekly top at 142.25 (November 21) and the 55-day SMA at 142.60. Meanwhile, there is initial contention at the weekly low at 134.50 (December 14) prior to the December low at 133.61 (December 2). A deeper retracement could prompt the August low at 130.39 (August 2) to re-emerge on the horizon ahead of the key round level at 130.00. The daily RSI appeared side-lined below 45.
Resistance levels: 138.17 139.89 140.02 (4H chart)
Support levels: 135.75 134.50 133.61 (4H chart)

GBPUSD
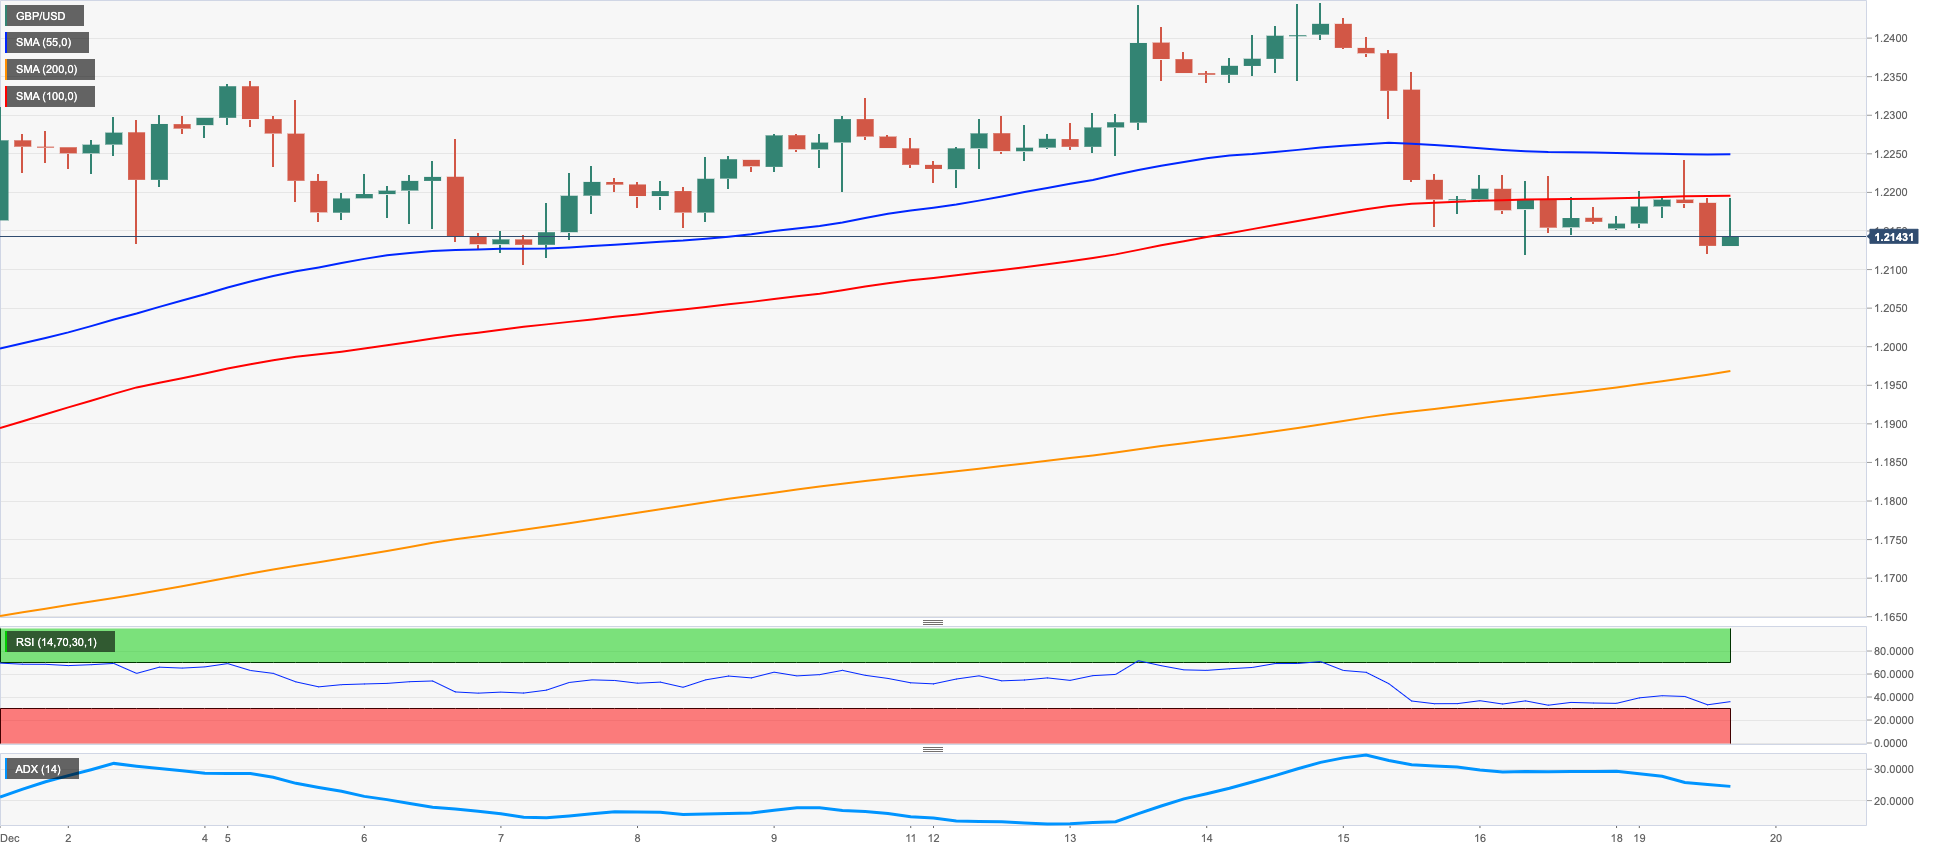
GBP/USD managed to set aside two consecutive daily pullbacks and started the week in a positive fashion helped by the corrective retracement in the greenback. Cable, however, could not sustain another breakout of the 1.2200 mark, surrendering part of those gains afterwards.
The move lower in the dollar came amidst some mild improvement in the risk-linked galaxy, while investors continued to assess the latest FOMC event as well as the dovish tilt at the BoE’s gathering.
In line with the daily uptick in the Sterling, yields of the 10-year Gilts added to Friday’s advance to levels last seen back in mid-November near 3.50%.
In the UK calendar, CBI Industrial Trends Orders dropped less than expected to -6 in December (from -5).
If the recovery gathers further traction, GBP/USD should meet the next hurdle at the December high at 1.2446 (December 14) prior to the May top at 1.2666 (May 27) and the 200-week SMA at 1.2930, all preceding the psychological 1.3000 yardstick. On the contrary, there is initial contention at the key 200-day SMA at 1.2093 before the weekly low at 1.1900 (November 30) and the interim 55- and 100-day SMAs at 1.1703 and 1.1671, respectively. South from here the pair could retest the November low at 1.1142 (November 4) ahead of the weekly low at 1.1059 (October 21). The daily RSI gathered some traction and flirted with 55.
Resistance levels: 1.2241 1.2446 1.2599 (4H chart)
Support levels: 1.2119 1.1943 1.1900 (4H chart)
AUDUSD
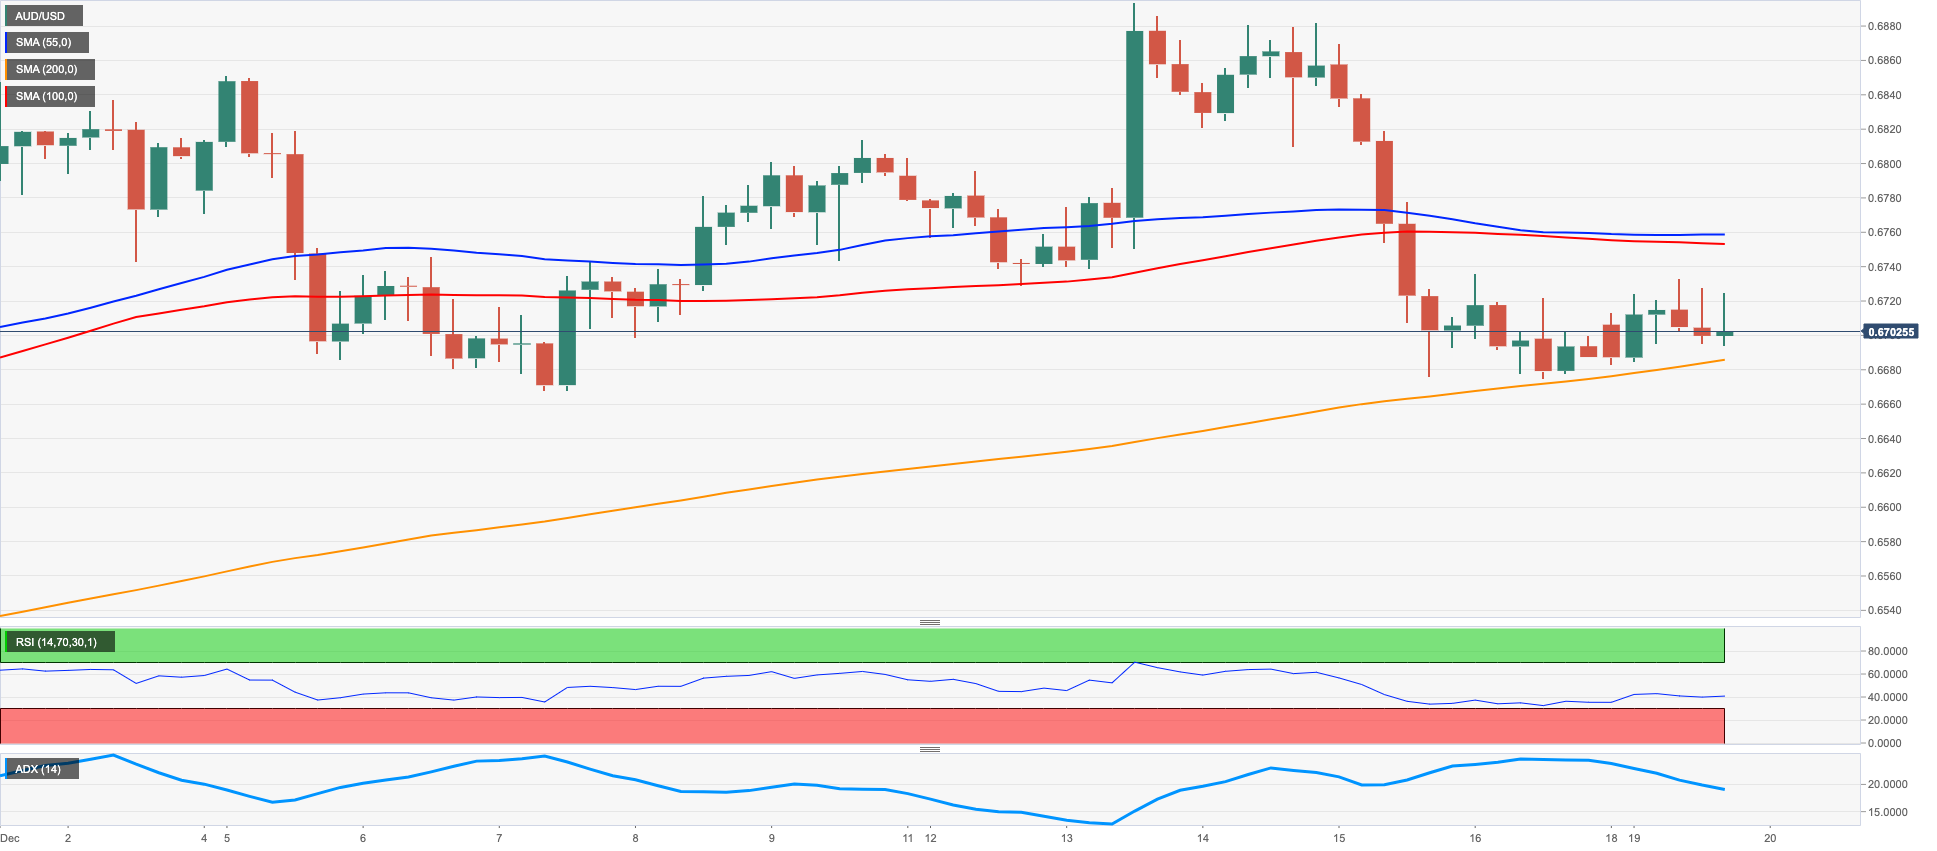
AUD/USD started the week with decent gains around the 0.6700 neighbourhood on the back of some loss of momentum in the dollar, while investors continued to adjust to the latest round of central banks’ interest rate decisions.
In spite of the softness in the buck, the commodity complex remained mostly on the defensive, with copper prices advancing modestly and the iron ore facing some selling pressure.
Nothing to write home about when it came to the data releases Down Under on Monday, whereas the RBA Minutes of the December gathering wil be the salient event on Tuesday.
Despite the daily bounce, AUD/USD still faces some downside pressure. That said, extra losses could see the weekly low at 0.6668 (December 7) revisited ahead of weekly lows at 0.6640 (November 29) and 0.6584 (November 21). Down from here appears the 55-day SMA at 0.6551 prior to the weekly low at 0.6386 (November 10). On the other hand, the immediate up barrier turns up at the December top at 0.6893 (December 13), which remains propped up by the key 200-day SMA. If spot clears this level it could then dispute the September peak at 0.6916 (September 13) ahead of the psychological 0.7000 level and the weekly high at 0.7008 (August 26). The daily RSI rose marginally past the 50 level.
Resistance levels: 0.6735 0.6773 0.6893 (4H chart)
Support levels: 0.6675 0.6668 0.6640 (4H chart)
GOLD
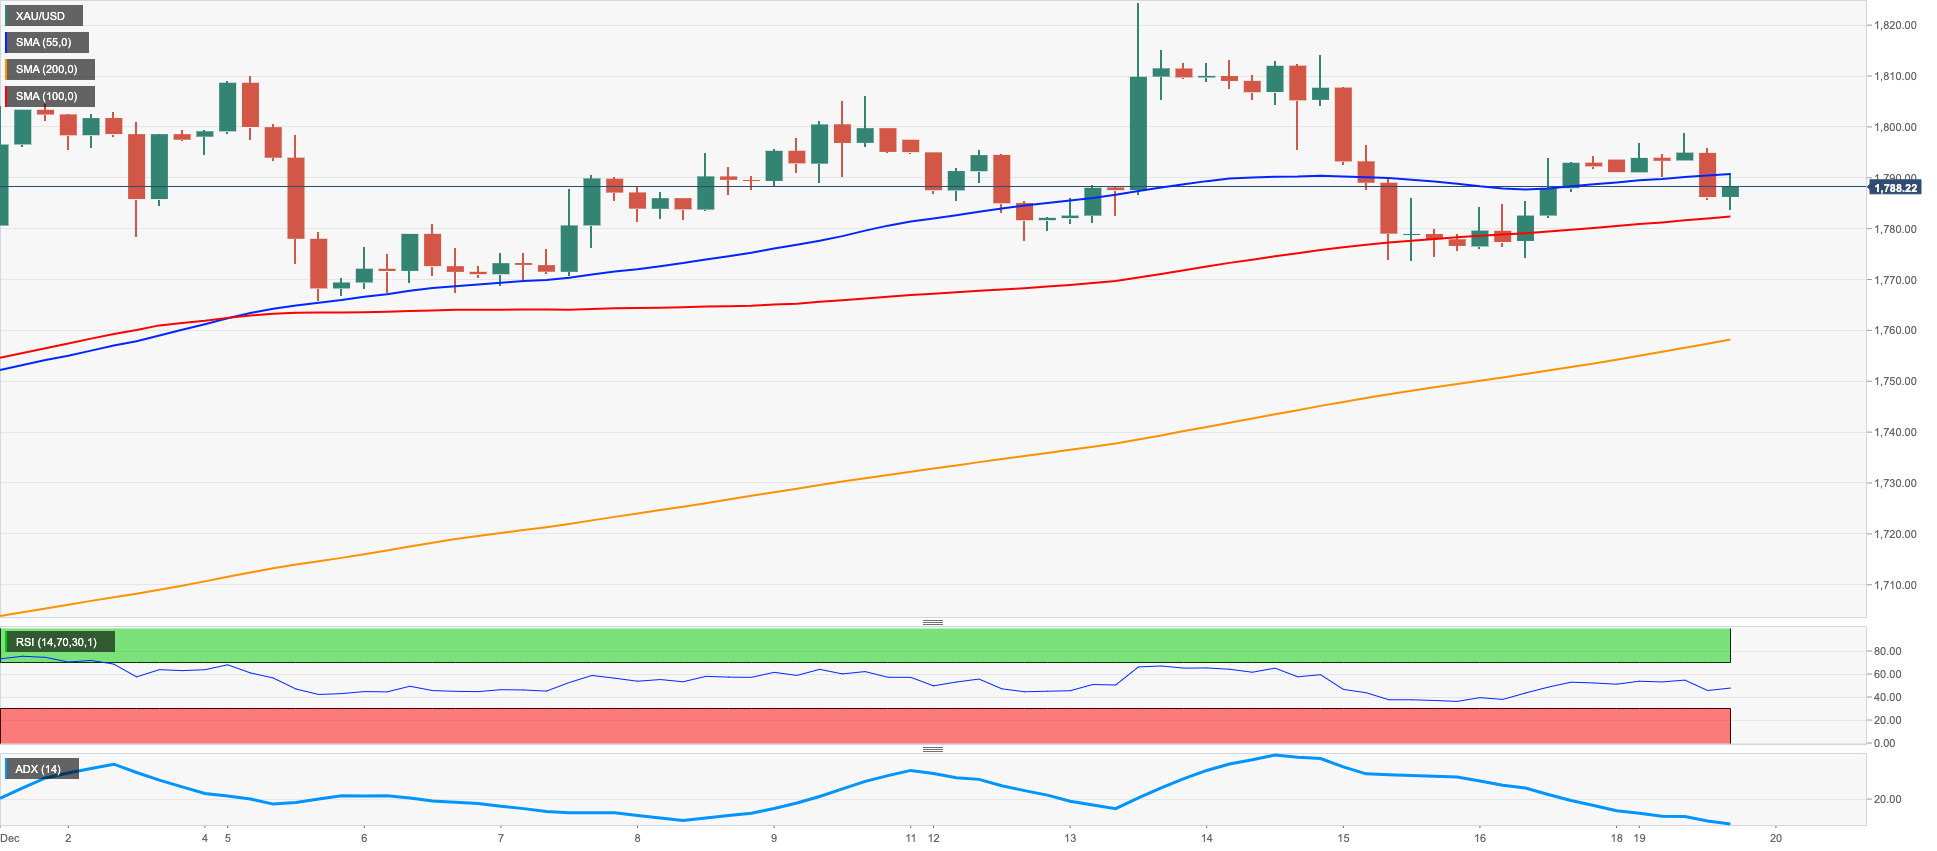
Price action around the precious metal remained choppy and slightly tilted to the negative territory at the beginning of the week.
In fact, bullion failed to capitalize on the renewed offered stance in the dollar, although the march north in US yields across the curve and prospects for a tighter-for-longer stance from the Federal Reserve forced the yellow metal to yield some ground and return to the sub-$1800 mark per ounce troy on Monday.
In the meantime, the recent hawkish events from the Fed, the BoE (despite the dovish hike) and the ECB also kept the sentiment around gold depressed and favoured further selling in the non-yielding metal.
The weekly low at $1773 (December 15) now emerges as a minor contention ahead of the December low at $1765 (December 5) and the weekly low at $1727 (November 23). Below this level comes the temporary 100- and 55-day SMAs at the $1720 region ahead of the 2022 low at $1614 (September 28) and the round level at $1600. Contrarily, bulls continue to initially target the December high at $1824 (December 13) prior to the June top at $1879 (June 13) and the May peak at $1909 (May 5).
Resistance levels: $1798 $1824 $1833 (4H chart)
Support levels: $1783 $1773 $1765 (4H chart)
CRUDE WTI
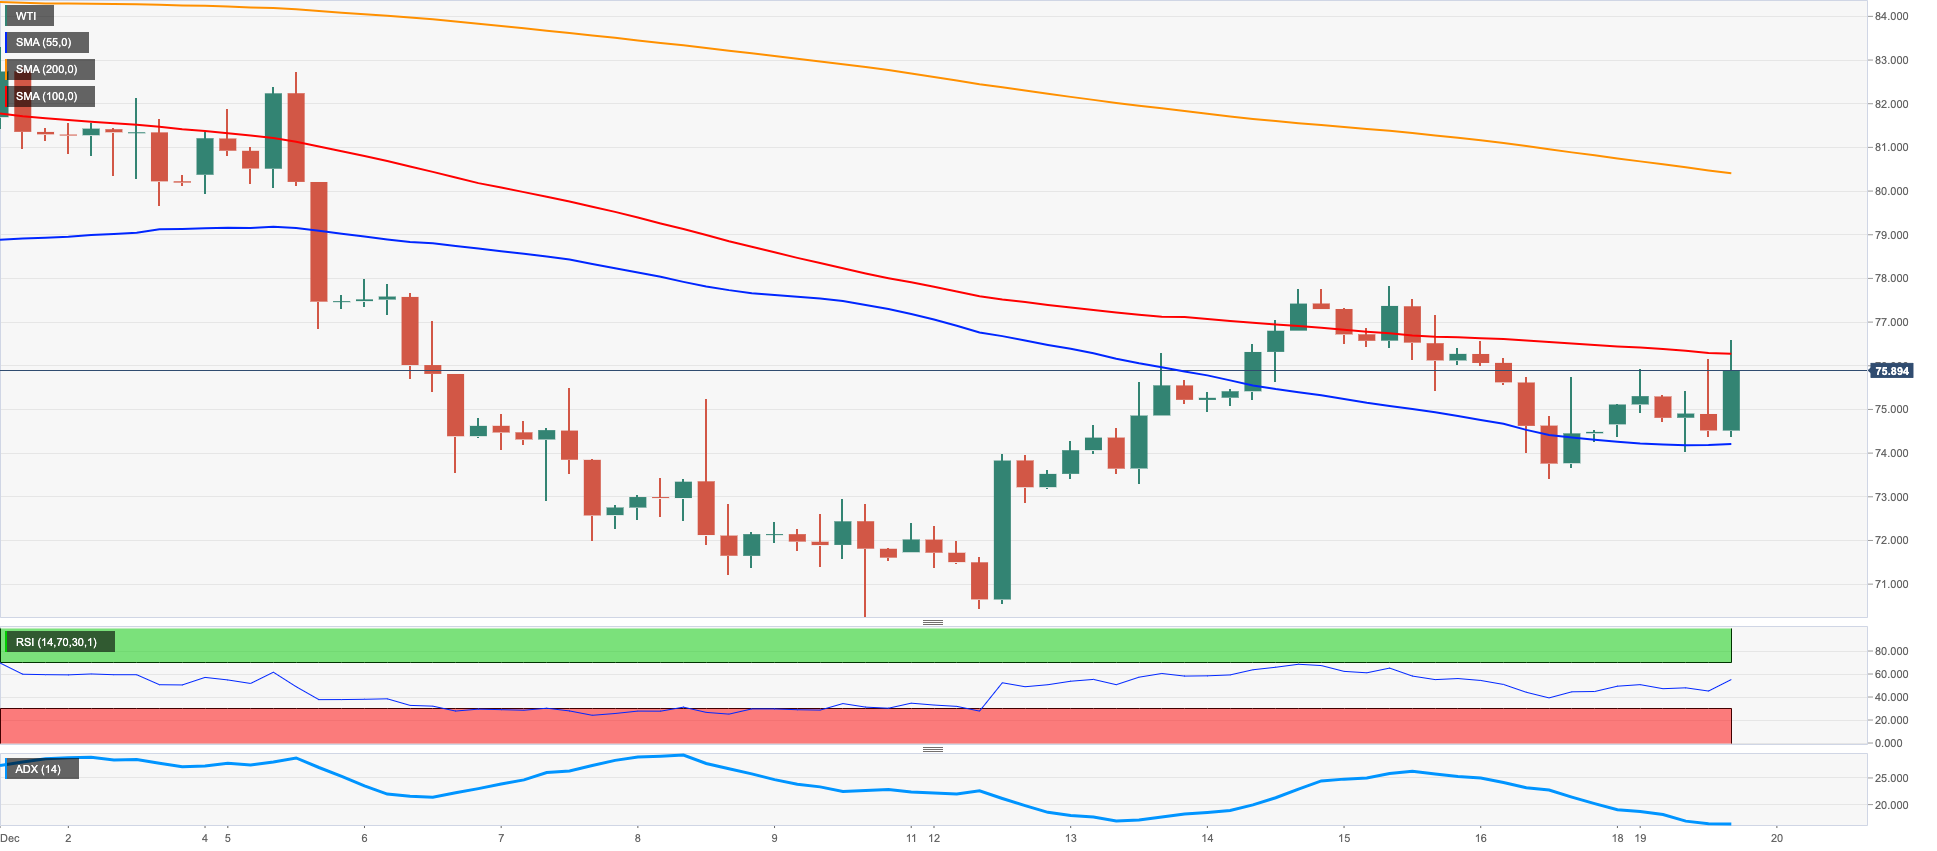
Fresh hopes regarding a potential recovery in the demand for crude oil in China seem to have eclipsed somehow omnipresent recession concerns and sent prices of the barrel of the West Texas Intermediate (WTI) past the $76.00 mark on Monday, reversing at the same time two consecutive daily pullbacks.
In addition, the weaker dollar collaborated with the upbeat note among traders, although prospects for the continuation of the hiking cycle by major central banks for now longer than previously estimated emerge as important headwinds for bullish aspirations in the commodity.
Also supporting prices appeared plans of the Biden administration to start refiling its SPR.
As usual, the API and the EIA will report on the weekly variation of US crude oil supplies on Tuesday and Wednesday, respectively.
The continuation of the recovery in prices of the WTI targets the weekly top at $77.74 (December 15) ahead of the key $80.00 mark per barrel and prior to the December peak at $83.32 (December 1). Extra gains allow a test of the provisional 100-day SMA at $85.10 before the $90.08 level (November 11). Further up aligns the November top at $93.73 followed by the key 200-day SMA at $95.66. In the opposite direction, the next support of relevance appears at the 2022 low at $70.10 (December 9) just before the key round level at $70.00 and the weekly low at $66.15 (December 20 2021). A deeper retracement could motivate the 200-week SMA at $65.17 to emerge on the horizon ahead of the December 2021 low at $62.46 (December 2).
Resistance levels: $76.60 $77.74 $81.92 (4H chart)
Support levels: $73.31 $73.19 $70.07(4H chart)
GER40
German equities tracked by the German DAX 40 advanced marginally at the beginning of the week, although it was enough to at least reverse a 3-session steep drop to the boundaries of the 13800 region (December 16).
The daily advance in German shares came in line with the broad-based upbeat mood surrounding the rest of their European peers amidst firm appetite for the risk complex, the renewed selling pressure in the US dollar and auspicious results from Germany’s Business Climate gauged by the IFO Institute for the month of December, which, according to analysts from that institute, it mitigates risks of a recession.
The uptick in the German benchmark index was also accompanied by the 4th daily gain in a row in the 10-year bund yields, this time surpassing the 2.20% level.
In spite of the daily gains, the DAX remains under scrutiny and further weakness is expected to put the December low at 13815 (December 16) back to the test ahead of the key 200-day SMA at 13567 and the 100-day SMA at 13365. The breakdown of this region carries the potential to extend to the November low at 13022 (November 3) before the minor support at 12548 (October 21). Just the opposite, the next up barrier comes at the December peak at 14675 (December 13) ahead of the June high at 14709 (June 6) and the March top at 14925 (March 29). Once cleared, a test of the 2022 peak at 16285 (January 5) could return to the radar. The daily RSI advanced past the 43 mark.
Best Performers: Dr Ing hc F Porsche AG, Siemens Energy AG, E.ON SE
Worst Performers: Volkswagen VZO, Deutsche Post, Siemens Healthineers
Resistance levels: 14001 14675 14709 (4H chart)
Support levels: 13815 13369 13022 (4H chart)
-638070752583460071.png)
NASDAQ
In line with the rest of the main US stock indices, tech equities measured by the Nasdaq Composite printed the fourth daily decline and revisited an area last seen back in early November around the 10500 zone.
Indeed, the tech sector remained under heavy pressure in response to omnipresent recession jitters, while quite a moderate bounce in US yields also added to the sour mood among traders on Monday.
Furthermore, US tech shares are expected to remain under pressure particularly following the latest hawkish message from the FOMC event, where rate setters signaled their intention to keep raising rates amidst the current elevated inflation.
Next on the downside in the Nasdaq Composite appears the November low at 10262 (November 4) prior to the 2022 low at 10088 (October 13) and the weekly low at 9663 (June 29 2020). On the flip side, there is an initial hurdle at the December top at 11571 (December 13) seconded by the key 200-day SMA at 11887 and the September peak at 12270 (September 12). If the index manages to surpass this level it could then dispute the August high at 13181 (August 16) ahead of the weekly top at 13710 (April 21) and the March peak at 14646 (March 29). The daily RSI deflated further and approached the 36 area.
Top Gainers: Madrigal Pharma, Axella Health, Soleno Therapeutics Inc
Top Losers: Cosmos Holdings, Pingtan Marine, 180 Life Sciences
Resistance levels: 11352 11439 11571 (4H chart)
Support levels: 10544 10262 10088 (4H chart)
-638070752951581557.png)
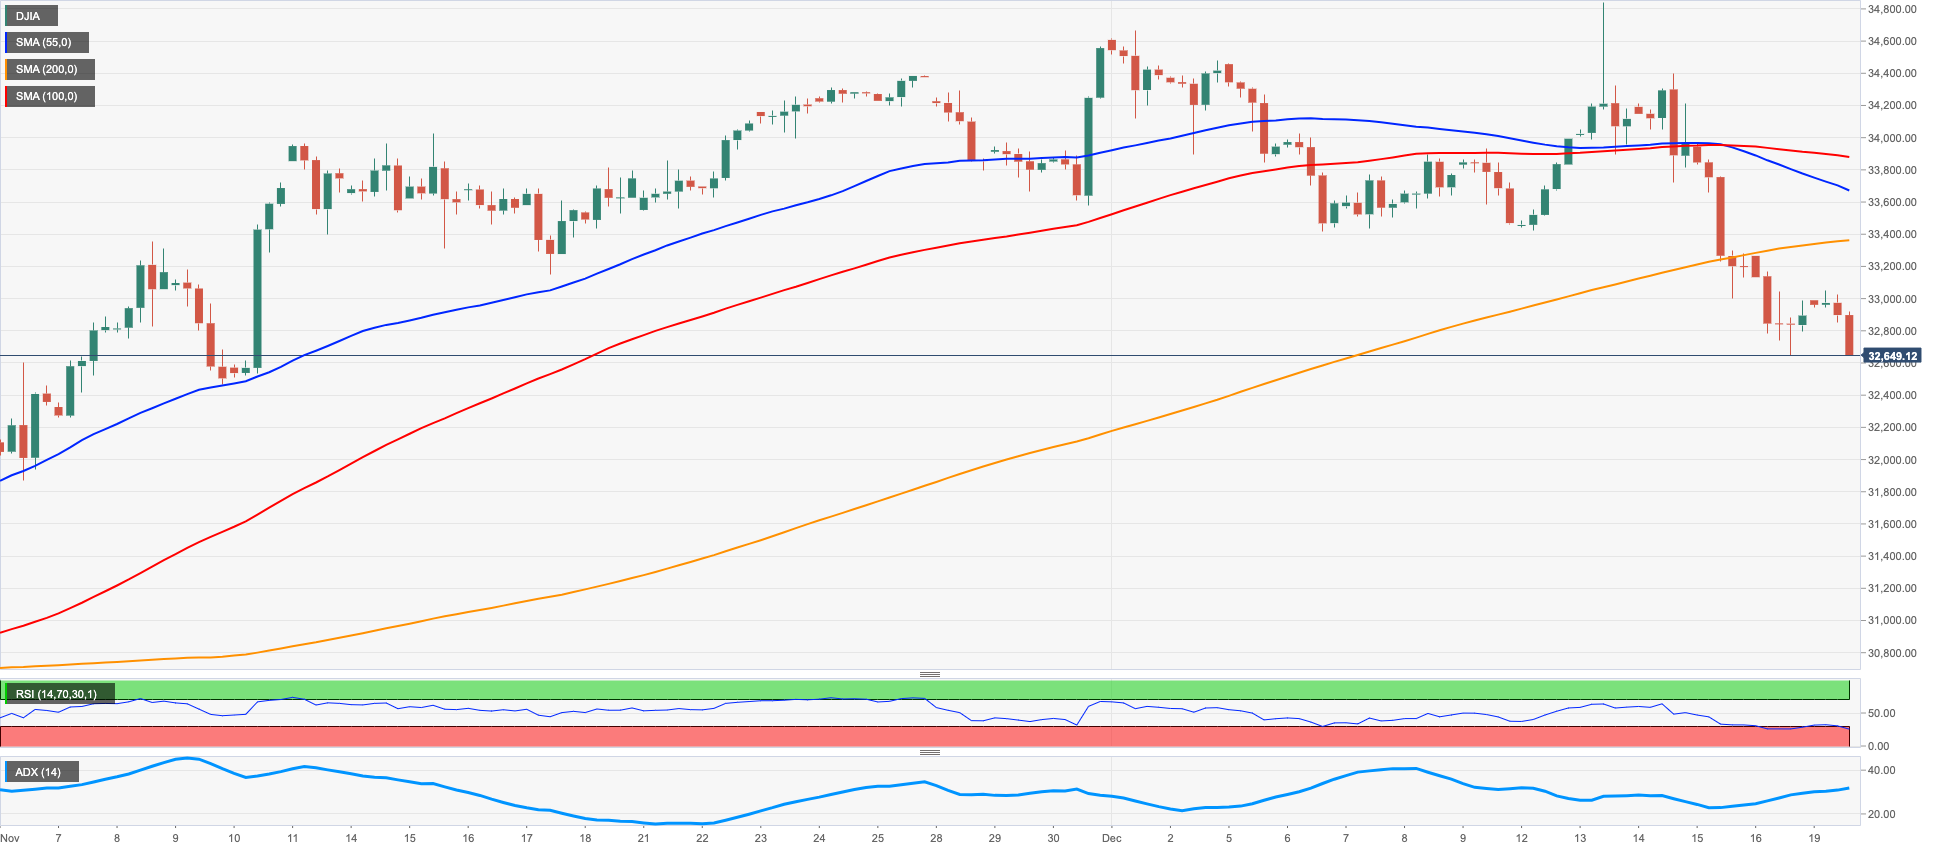
DOW JONES
Recession concerns continued to weigh on investors at the beginning of the week and sponsored the fourth daily decline in a row in equities tracked by the three major US stock indices.
Indeed, stocks retreated pari passu with so far unabated fears surrounding an economic slowdown, which appear bolstered by speculation that major central banks could extend the current tightening bias for longer.
Against that, the Dow Jones eased 0.69% to 32692, the S&P500 retreated 1.02% to 3812 and the tech-heavy Nasdaq Composite dropped 1.33% to 10562.
A deeper pullback in the Dow Jones opens the door to a potential test of the key 200-day SMA, today at 32450 ahead of the November low at 31727 (November 3). Down from here turns up of the minor support at 30206 (October 21) prior to the 2022 low at 28660 (October 13). Inversely, there are no resistance levels of importance until the December peak at 34712 (December 13) seconded by the April high at 35492 and the February top at 35824 (February 9). The daily RSI lost further ground and poked with the 40 region.
Top Performers: Boeing, Chevron, Travelers
Worst Performers: Walt Disney, Nike, Microsoft
Resistance levels: 34395 34712 35492 (4H chart)
Support levels: 32654 32478 32167 (4H chart)
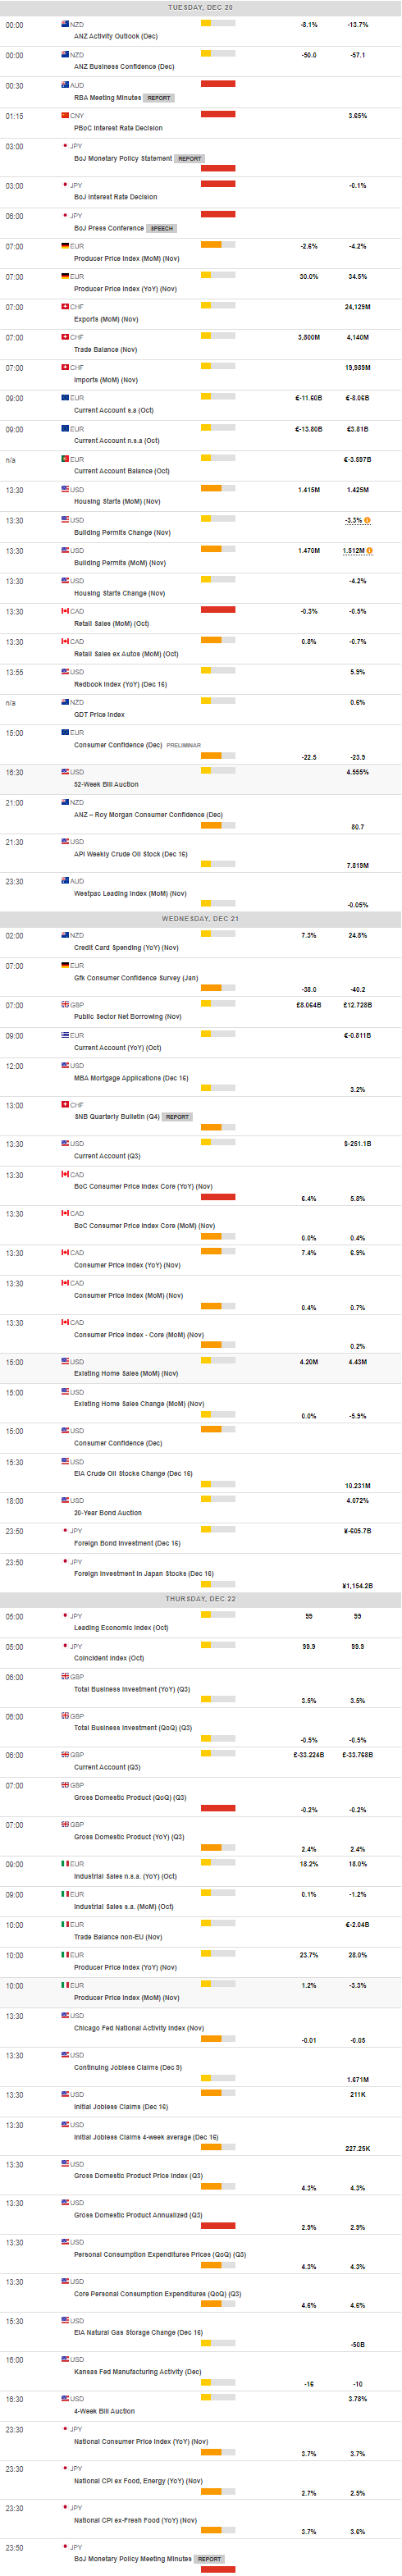
MACROECONOMIC EVENTS
All Information & Updates provided by:

All information relating to the financial markets available on this page has been prepared and issued by FXStreet (Forexstreet SL, Spain, Reg: B62498233) on the basis of publicly available information and all information believed to be reliable and does not conflict with Kuwaiti local laws, and all necessary care has been taken to before the company to ensure that the facts mentioned are correct from the source.
NCM Investment nor any of its directors or employees shall in any way be held responsible for the contents of this news, and the information contained on this page is intended only to provide clients with publicly available information and should not be construed as investment advice, report or analysis and/or constitute an offer or invitation to buy or sell financial instruments of any kind.
RISK WARNING: Forex and CFDs are highly risky leveraged products, as losses can exceed deposits. Please ensure you understand all the risks and take independent advice if necessary. NCM will segregate the clients based on the criteria of the regulator and its bylaws. NCM does not provide any advisory service; the material published does not constitute advice or a recommendation for a transaction in any financial instrument. NCM accepts no responsibility for any use of the content presented and any consequences of that use. Anyone acting on the information provided does so at their own risk.