
- Contact Us:
-

-

-

-


Daily Market Updates
21 Dec 2022
USDJPY
The Japanese yen was the strongest G10 currency on Tuesday in response to the hawkish tilt from the BoJ at the end of its 2-day gathering earlier during the Asian trading hours.
Indeed, the central bank kept the 10-year JGB yield at 0% but caught everybody off guard after announcing a wider +/- 50 bp band (from +/- 25 bp). This move by the BoJ now seems to have opened the door to markets’ speculation of a probable interest rate hike at some point in the first half of 2023.
At his press conference, Governor Kuroda sounded reiterative again (and again and again) after he stressed the bank’s readiness to ease further its monetary conditions in case of need, adding that the country’s economy remains surrounded by uncertainty and that inflation is seen losing upside pressure in H2 2023.
Following the BoJ’s surprise, USD/JPY collapsed more than 4% at its worst moment and seems to have met some initial respite around the 131.00 neighbourhood, an area last visited back in early August.
The loss of the December low at 1310.00 could pave the way for USD/JPY to confront the August low at 130.39 (August 2) prior to the key round level at 130.00. On the contrary, the initial resistance level appears at the weekly high at 138.17 (December 15) followed by another weekly top at 139.89 (November 30) and the round level at 140.00. Beyond the latter comes the interim 100-day SMA at 141.17 prior to the weekly peak at 142.25 (November 21) and the 55-day SMA at 142.37. The daily RSI poked with the oversold territory near 30.
Resistance levels: 137.47 138.17 139.89 (4H chart)
Support levels: 131.00 130.57 129.51 (4H chart)
-638071625752990845.png)
GBPUSD
GBP/USD extended the inconclusive start of the week and traded in a volatile fashion between the 1.2220 area and the 1.2080 region on Tuesday.
Once again, Cable failed to capitalize on the intense sell-off in the greenback, while the upside potential in the British pound appeared largely limited by the collapse in GBP/JPY (amidst the strong bounce in the Japanese currency) in the wake of the BoJ event earlier in the session.
In the UK money market, the 10-year gilt yields rose for the third session in a row, this time to multi-week highs around 3.65%.
The UK docket was empty on Tuesday, whereas Public Sector Net Borrowing figures will take centre stage on Wednesday as well as CBI Distributive Trends.
If GBP/USD loses the key 200-day SMA at 1.2088, it could then open the door to a deeper retracement to the weekly low at 1.1900 (November 30) prior to the temporary 55- and 100-day SMAs at 1.1715 and 1.1671, respectively. Further south emerges the November low at 1.1142 (November 4) before the weekly low at 1.1059 (October 21). Contrastingly, the immediate up barrier remains at the December top at 1.2446 (December 14) seconded by the May peak at 1.2666 (May 27) and the 200-week SMA at 1.2929, which precedes the psychological 1.3000 level. The daily RSI looked stable around the 54 zone.
Resistance levels: 1.2241 1.2446 1.2599 (4H chart)
Support levels: 1.2084 1.1943 1.1900 (4H chart)
-638071625247731776.png)
AUDUSD
Indeed, in what was the sole event in the Australian calendar on Tuesday, the RBA Minutes said that members assessed the probability of pausing the hiking cycle, although this scenario was later ruled out on the back of insufficient information to warrant that outlook and the fact that no other major central bank had paused yet. The RBA reiterated that further rate hikes remain on the table although this is not a pre-set path, while decisions on upcoming rate hikes remain data dependent.
The prevailing weaker dollar lent much needed oxygen to the commodity space and this somewhat limited the pair’s losses on Tuesday.
AUD/USD recorded a new December low at 0.6629 (December 20). The breach of this level could put the weekly low at 0.6584 (November 21) back on the investors’ radar ahead of the 55-day SMA at 0.6554 and another weekly low at 0.6386 (November 10). Meanwhile, the key 200-day SMA at 0.6889 now appears as the next up barrier just ahead of the December peak at 0.6893 (December 13) and the September high at 0.6916 (September 13). Further up comes the psychological 0.7000 mark followed by the weekly top at 0.7008 (August 26). The daily RSI deflated to the vicinity of 47.
Resistance levels: 0.6744 0.6773 0.6893 (4H chart)
Support levels: 0.6629 0.6584 0.6386 (4H chart)
-638071626225840872.png)
GOLD
Gold prices rose to multi-session peaks and revisited the $1820 region per ounce troy on turnaround Tuesday in a context dominated by the offered stance in the greenback and the outperformance of the Japanese yen, particularly in response to the hawkish tweak at its monetary policy meeting.
Indeed, the continuation of the selling bias in the dollar gave extra legs to the yellow metal and encouraged traders to reclaim the area beyond the critical hurdle at $1800.
However, the firm note in US yields prevented bullion from extending the rebound further north, as prospects for the continuation of the tightening bias from the Federal Reserve remained unchanged.
Gold traded at shouting distance from the December top at $1824 (December 13). If the precious metal leaves behind this level it could then confront the June peak at $1879 (June 13) followed by the May high at $1909 (May 5). On the other hand, the weekly low at $1773 (December 15) should hold the initial downside test prior to the December low at $1765 (December 5) and the weekly low at $1727 (November 23). The breakdown of the latter exposes the interim 100- and 55-day SMAs near $1720 before the 2022 low at $1614 (September 28) and the round level at $1600.
Resistance levels: $1821 $1824 $1833 (4H chart)
Support levels: $1783 $1773 $1765 (4H chart)
-638071626664134020.png)
CRUDE WTI
Prices of the barrel of the American reference for the sweet light crude oil added to Monday’s modest advance and regained the area above the $76.00 mark on Tuesday.
The small improvement in prices of the WTI came pari passu with traders’ assessment of recent news that the Biden administration plans to re-stock its SPR, while the persevering losses in the dollar also added to the optimism around the commodity.
Limiting the upside, however, appeared fresh concerns regarding an expected colder winter in the US and its direct impact on the travel industry as well as the unabated pick-up in COVID cases in China.
Later in the NA session, the API will publish its report on US crude oil inventories in the week to December 16.
Next on the upside for the WTI comes the weekly peak at $77.74 (December 15) followed by the key $80.00 mark per barrel and the December high at $83.32 (December 1). The move above this level could prompt the 100-day SMA at $84.93 to re-emerge on the horizon ahead of the $90.08 level (November 11). North from here aligns the November peak at $93.73 prior to the key 200-day SMA at $95.53. Alternatively, sellers face the next support at the 2022 low at $70.10 (December 9) closely followed by the key round level at $70.00 and the weekly low at $66.15 (December 20 2021). Down from here emerges the 200-week SMA at $65.17 before the December 2021 low at $62.46 (December 2).
Resistance levels: $76.60 $77.74 $80.39 (4H chart)
Support levels: $73.31 $73.19 $70.07 (4H chart)
-638071627650948281.png)
GER40
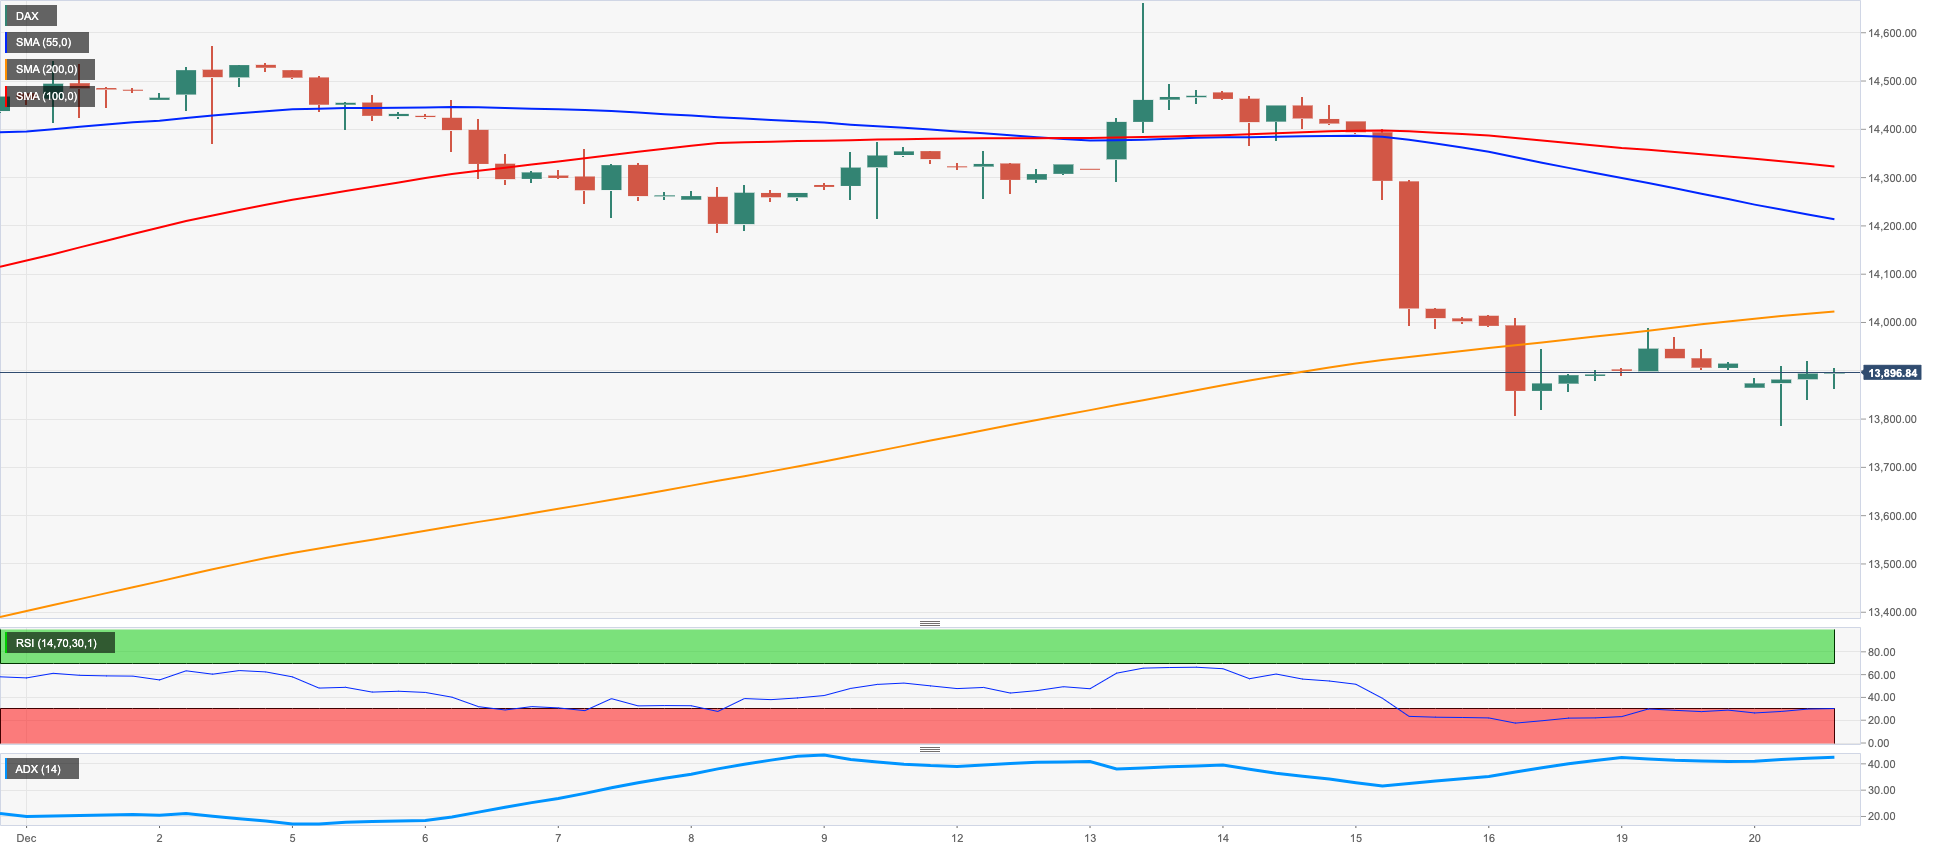
German stocks rapidly left behind Monday’s marginal advance and resumed the downtrend on Tuesday when tracked by the German benchmark DAX 40.
Indeed, the index retreated to levels last traded back in early November near the 13800 zone following another round of hawkish remarks from ECB’s rate setters amidst rising speculation of extra 50 bps rate hikes by the central bank at the next meetings.
On a positive note, the Consumer Confidence in the euro area gauged by the European Commission improved slightly in December to -22.2 and somewhat underpinned the optimism following the better-than-expected Business Climate figures in Germany released on Monday.
In the domestic debt market, yields of the 10-year bund rose further and reached the 2.30% region, or multi-week peaks.
DAX bears now need to clear the December low at 13791 (December 20) to open the door to the key 200-day SMA at 13568 and the 100-day SMA at 13369. South from here comes the November low at 13022 (November 3) prior to the minor support at 12548 (October 21). Conversely, the December high at 14675 (December 13) turns up as the immediate hurdle ahead of the June top at 14709 (June 6) and the March peak at 14925 (March 29). The breakout of the latter exposes the 2022 high at 16285 (January 5). The daily RSI eased below the 42 level.
Best Performers: Deutsche Bank AG, Bayer, Brenntag AG
Worst Performers: Siemens Healthineers, Dr Ing hc F Porsche Prf, Vonovia
Resistance levels: 14001 14675 14709 (4H chart)
Support levels: 13791 13369 13022 (4H chart)
NASDAQ
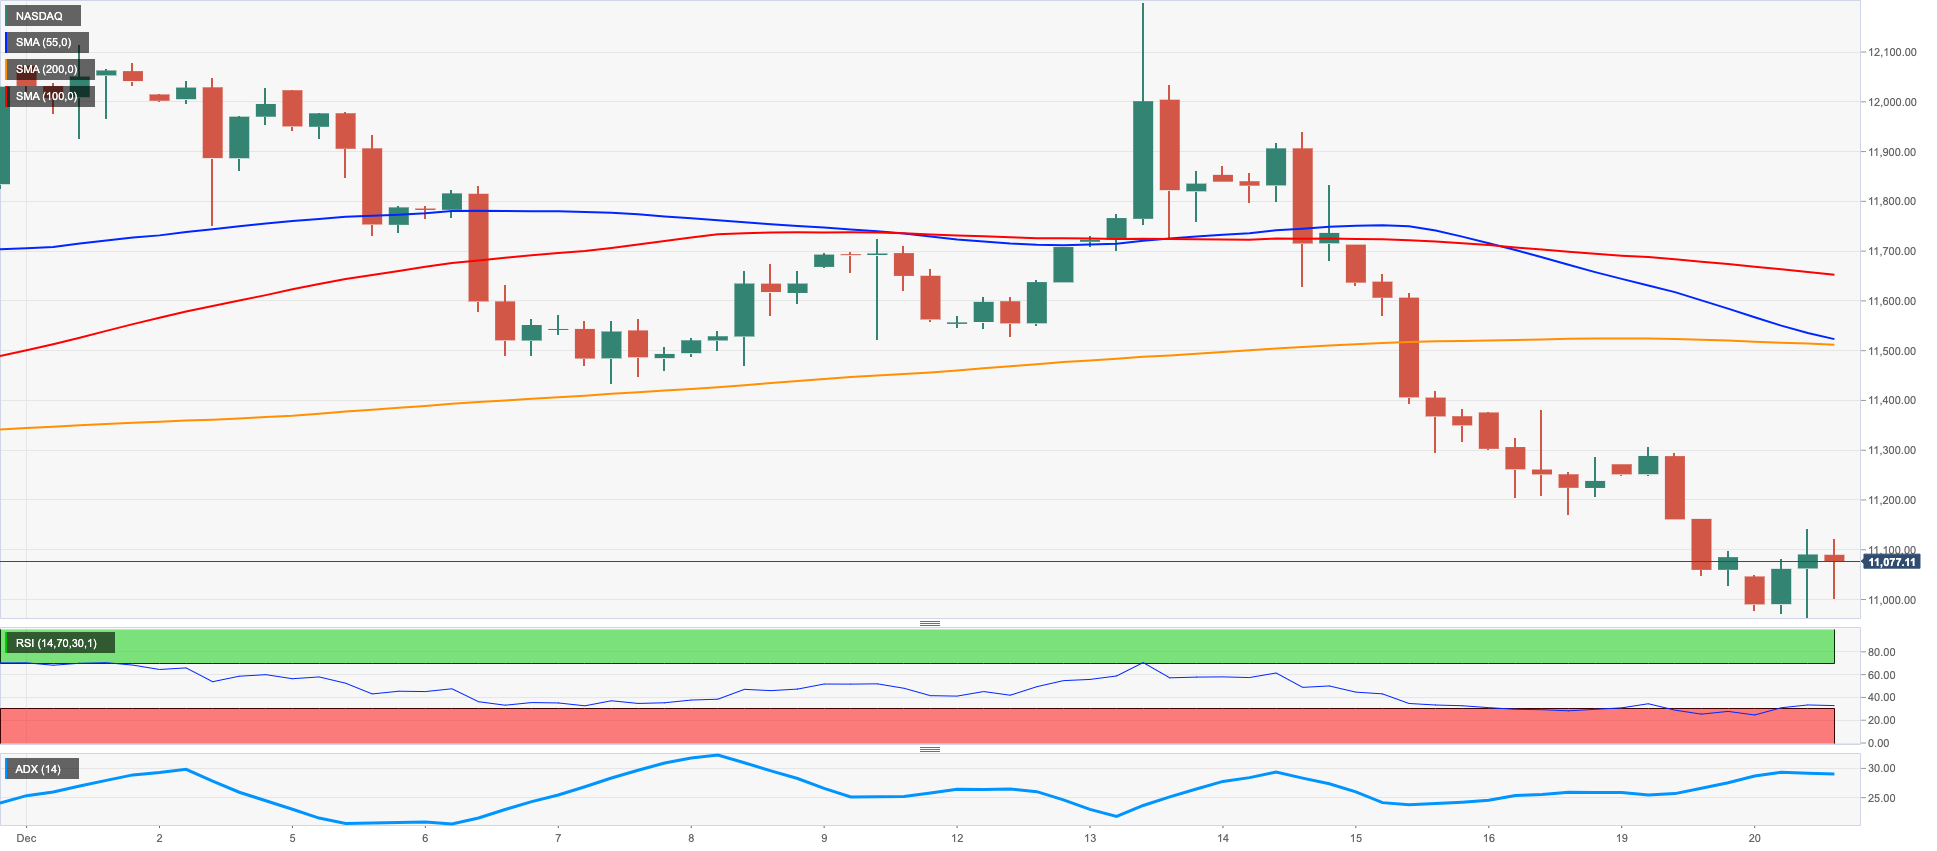
Following four straight sessions closing in the red territory, US tech stocks gauged by the Nasdaq Composite finally charted decent gains on Tuesday.
Indeed, techs equities followed the renewed optimism in the rest of the US sectors and partially reversed the recent weakness, all against the backdrop of the persistent weakness in the dollar, which was particularly exacerbated following the BoJ event during early trade.
Further upside in the index, however, looked curtailed amidst another positive day in US yields across the curve, always in response to the perception that the Fed will skip any impasse of its tightening cycle for the time being.
The Nasdaq Composite remains under pressure in spite of Tuesday’s bounce. Against that, the November low at 10262 (November 4) turns up as the next target ahead of the 2022 low at 10088 (October 13) and the weekly low at 9663 (June 29 2020). Just the opposite, there is temporary hurdles at the 55- and 100-day SMAs at 10925 and 11403, respectively, prior to the December peak at 11571 (December 13) and the key 200-day SMA at 11876. Further north emerges the September high at 12270 (September 12) before the August top at 13181 (August 16) and the weekly peak at 13710 (April 21). The daily RSI rose a tad past the 39 mark.
Top Gainers: Icecure Medical, 180 Life Sciences, Verona Pharma ADR
Tope Losers: Magenta Therapeutics, Biovie Inc, Proteostasis Therapeutics
Resistance levels: 11352 11439 11571 (4H chart)
Support levels: 10446 10262 10088 (4H chart)
DOW JONES
Finally, some respite for equities in the US markets, as some dip buying mood turned up on Tuesday.
In addition, the sour sentiment around the greenback and higher crude oil prices also lent support to stocks, which managed to reverse fourth consecutive sessions with losses.
Overall, the Dow Jones gained 0.56% to 32938, the S&P500 advanced 0.38% to 3832 and the tech-benchmark Nasdaq Composite rose 0.26% to 10572.
Further weakness in the Dow Jones could put the December low at 32581 (December 16) to the test just ahead of the key 200-day SMA at 32451 and the November low at 31727 (November 3). The loss of the latter could put the minor support at 30206 (October 21) back to the test ahead of the 2022 low at 28660 (October 13). In the opposite direction, the December high at 34712 (December 13) remains the initial target for bulls ahead of the April top at 35492 and followed by the February peak at 35824 (February 9). The daily RSI bounced modestly to the proximity of 45.
Top Performers: Boeing, Chevron, Travelers
Worst Performers: Intel, Nike, Home Depot
Resistance levels: 34395 34712 35492 (4H chart)
Support levels: 32581 32478 32171 (4H chart)
-638071628270182695.png)
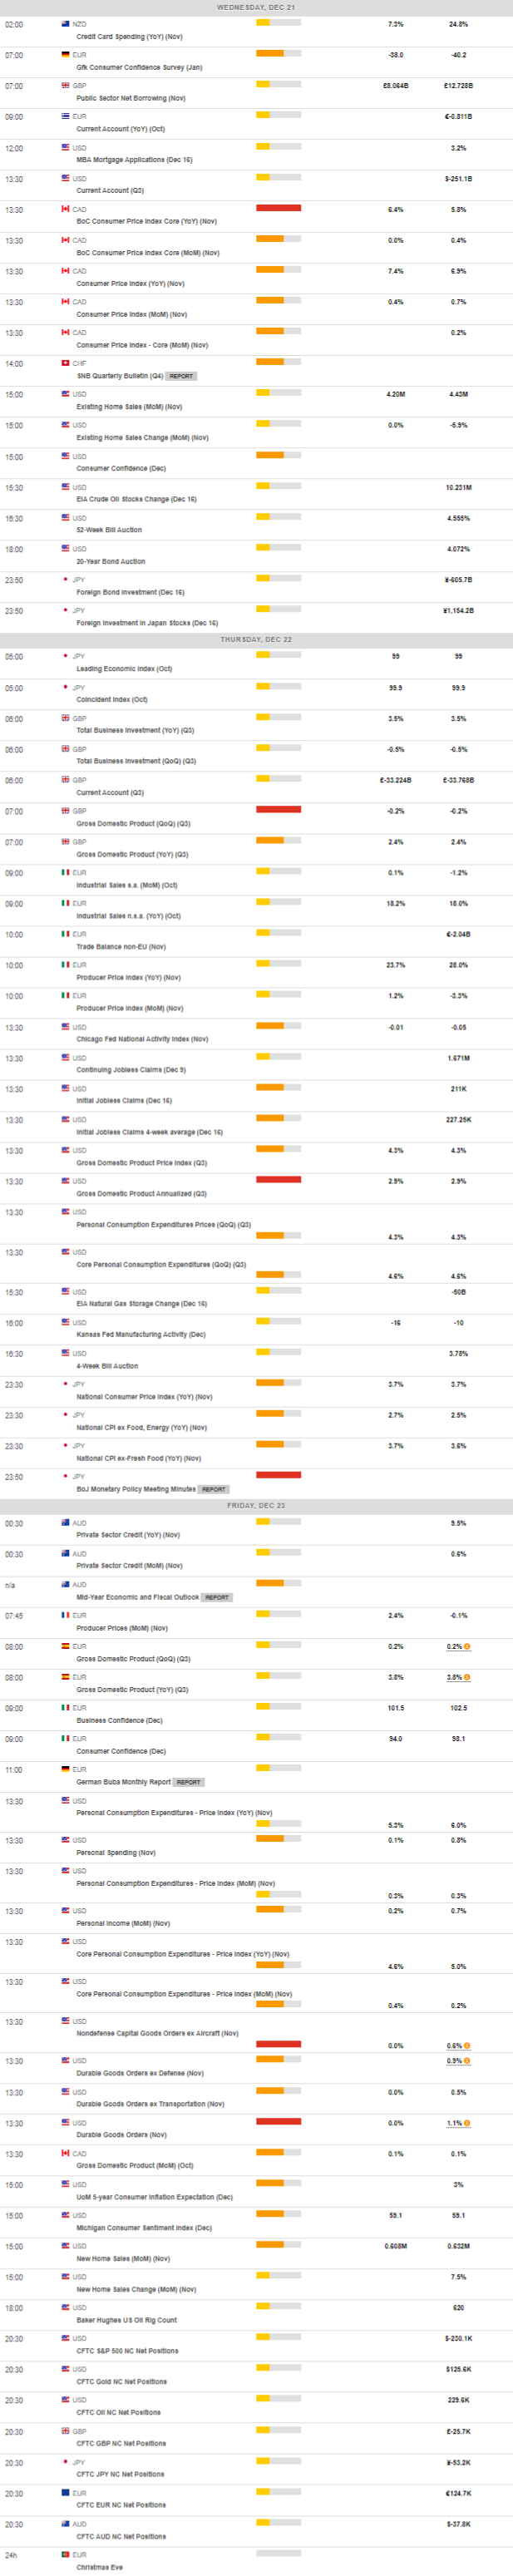
MACROECONOMIC EVENTS
All Information & Updates provided by:

All information relating to the financial markets available on this page has been prepared and issued by FXStreet (Forexstreet SL, Spain, Reg: B62498233) on the basis of publicly available information and all information believed to be reliable and does not conflict with Kuwaiti local laws, and all necessary care has been taken to before the company to ensure that the facts mentioned are correct from the source.
NCM Investment nor any of its directors or employees shall in any way be held responsible for the contents of this news, and the information contained on this page is intended only to provide clients with publicly available information and should not be construed as investment advice, report or analysis and/or constitute an offer or invitation to buy or sell financial instruments of any kind.
RISK WARNING: Forex and CFDs are highly risky leveraged products, as losses can exceed deposits. Please ensure you understand all the risks and take independent advice if necessary. NCM will segregate the clients based on the criteria of the regulator and its bylaws. NCM does not provide any advisory service; the material published does not constitute advice or a recommendation for a transaction in any financial instrument. NCM accepts no responsibility for any use of the content presented and any consequences of that use. Anyone acting on the information provided does so at their own risk.