
- Contact Us:
-

-

-

-


Daily Market Updates
22 Dec 2022
USDJPY
Following Tuesday’s pronounced BoJ-led sell-off to the mid-130.00s, USD/JPY managed to regain some composure and reclaimed the 132.00 hurdle and above on Wednesday.
The move higher in the pair came in tandem with a decent recovery in the dollar despite US yields grinded lower across the curve.
In the meantime, and in the wake of the recent pivot in the BoJ’s monetary policy, investors seem to have started to pencil in a probable interest rate hike as soon as at the March 10 meeting.
In the Japanese money market, the 10-year JGB yields rose to levels just shy of 0.50%, an area last traded back in July 2015.
There were no data releases in the Japanese calendar on Wednesday.
If sellers regain control, they could prompt USD/JPY to revisit the December low at 130.56 (December 20) closely followed by the August low at 130.39 (August 2) and ahead of the key round level at 130.00. Contrastingly, the initial up barrier aligns at the weekly top at 138.17 (December 15) prior to another weekly peak at 139.89 (November 30) and the round level at 140.00. The breakout of this level could pave the way for a test of the temporary 100- and 55-day SMAs at 141.16 and 142.15, respectively, before the weekly peak at 142.25 (November 21). The daily RSI bounced to the area near the 33 level.
Resistance levels: 132.52 137.47 138.17 (4H chart)
Support levels: 130.56 129.51 127.08 (4H chart)
-638072480073069072.png)
GBPUSD
Fresh demand for the greenback put the British pound and the risk complex in general under renewed downside pressure on Wednesday.
That said, GBP/USD set aside two daily advances in a row and retreated markedly to the 1.2050 region midweek, breaking below the key 200-day SMA at the same time.
Further weakness around the quid came after the UK’s public sector budget deficit (Public Sector Net Borrowing) rose to £21.2B in November (from £13.4B). Further results saw the CBI Distributive Trades improve to 11 in December (from -19).
The loss of the key 200-day SMA at 1.2083 could force GBP/USD to extend the leg lower to the weekly low at 1.1900 (November 30) ahead of the provisional 55- and 100-day SMAs at 1.1730 and 1.1671, respectively. Extra losses from here could expose the November low at 1.1142 (November 4) prior to the weekly low at 1.1059 (October 21). On the flip side, occasional bullish attempts keep targeting the December peak at 1.2446 (December 14) followed by the May high at 1.2666 (May 27) and the 200-week SMA at 1.2929, all ahead of the psychological 1.3000 mark. The daily RSI receded further and tested the 51 region.
Resistance levels: 1.2241 1.2446 1.2599 (4H chart)
Support levels: 1.2055 1.1994 1.1900 (4H chart)
-638072479663945339.png)
AUDUSD
AUD/USD extended the weekly consolidation and advanced decently to the area past 0.6700 midweek despite the corrective upside in the US dollar and its impact on the high-beta currencies and the risk-associated universe.
The mixed tone in the risk space seems to have been enough to sustain the daily gains in the pair, with copper prices advancing for the third session in a row and the iron ore struggling to leave behind the $110.00 mark on a convincing note.
Extra support for the Aussie dollar was also seen after China’s Xi Jinping advocated for a strategic partnership with Australia, adding that the development of stable ties between the two countries could lead to peace, stability and prosperity in the region.
In Oz, the Westpac Leading Index contracted 0.1% from the month before in November.
Further consolidation in AUD/USD looks likely in the near term. Against that, the December low at 0.6629 (December 20) should hold the initial downside test prior to the weekly low at 0.6584 (November 21) ahead of the 55-day SMA at 0.6558 and another weekly low at 0.6386 (November 10). On the contrary, there is an important hurdle at the key 200-day SMA at 0.6886, which precedes the December high at 0.6893 (December 13) and seconded by the September top at 0.6916 (September 13). North from here turns up the psychological 0.7000 level just before the weekly peak at 0.7008 (August 26). The daily RSI edged higher and trespassed 50.
Resistance levels: 0.6728 0.6744 0.6773 (4H chart)
Support levels: 0.6629 0.6584 0.6386 (4H chart)
-638072480441902451.png)
GOLD
Bullion prices charted an inconclusive session, although they managed well to remain above the critical $1800 mark per ounce troy on Wednesday.
In fact, the yellow metal retreated marginally on Wednesday against the backdrop of the decent rebound in the US dollar, while fresh weakness in US yields across the curve kept the daily downside somewhat contained.
Moving forward, price action around the precious metal is expected to keep tracking developments from the Fed and is predicted to remain under the microscope particularly in response to the hawkish tilt at the latest FOMC event.
The December peak at $1824 (December 13) remains the immediate magnet for gold bulls for the time being. The surpass of this level could encourage the metal to dispute the June high at $1879 (June 13) ahead of the May top at $1909 (May 5). Meanwhile, the 200-day SMA at $1784 should offer decent contention seconded by the weekly low at $1773 (December 15) and the December low at $1765 (December 5). The breach of this region could lead up to a potential visit to the weekly low at $1727 (November 23) before the temporary 100- and 55-day SMAs around $1720 and ahead of the 2022 low at $1614 (September 28).
Resistance levels: $1824 $1833 $1841 (4H chart)
Support levels: $1783 $1773 $1764 (4H chart)
-638072480832608726.png)
CRUDE WTI
WTI prices rose to multi-day peaks above the $78.00 mark per barrel on Wednesday.
The third consecutive daily advance in prices of the black gold came in response to a larger-than-expected drop in US crude oil inventories in the week to December 16.
On the latter, the EIA informed that crude oil stockpiles shrank by 5.894M barrels, while supplies at Cushing rose by 0.853M barrels, distillate stocks dropped by 0.242M barrels and gasoline inventories went up by 2.530M barrels.
Also supporting the ongoing uptrend in prices remained the US plans to start restocking its SPR, while hopes of further Chinese reopening also added to the positive sentiment among traders.
On the flip side of the coin, bad weather is expected to hit the US with the consequent impact on the travel industry, while the upcoming resumption of the normal activity in the Keystone Pipeline also emerges as another headwind for the continuation of the upside momentum in the commodity.
WTI approaches the key $80.00 mark per barrel. Once cleared, prices could put the December top at $83.32 (December 1) to the test ahead of the 100-day SMA at $84.80 and the $90.08 level (November 11). The breakout of this region could prompt a test of the November high at $93.73 to start shaping up prior to the key 200-day SMA at $95.44. Contrarily, next support comes at the 2022 low at $70.10 (December 9), which precedes the key round level at $70.00 and the weekly low at $66.15 (December 20 2021). A deeper drop could revisit the 200-week SMA at $65.18 ahead of the December 2021 low at $62.46 (December 2).
Resistance levels: $78.44 $80.01 $82.70 (4H chart)
Support levels: $74.42 $73.31 $73.19 (4H chart)
-638072481632664608.png)
GER40
German equities tracked by the DAX 40 advanced to 4-day highs and reclaimed the area past the key 14000 mark midweek.
Indeed, optimism among traders grew bigger on Wednesday following auspicious news from US-listed Nike and the positive performance from its European peers Adidas and Puma, both showing some renewed faith in the retail sector.
Collaborating with the upside bias, Germany’s Consumer Confidence measured by GfK improved slightly in January and added to the uptick in the same gauge for the broader Euroland published earlier in the week by the European Commission.
Back to the German money market, yields of the 10-year bund seem to have met a tough barrier around 2.30% following a 5-day positive streak.
Extra recovery in the DAX is now expected to revisit the December top at 14675 (December 13) prior to the June peak at 14709 (June 6). The trespass of the latter could open the door to the March high at 14925 (March 29) before the 2022 top at 16285 (January 5). In the opposite direction, the December low at 13791 (December 20) could return to the fore in case sellers regain the upper hand. The breach of this region exposes the key 200-day SMA at 13569 followed by the 100-day SMA at 13374. South of this area appears the November low at 13022 (November 3) ahead of the minor support at 12548 (October 21). The daily RSI rose firmly to the boundaries of 50.
Best Performers: Adidas, Zalando SE, Vonovia
Worst Performers: Bayer, Henkel VZO, Volkswagen VZO
Resistance levels: 14099 14675 14709 (4H chart)
Support levels: 13791 13369 13022 (4H chart)
-638072482623468420.png)
NASDAQ
Tech equities printed gains for the second session in a row on Wednesday and managed to retake the 10700 mark and beyond following Tuesday’s multi-week lows near the 10400 zone.
The solid performance of the US retail sector seems to have lent much needed oxygen to the rest of the US stocks, which appears to have been also boosted by better-than-estimated readings from the US Consumer Confidence print for the month of December.
Also helping tech stocks was the move lower in US yields, which managed to trim part of the recent upside, especially in the belly and the long end of the curve.
Next on the upside for the Nasdaq Composite emerges the 55- and 100-day SMAs at 10917 and 11386, respectively, ahead of the December high at 11571 (December 13) and the key 200-day SMA at 11865. If the index clears the latter, it could then dispute the September top at 12270 (September 12) followed by the August peak at 13181 (August 16) and the weekly high at 13710 (April 21). Inversely, the November low at 10262 (November 4) comes first prior to the 2022 low at 10088 (October 13) and the weekly low at 9663 (June 29 2020). The daily RSI added to the recent strength and approached 44.
Top Gainers: SINTX Technologies Inc, Cenntro Electric Group Ltd, Oceanpal
Top Losers: Pingtan Marine, Meiwu Technology, Core Scientific
Resistance levels: 10742 11352 11399 (4H chart)
Support levels: 10446 10262 10088 (4H chart)
-638072482987086458.png)
DOW JONES
US equities added to Tuesday’s gains and rose to multi-session highs on Wednesday.
Indeed, better-than-expected results from Nike lifted spirits among market participants and extended the optimism to the rest of the sectors in all three major US stock indices.
Also collaborating with the upbeat sentiment, the Consumer Confidence gauged by the Conference Board rose beyond consensus for the month of December and somewhat helped investors set aside, albeit momentarily, recession concerns and inflation fears.
All in all, the Dow Jones rose 1.54% to 33355, the S&P500 gained 1.52% to 3879 and the tech-reference Nasdaq Composite advanced 1.56% to 10711.
If the rebound in the Dow Jones gathers extra steam it could confront the December top at 34712 (December 13) prior to the April peak at 35492 and the February high at 35824 (February 9). Alternatively, a drop below the December low at 32581 (December 16) should leave the index vulnerable to a rapid test of the key 200-day SMA at 32455 ahead of the November low at 31727 (November 3). Down from here emerges the minor support at 30206 (October 21) before the 2022 low at 28660 (October 13). The daily RSI leapt to the 50 neighbourhood.
Top Performers: Nike, Boeing, Apple
Worst Performers: Walgreen Boots, McDonald’s, Walt Disney
Resistance levels: 33437 34395 34712 (4H chart)
Support levels: 32581 32478 32171 (4H chart)
-638072482098524440.png)
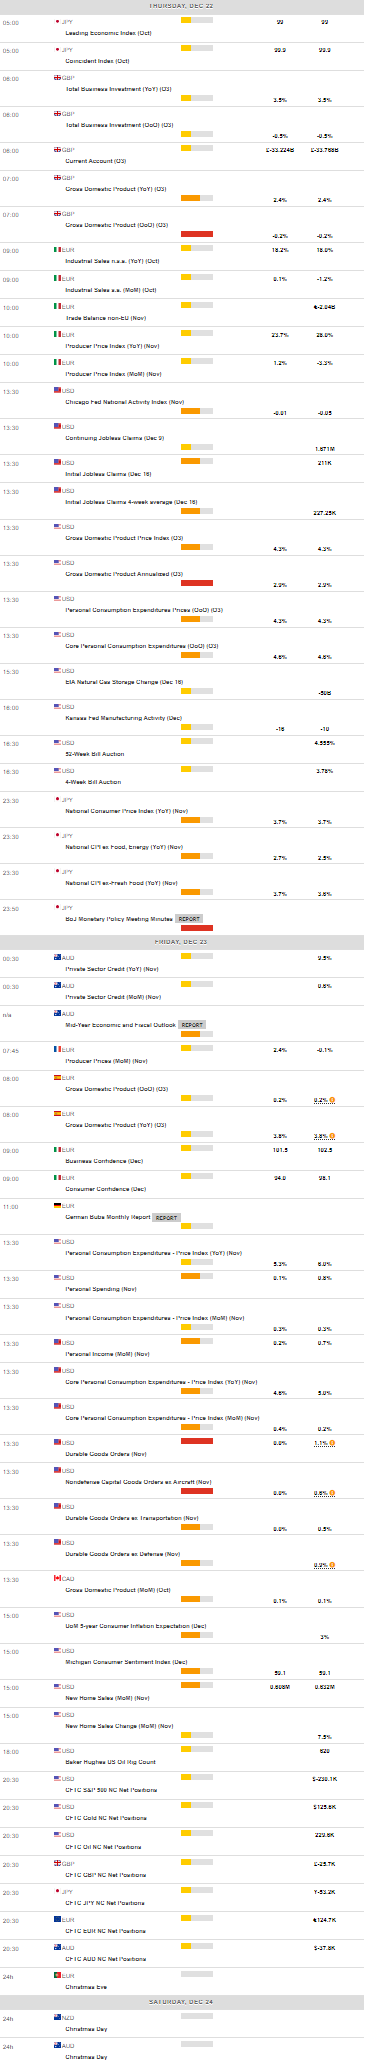
MACROECONOMIC EVENTS
All Information & Updates provided by:

All information relating to the financial markets available on this page has been prepared and issued by FXStreet (Forexstreet SL, Spain, Reg: B62498233) on the basis of publicly available information and all information believed to be reliable and does not conflict with Kuwaiti local laws, and all necessary care has been taken to before the company to ensure that the facts mentioned are correct from the source.
NCM Investment nor any of its directors or employees shall in any way be held responsible for the contents of this news, and the information contained on this page is intended only to provide clients with publicly available information and should not be construed as investment advice, report or analysis and/or constitute an offer or invitation to buy or sell financial instruments of any kind.
RISK WARNING: Forex and CFDs are highly risky leveraged products, as losses can exceed deposits. Please ensure you understand all the risks and take independent advice if necessary. NCM will segregate the clients based on the criteria of the regulator and its bylaws. NCM does not provide any advisory service; the material published does not constitute advice or a recommendation for a transaction in any financial instrument. NCM accepts no responsibility for any use of the content presented and any consequences of that use. Anyone acting on the information provided does so at their own risk.