
- Contact Us:
-

-

-

-


Daily Market Updates
23 Dec 2022
USDJPY
USD/JPY briefly dropped and retested the 131.60 region on Thursday before picking up some upside traction and reclaiming the 132.00 mark and above.
Spot, however, traded with humble gains amidst the continuation of the recovery in the greenback and the uptick in US yields across the curve, while investors seem to have shifted their attention to the potential next moves by the Bank of Japan, particularly following the unexpected hawkish tilt at the bank’s event earlier in the week.
On another front, and following the steep climb seen in the last couple of sessions, the 10-year JGB yields retreated to the 0.40% region after hitting the 0.50% zone on Wednesday.
In the Japanese docket, Foreign Bond Investment shrank by ¥941.8B in the week to December 17, while final readings saw the Coincident Index at 99.6 in October (from 100.8) and the Leading Economic Index at 98.6 (from 98.2) in the same period.
USD/JPY appears vulnerable to extra weakness in the short-term horizon and the door remains open to another test of the December low at 130.56 (December 20) just before the August low at 130.39 (August 2) and the key round level at 130.00. On the flip side, the 200-day SMA at 135.84 emerges as a significant hurdle prior to the weekly peak at 138.17 (December 15). The breakout of this region could motivate another weekly high at 139.89 (November 30) to emerge on the horizon before the round level at 140.00 and the provisional 100- and 55-day SMAs at 141.16 and 141.92, respectively. Up from here aligns the weekly high at 142.25 (November 21). The daily RSI looked stable around the 34 zone.
Resistance levels: 132.71 137.47 138.17 (4H chart)
Support levels: 130.56 129.51 127.08 (4H chart)
-638073332672060097.png)
GBPUSD
The British pound saw its momentum deteriorate further and dragged GBP/USD back to the sub-1.2000 region for the first time since late November on Thursday.
The better tone in the greenback coupled with discouraging results from UK fundamentals was enough to keep sellers at the helm of the sentiment surrounding the quid at the start of the second half of the week.
In fact, final readings for the Q3 GDP Growth Rate showed the economy contracted 0.3% vs. the previous quarter and expanded 1.9% over the last twelve months, both prints coming in below consensus. Additionally, the Current Account deficit shrank to £19.402B in Q3.
A sustainable breach of the key 200-day SMA at 1.2078 should accelerate losses to the weekly low at 1.1900 (November 30) prior to the provisional 55- and 100-day SMAs at 1.1745 and 1.1669, respectively. South from here, GBP/USD could revisit the November low at 1.1142 (November 4) ahead of the weekly low at 1.1059 (October 21). Just the opposite, the next up barrier turns up at the December high at 1.2446 (December 14) seconded by the May top at 1.2666 (May 27) and the 200-week SMA at 1.2929, all introducing the psychological 1.3000 yardstick. The daily RSI grinded lower to the 48 zone.
Resistance levels: 1.2147 1.2223 1.2241 (4H chart)
Support levels: 1.1991 1.1900 1.1778 (4H chart)
-638073332335831461.png)
AUDUSD
The continuation of the weekly recovery in the dollar forced AUD/USD to quickly fade Wednesday’s uptick and resume the downside well south of 0.6700 the figure on Thursday.
The Aussie dollar, in addition, derived extra weakness from the negative performance of the commodity complex, where both copper prices and the iron ore traded on the defensive.
There were no scheduled data releases in Oz on Thursday, whereas Housing Credit and Private Sector Credit will be in the limelight on Friday’s calendar.
Further downside in AUD/USD is now expected to test the December low at 0.6629 (December 20) ahead of the weekly low at 0.6584 (November 21) and the 55-day SMA at 0.6563. South from here emerges another weekly low at 0.6386 (November 10) prior to the November low at 0.6272 (November 3). Contrastingly, the always significant 200-day SMA at 0.6882 turns up as the immediate contention closely followed by the December top at 0.6893 (December 13) and the September peak at 0.6916 (September 13). If the pair leaves behind the latter, it could then challenge the psychological 0.7000 level just ahead of the weekly high at 0.7008 (August 26). The daily RSI lost further momentum and poked with 47.
Resistance levels: 0.6767 0.6893 0.6916 (4H chart)
Support levels: 0.6654 0.6629 0.6584 (4H chart)
-638073333013995177.png)
GOLD
Gold prices added to Wednesday’s losses and extended further the rejection from monthly peaks in the $1820/25 band on Thursday.
In fact, the precious metal remained well on the back foot against the backdrop of further gains in the greenback, while the bounce in US yields across the curve also collaborated with the daily decline.
No changes to the outlook for the yellow metal, at least in the very near term, as the next steps from the Federal Reserve as well as its probable tighter-for-longer stance should keep gold’s price action tilted to the cautious side.
A deeper decline in gold could now revisit the key 200-day SMA at $1784 ahead of the weekly low at $1773 (December 15) and the December low at $1765 (December 5). Once the latter is cleared, the metal could dispute the weekly low at $1727 (November 23) before the provisional 100- and 55-day SMAs in the $1720 region and followed by the 2022 low at $1614 (September 28). On the contrary, occasional bullish attempts should target the December high at $1824 (December 13) prior to the June top at $1879 (June 13) and the May peak at $1909 (May 5).
Resistance levels: $1823 $1833 $1841 (4H chart)
Support levels: $1794 $1783 $1773 $1764 (4H chart)
-638073333341472076.png)
CRUDE WTI
The upside momentum in prices of the WTI faltered just cents away from the key barrier at $80.00 per barrel on Thursday, triggering a corrective retracement soon afterwards.
Prices of the WTI lost some of its recent impetus on Thursday following fresh recession concerns, which were re-ignited after auspicious results from US final Q3 GDP figures and weekly claims, all kicking a potential pivot in the Fed’s policy further down the road.
In addition, the relentless surge of COVID cases in China favoured the resurgence of the spectre of a slowdown in the demand for crude oil, while imminent bad weather continued to hurt the US travel industry at the time when initial positive effects of a weekly drop in US crude oil supplies (as reported by the EIA on Wednesday) died off.
A sustainable surpass of the key $80.00 mark per barrel should allow extra gains in WTI to the December peak at $83.32 (December 1) prior to the 100-day SMA at $84.69 and the $90.08 level (November 11). If the WTI clears this level, it could prompt the November top at $93.73 to re-emerge on the horizon before the key 200-day SMA at $95.36. On the other hand, there are no support levels of note until the 2022 low at $70.10 (December 9), which is closely followed by the round level at $70.00 and comes ahead of the weekly low at $66.15 (December 20 2021). Further losses could confront the 200-week SMA at $65.17 prior to the December 2021 low at $62.46 (December 2).
Resistance levels: $79.87 $82.70 $83.32 (4H chart)
Support levels: $77.05 $74.42 $73.31 (4H chart)
-638073334032691902.png)
GER40
Equities measured by the German DAX 40 resumed the downside and quickly left behind Wednesday’s positive session, breaking below the key 14000 support and shedding 1.30% on Thursday.
Indeed, sentiment in the risk complex remained sour amidst the stronger dollar and further upside in US and German yields across the curve.
While better-than-expected results in the US calendar sustained further the Fed’s current tightening stance, ECB’s Vice-President de Guindos suggested that half percentage point increases in the policy rate could became the new standard, reinforcing the continuation of the hiking cycle by the ECB for the time being.
If losses in the DAX gather steam, then the focus of attention should shift to the December low at 13791 (December 20) ahead of the key 200-day SMA at 13569 and the 100-day SMA at 13377. The breakdown of the latter could open the door to the November low at 13022 (November 3) prior to the minor support at 12548 (October 21). Alternatively, there is a minor up barrier at the weekly top at 14160 (December 22) before the December peak at 14675 (December 13) and the June high at 14709 (June 6). The continuation of the uptrend could put the March top at 14925 (March 29) back on the traders’ radar ahead of the 2022 peak at 16285 (January 5). The daily RSI deflated to the sub-44 zone.
Best Performers: RWE AG ST, Hannover Rueck SE, Covestro
Worst Performers: Volkswagen VZO, Zalando SE, Infineon
Resistance levels: 14160 14675 14709 (4H chart)
Support levels: 13791 13454 13022 (4H chart)
-638073334822237910.png)
NASDAQ
Prospects for the continuation of the hiking cycle by the Federal Reserve were reinforced further following auspicious prints from the US labour market and Q3 GDP on Thursday, all impacting negatively on the US tech sector and dragging the Nasdaq Composite to levels last seen back in early November near the 10300 region, down more than 3% for the day.
In addition, the march north in the greenback and the rebound in US yields across the curve did nothing but put the tech benchmark under extra downside pressure.
Immediately to the downside in the Nasdaq Composite appears the November low at 10262 (November 4) ahead of the 2022 low at 10088 (October 13) and the weekly low at 9663 (June 29 2020). In the opposite direction, there is a minor up barrier at the weekly high at 10753 (December 21) seconded by the 55- and 100-day SMAs at 10901 and 11365, respectively. Further north emerges the December top at 11571 (December 13) seconded by the key 200-day SMA at 11850 and the September peak at 12270 (September 12). The surpass of this level exposes the August high at 13181 (August 16) prior to the weekly top at 13710 (April 21). The daily RSI dropped further and approached the 35 area.
Top Gainers: Core Scientific, IsoPlexis, ProQR Therapeutics NV
Top Losers: Ever-Glory, Dragonfly Energy Holdings Corp, Pacifico Acquisition Corp
Resistance levels: 10753 11352 11399 (4H chart)
Support levels: 10340 10262 10088 (4H chart)
-638073335319852227.png)
DOW JONES
Equities gauged by the three major US stock indices turned negative for the current week, as the resurgence of recession concerns weighed heavily on investors’ sentiment on Thursday.
Indeed, stocks saw their downside exacerbated after weekly Jobless Claims and final readings of the US Q3 GDP surprised to the upside, reinforcing the case of a tighter-for-longer Fed.
The positive prints from US fundamentals added to the improvement in the US Consumer Confidence (released earlier in the week) and showed once again the firm resilience of the US economy.
On balance, the Dow Jones dropped 2.16% to 32648, the S&P500 retreated 2.70% to 3774 and the tech-heavy Nasdaq Composite declined 3.42% to 10341.
Further retracement in the Dow Jones could see the key 200-day SMA at 32451 revisited in the near term before the November low at 31727 (November 3). The loss of the latter could pave the way for a move to the minor support at 30206 (October 21) ahead of the 2022 low at 28660 (October 13). Contrarily, the weekly top at 33437 (December 21) comes first seconded by the December peak at 34712 (December 13) and the April high at 35492. Extra gains could then see the February top at 35824 (February 9) revisited. The daily RSI sank to the vicinity of 42.
Top Performers: Procter&Gamble, Nike, Merck&Co
Worst Performers: Intel, Boeing, Microsoft
Resistance levels: 33437 34395 34712 (4H chart)
Support levels: 32581 32175 31727 (4H chart)
-638073334422718717.png)
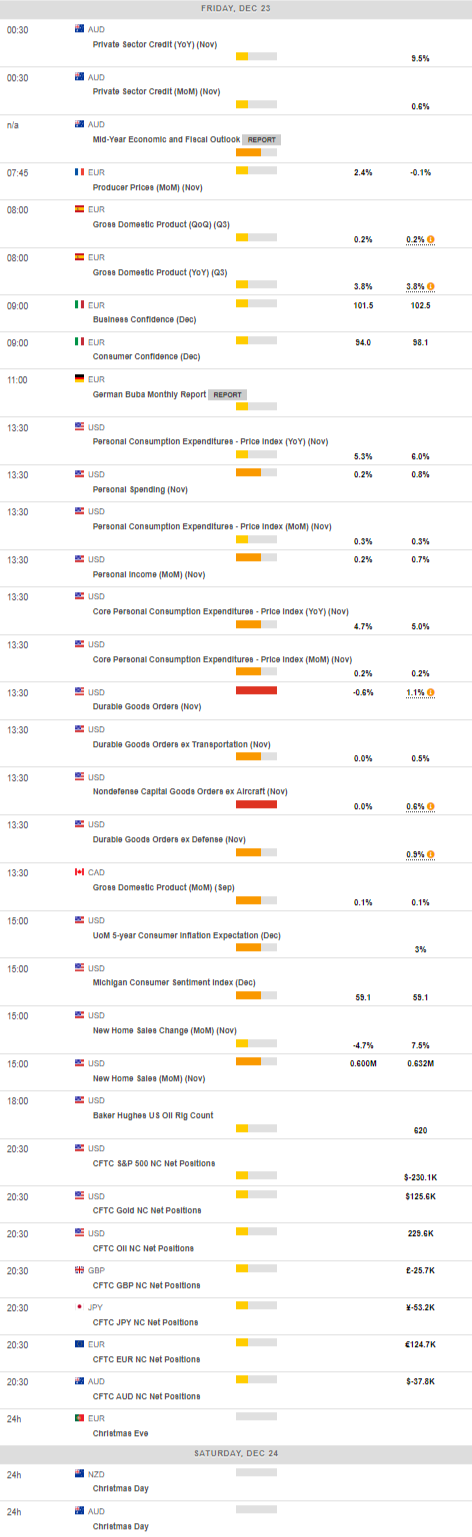
MACROECONOMIC EVENTS
All Information & Updates provided by:

All information relating to the financial markets available on this page has been prepared and issued by FXStreet (Forexstreet SL, Spain, Reg: B62498233) on the basis of publicly available information and all information believed to be reliable and does not conflict with Kuwaiti local laws, and all necessary care has been taken to before the company to ensure that the facts mentioned are correct from the source.
NCM Investment nor any of its directors or employees shall in any way be held responsible for the contents of this news, and the information contained on this page is intended only to provide clients with publicly available information and should not be construed as investment advice, report or analysis and/or constitute an offer or invitation to buy or sell financial instruments of any kind.
RISK WARNING: Forex and CFDs are highly risky leveraged products, as losses can exceed deposits. Please ensure you understand all the risks and take independent advice if necessary. NCM will segregate the clients based on the criteria of the regulator and its bylaws. NCM does not provide any advisory service; the material published does not constitute advice or a recommendation for a transaction in any financial instrument. NCM accepts no responsibility for any use of the content presented and any consequences of that use. Anyone acting on the information provided does so at their own risk.